Estimated zip code population in 2022: 192
Houses and condos: 90
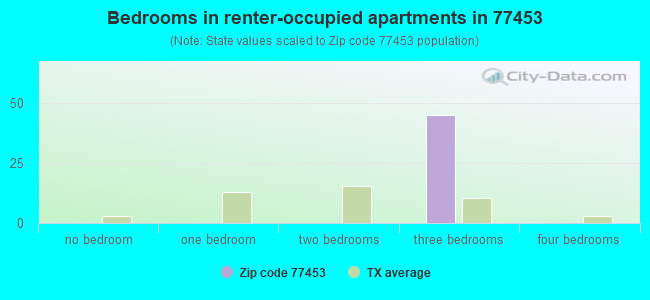
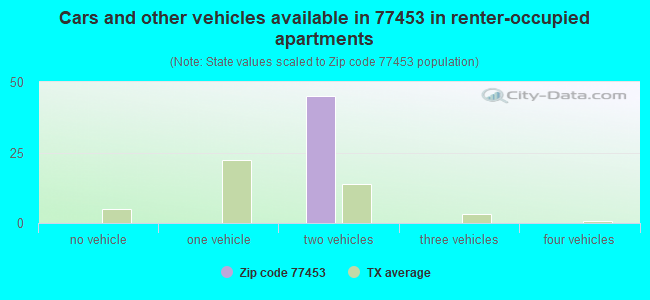
Renter-occupied apartments: 46
| % of renters here: | 72% |
| State: | 38% |
78.7
(low, U.S. average is 100)
Land area: 11.6
sq. mi.
Water area: 0.1
sq. mi.
| Population density: 17 people per square mile | | (very low). |
- OSM Map
- Google Map
- MSN Map
- OSM Map
- General Map
- Google Map
- MSN Map
- OSM Map
- Google Map
- MSN Map
- OSM Map
- Google Map
- MSN Map
Please wait while loading the map...
Business Search - 14 Million verified businesses
| Males: 91 |  (47.6%) (47.6%) |
| Females: 100 |  (52.4%) (52.4%) |
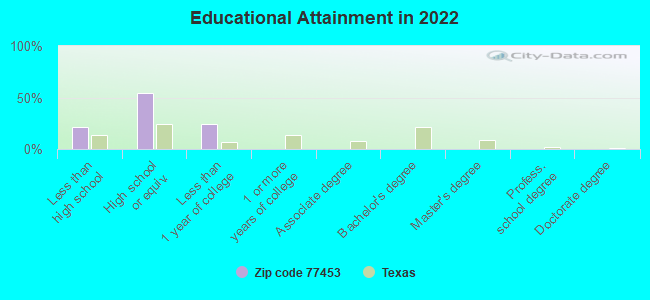
For population 25 years and over in 77453:
- High school or higher: 79.0%
- Bachelor's degree or higher: 0.0%
- Graduate or professional degree: 0.0%
- Mean travel time to work (commute): 34.6 minutes
For population 15 years and over in 77453:
- Never married: 0.0%
- Now married: 79.3%
- Separated: 0.0%
- Widowed: 20.7%
- Divorced: 0.0%
Zip code 77453 compared to state average:
- Median household income significantly below state average.
- Median house value significantly below state average.
- Unemployed percentage significantly below state average.
- Hispanic race population percentage above state average.
- Median age significantly below state average.
- Foreign-born population percentage below state average.
- Renting percentage above state average.
- Length of stay since moving in significantly above state average.
- Number of rooms per house below state average.
- House age above state average.
- Number of college students significantly below state average.
- Percentage of population with a bachelor's degree or higher significantly below state average.
Data:
100%
urban population.
Median resident age:| This zip code: | 11.7 years |
| Texas median age: | 35.6 years |
Average household size:| This zip code: | 3.0 people |
| Texas: | 2.6 people |
Averages for the 2004 tax year for zip code 77453, filed in 2005:
Average Adjusted Gross Income (AGI) in 2004: $25,258 (Individual Income Tax Returns)
| Here: | $25,258 |
| State: | $47,881 |
Salary/wage: $22,546 (reported on 89.6% of returns)
| Here: | $22,546 |
| State: | $41,947 |
(% of AGI for various income ranges: 83.3% for AGIs below $10k, 93.0% for AGIs $10k-25k, 93.0% for AGIs $25k-50k, 54.4% for AGIs $50k-75k)
Taxable interest for individuals: $158 (reported on 20.9% of returns)
| This zip code: | $158 |
| Texas: | $2,255 |
Profit/loss from business: +$538 (reported on 7.1% of returns)
Total tax: $3,111 (reported on 54.4% of returns)
(% of AGI for various income ranges: 2.1% for AGIs below $10k, 2.1% for AGIs $10k-25k, 5.1% for AGIs $25k-50k, 12.5% for AGIs $50k-75k)
Earned income credit: $2,179 (reported on 30.8% of returns)
Percentage of individuals using paid preparers for their 2004 taxes: 64.3%
(% for various income ranges: 58.0% for AGIs below $10k, 69.5% for AGIs $10k-25k, 63.0% for AGIs $25k-50k, 68.4% for AGIs $50k-75k)
Nearest zip codes: 77420,
77468,
77467,
77488,
77482,
77456.
Percentage of family households:| This zip code: | 70.1% |
| Texas: | 50.5% |
Percentage of households with unmarried partners:| This zip code: | 0.0% |
| Texas: | 48.7% |
No gay or lesbian households reported
Household received Food Stamps/SNAP in the past 12 months: 48
Household did not receive Food Stamps/SNAP in the past 12 months: 17
Women who did not have a birth in the past 12 months: 19 (19 now married, 0 unmarried)
Residents with income below the poverty level in 2022:
| This zip code: | 97.7% |
| Whole state: | 14.0% |
| This zip code: | 88.3% |
| Whole state: | 7.4% |

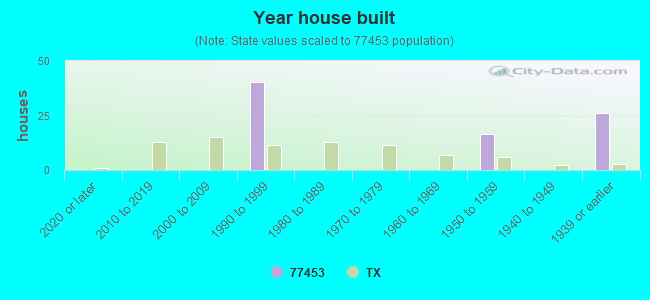
- Year house built (houses)
- 02020 or later
- 02010 to 2019
- 02000 to 2009
- 401990 to 1999
- 01980 to 1989
- 01970 to 1979
- 01960 to 1969
- 161950 to 1959
- 01940 to 1949
- 261939 or earlier
Zip code 77453 household income distribution in 2022
![Zip code 77453 household income distribution in 2022]()
- 19Less than $10,000
- 50$30,000 to $34,999
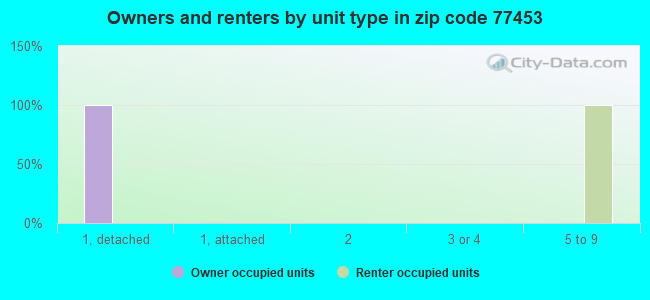
Housing units in structures:
- One, detached: 44
- 5 to 9: 45
Travel time to work (commute) in zip code 77453
![Travel time to work (commute) in zip code 77453]()
- 445 to 9 minutes
Percentage of zip code residents living and working in this county: 100.0%
Household type by relationship:
Households: 192
- Male householders: 46 (0 living alone), Female householders: 18 (18 living alone)
20 spouses (20 opposite-sex spouses), 0 unmarried partners, (0 opposite-sex unmarried partners), 107 children (107 natural, 0 adopted, 0 stepchildren), 0 grandchildren, 0 brothers or sisters, 0 parents, 0 foster children, 0 other relatives, 0 non-relatives
Size of nonfamily households: 18 1-person
107 married couples with children.
0 single-parent households ().
12.3% of residents of 77453 zip code speak English at home.
85.6% of residents speak Spanish at home (100% very well).
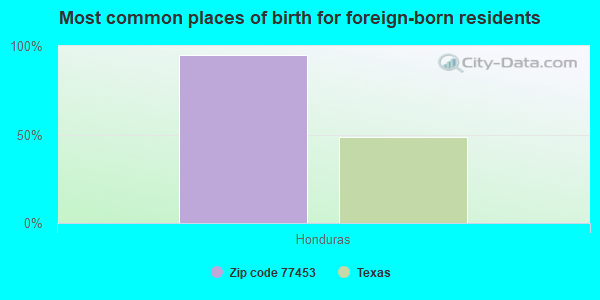
Foreign born population: 18 (9.8%)
(0.0%
of them are naturalized citizens)
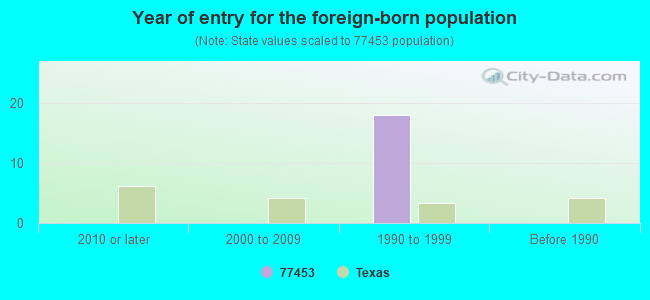
- Year of entry for the foreign-born population
- 02010 or later
- 02000 to 2009
- 181990 to 1999
- 0Before 1990
26.3%
Housing units lacking complete kitchen facilities: 26.1%
Place of birth for U.S.-born residents:
101% of the 77453 zip code residents lived in the same house 1 year ago.
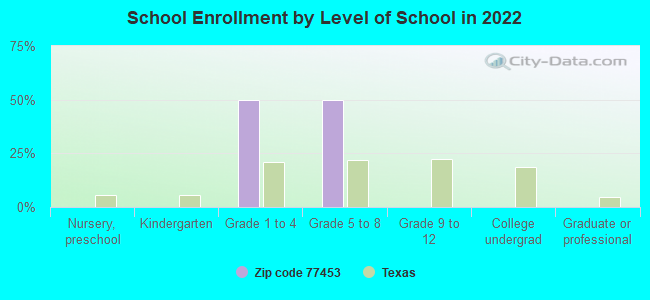
Private vs. public school enrollment:
Students in private schools in grades 1 to 8 (elementary and middle school):
Top industries in this zip code by the number of employees in 2005:
| Most common first names in zip code 77453 among deceased individuals |
| Name | Count | Lived (average) |
|---|
| John | 5 | 78.7 years |
| Joe | 3 | 69.0 years |
| Ernest | 3 | 76.7 years |
| Willie | 3 | 84.7 years |
| Frank | 2 | 71.5 years |
| Charles | 2 | 51.9 years |
| Josephine | 2 | 90.0 years |
| Patricia | 2 | 57.0 years |
| Robert | 2 | 64.9 years |
| Ruth | 2 | 92.0 years |
| Most common last names in zip code 77453 among deceased individuals |
| Last name | Count | Lived (average) |
|---|
| Bryant | 5 | 79.6 years |
| Weaver | 5 | 77.4 years |
| Mata | 4 | 76.0 years |
| Anderson | 3 | 74.0 years |
| Ziober | 3 | 74.0 years |
| Sciba | 3 | 80.3 years |
| Sliva | 3 | 83.3 years |
| Brown | 2 | 85.5 years |
| Burditt | 2 | 69.0 years |
| Galloway | 2 | 78.5 years |