Estimated zip code population in 2022: 4,213 Zip code population in 2010: 4,816 Zip code population in 2000: 4,953
Houses and condos: 1,703 Renter-occupied apartments: 247
% of renters here:
19%
State:
38%
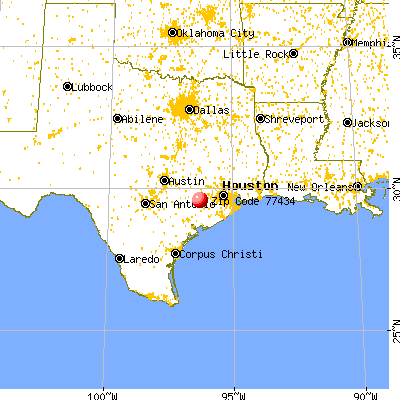
March 2022 cost of living index in zip code 77434: 75.3 (low, U.S. average is 100)
Land area: 191.0 sq. mi. Water area: 5.3 sq. mi.
Population density: 22 people per square mile
(very low).
OSM Map
General Map
Google Map
MSN Map
OSM Map
General Map
Google Map
MSN Map
OSM Map
General Map
Google Map
MSN Map
OSM Map
General Map
Google Map
MSN Map
Please wait while loading the map...
Real estate property taxes paid for housing units in 2022:
This zip code:
1.3% ($1,088)
Texas:
1.5% ($4,050)
Median real estate property taxes paid for housing units with mortgages in 2022: $1,149 (1.2%) Median real estate property taxes paid for housing units with no mortgage in 2022: $1,082 (1.5%)
Business Search- 14 Million verified businesses
Males: 2,207
(52.4%)
Females: 2,006
(47.6%)
For population 25 years and over in 77434:
High school or higher: 79.4%
Bachelor's degree or higher: 18.5%
Graduate or professional degree: 3.7%
Unemployed: 5.7%
Mean travel time to work (commute): 38.3 minutes
For population 15 years and over in 77434:
Never married: 42.4%
Now married: 39.0%
Separated: 1.0%
Widowed: 7.0%
Divorced: 10.6%
Zip code 77434 compared to state average:
Median house value significantly below state average.
Median age below state average.
Foreign-born population percentage below state average.
Renting percentage below state average.
Length of stay since moving in significantly above state average.
House age above state average.
Percentage of population with a bachelor's degree or higher below state average.
Estimated median house/condo value in 2022: $84,124
77434:
$84,124
Texas:
$275,400
According to our research of Texas and other state lists, there were 13 registered sex offenders living in 77434 zip code as of June 02, 2024. The ratio of all residents to sex offenders in zip code 77434 is 360 to 1. The ratio of registered sex offenders to all residents in this zip code is near the state average.
Median resident age:
This zip code:
30.0 years
Texas median age:
35.6 years
Average household size:
This zip code:
3.2 people
Texas:
2.6 people
Averages for the 2020 tax year for zip code 77434, filed in 2021:
Average Adjusted Gross Income (AGI) in 2020: $44,362 (Individual Income Tax Returns)
Here:
$44,362
State:
$77,054
Salary/wage: $37,933 (reported on 86.5% of returns)
Here:
$37,933
State:
$62,766
(% of AGI for various income ranges: 1573.8% for AGIs below $25k, 4152.7% for AGIs $25k-50k, 7124.2% for AGIs $50k-75k, 10382.5% for AGIs $75k-100k, 18785.0% for AGIs $100k-200k)
Taxable interest for individuals: $1,217 (reported on 16.8% of returns)
This zip code:
$1,217
Texas:
$2,665
(% of AGI for various income ranges: 13.1% for AGIs below $25k, 11.8% for AGIs $25k-50k, 32.1% for AGIs $50k-75k, 26.2% for AGIs $75k-100k, 248.7% for AGIs $100k-200k)
Ordinary dividends: $5,181 (reported on 7.7% of returns)
Here:
$5,181
State:
$10,044
(% of AGI for various income ranges: 11.1% for AGIs below $25k, 10.4% for AGIs $25k-50k, 99.5% for AGIs $50k-75k, 643.8% for AGIs $100k-200k)
Net capital gain/loss in AGI: +$43,617 (reported on 5.8% of returns)
Here:
+$43,617
State:
+$39,590
(% of AGI for various income ranges: 16.9% for AGIs $25k-50k, 73.7% for AGIs $50k-75k, 6260.0% for AGIs $100k-200k)
Profit/loss from business: +$3,222 (reported on 17.3% of returns)
Here:
+$3,222
State:
+$10,888
(% of AGI for various income ranges: 22.2% for AGIs below $25k, 145.8% for AGIs $50k-75k, 271.2% for AGIs $75k-100k, 768.8% for AGIs $100k-200k)
Taxable individual retirement arrangement distribution: $17,510 (reported on 4.8% of returns)
77434:
$17,510
Texas:
$24,740
(% of AGI for various income ranges: 28.5% for AGIs below $25k, 47.3% for AGIs $25k-50k, 202.1% for AGIs $50k-75k, 1176.2% for AGIs $100k-200k)
Total itemized deductions: $28,980 (reported on 2.4% of returns)
Here:
$28,980
State:
$40,428
(% of AGI for various income ranges: 87.2% for AGIs below $25k, 464.2% for AGIs $50k-75k)
Charity contributions: $8,300 (reported on 1.4% of returns)
Here:
$8,300
State:
$18,201
(% of AGI for various income ranges: 48.8% for AGIs $25k-50k)
Taxes paid: $8,800 (reported on 2.4% of returns)
77434:
$8,800
State:
$7,821
(% of AGI for various income ranges: 24.0% for AGIs below $25k, 149.5% for AGIs $50k-75k)
Earned income credit: $2,805 (reported on 28.4% of returns)
Here:
$2,805
State:
$2,584
(% of AGI for various income ranges: 176.9% for AGIs below $25k, 99.0% for AGIs $25k-50k)
Percentage of individuals using paid preparers for their 2020 taxes: 88.9%
Here:
89%
State:
92%
(% for various income ranges: 89.7% for AGIs below $25k, 89.4% for AGIs $25k-50k, 88.9% for AGIs $50k-75k, 91.7% for AGIs $75k-100k, 92.9% for AGIs $100k-200k, 0.0% for AGIs over 200k)
Averages for the 2012 tax year for zip code 77434, filed in 2013:
Average Adjusted Gross Income (AGI) in 2012: $38,970 (Individual Income Tax Returns)
Here:
$38,970
State:
$65,384
Salary/wage: $31,634 (reported on 88.1% of returns)
Here:
$31,634
State:
$52,524
(% of AGI for various income ranges: 83.9% for AGIs below $25k, 85.8% for AGIs $25k-50k, 81.2% for AGIs $50k-75k, 79.5% for AGIs $75k-100k, 67.3% for AGIs $100k-200k, 21.2% for AGIs over 200k)
Taxable interest for individuals: $1,095 (reported on 19.3% of returns)
This zip code:
$1,095
Texas:
$2,372
(% of AGI for various income ranges: 0.5% for AGIs below $25k, 0.4% for AGIs $25k-50k, 0.8% for AGIs $50k-75k, 1.3% for AGIs $75k-100k, 0.5% for AGIs $100k-200k, 0.2% for AGIs over 200k)
Ordinary dividends: $3,411 (reported on 9.4% of returns)
Here:
$3,411
State:
$9,721
(% of AGI for various income ranges: 0.3% for AGIs below $25k, 0.7% for AGIs $25k-50k, 1.7% for AGIs $50k-75k, 1.2% for AGIs $100k-200k, 1.1% for AGIs over 200k)
Net capital gain/loss in AGI: +$8,420 (reported on 7.4% of returns)
Here:
+$8,420
State:
+$35,319
(% of AGI for various income ranges: 11.0% for AGIs $100k-200k)
Profit/loss from business: +$8,766 (reported on 15.8% of returns)
Here:
+$8,766
State:
+$13,732
(% of AGI for various income ranges: 7.1% for AGIs below $25k, 3.5% for AGIs $25k-50k, 1.0% for AGIs $50k-75k, 8.5% for AGIs $100k-200k)
Taxable individual retirement arrangement distribution: $8,855 (reported on 5.4% of returns)
77434:
$8,855
Texas:
$19,511
(% of AGI for various income ranges: 1.1% for AGIs below $25k, 1.4% for AGIs $25k-50k, 2.5% for AGIs $50k-75k, 2.0% for AGIs $100k-200k)
Total itemized deductions: $19,076 (19% of AGI, reported on 10.4% of returns)
Here:
$19,076
State:
$24,724
Here:
18.7% of AGI
State:
15.9% of AGI
(% of AGI for various income ranges: 3.8% for AGIs below $25k, 3.9% for AGIs $25k-50k, 6.6% for AGIs $50k-75k, 6.2% for AGIs $75k-100k, 12.0% for AGIs $100k-200k)
Charity contributions: $4,462 (reported on 7.9% of returns)
Here:
$4,462
State:
$6,808
(% of AGI for various income ranges: 0.7% for AGIs $25k-50k, 0.7% for AGIs $50k-75k, 1.1% for AGIs $75k-100k, 3.3% for AGIs $100k-200k)
Taxes paid: $4,370 (reported on 9.9% of returns)
77434:
$4,370
State:
$6,921
(% of AGI for various income ranges: 0.5% for AGIs below $25k, 0.8% for AGIs $25k-50k, 0.9% for AGIs $50k-75k, 1.5% for AGIs $75k-100k, 3.5% for AGIs $100k-200k)
Earned income credit: $2,643 (reported on 33.2% of returns)
Here:
$2,643
State:
$2,570
(% of AGI for various income ranges: 10.6% for AGIs below $25k, 1.7% for AGIs $25k-50k)
Percentage of individuals using paid preparers for their 2012 taxes: 61.4%
Here:
61%
State:
51%
(% for various income ranges: 57.1% for AGIs below $25k, 63.5% for AGIs $25k-50k, 60.0% for AGIs $50k-75k, 66.7% for AGIs $75k-100k, 77.8% for AGIs $100k-200k, 100.0% for AGIs over 200k)
Averages for the 2004 tax year for zip code 77434, filed in 2005:
Average Adjusted Gross Income (AGI) in 2004: $29,795 (Individual Income Tax Returns)
Here:
$29,795
State:
$47,881
Salary/wage: $25,628 (reported on 85.8% of returns)
Here:
$25,628
State:
$41,947
(% of AGI for various income ranges: 99.2% for AGIs below $10k, 84.0% for AGIs $10k-25k, 85.2% for AGIs $25k-50k, 72.3% for AGIs $50k-75k, 70.7% for AGIs $75k-100k, 41.2% for AGIs over 100k)
Taxable interest for individuals: $1,926 (reported on 26.8% of returns)
This zip code:
$1,926
Texas:
$2,255
(% of AGI for various income ranges: 3.3% for AGIs below $10k, 1.1% for AGIs $10k-25k, 0.9% for AGIs $25k-50k, 2.2% for AGIs $50k-75k, 3.4% for AGIs $75k-100k, 2.1% for AGIs over 100k)
Taxable dividends: $3,154 (reported on 11.1% of returns)
Here:
$3,154
State:
$4,261
(% of AGI for various income ranges: 1.7% for AGIs below $10k, 0.4% for AGIs $10k-25k, 0.9% for AGIs $25k-50k, 2.1% for AGIs $50k-75k, 0.8% for AGIs $75k-100k, 1.7% for AGIs over 100k)
Net capital gain/loss: +$2,995 (reported on 10.5% of returns)
Here:
+$2,995
State:
+$16,110
(% of AGI for various income ranges: -0.8% for AGIs below $10k, 0.2% for AGIs $10k-25k, -0.1% for AGIs $25k-50k, 2.2% for AGIs $50k-75k, 0.6% for AGIs $75k-100k, 3.4% for AGIs over 100k)
Profit/loss from business: +$7,972 (reported on 15.2% of returns)
Here:
+$7,972
State:
+$11,013
(% of AGI for various income ranges: 5.4% for AGIs below $10k, 6.9% for AGIs $10k-25k, 4.0% for AGIs $25k-50k, 2.8% for AGIs $50k-75k, 0.4% for AGIs $75k-100k, 4.1% for AGIs over 100k)
IRA payment deduction: $3,621 (reported on 1.6% of returns)
77434:
$3,621
Texas:
$3,120
Total itemized deductions: $16,512 (22% of AGI, reported on 8.7% of returns)
Here:
$16,512
State:
$19,631
Here:
22.0% of AGI
State:
18.9% of AGI
(% of AGI for various income ranges: 2.8% for AGIs $10k-25k, 3.3% for AGIs $25k-50k, 7.0% for AGIs $50k-75k, 7.4% for AGIs $75k-100k, 6.7% for AGIs over 100k)
Charity contributions deductions: $5,007 (6% of AGI, reported on 7.3% of returns)
Here:
$5,007
State:
$4,753
Here:
6.4% of AGI
State:
4.2% of AGI
(% of AGI for various income ranges: 0.4% for AGIs $10k-25k, 0.7% for AGIs $25k-50k, 1.5% for AGIs $50k-75k, 1.2% for AGIs $75k-100k, 3.0% for AGIs over 100k)
Total tax: $4,515 (reported on 60.3% of returns)
77434:
$4,515
State:
$9,058
(% of AGI for various income ranges: 1.6% for AGIs below $10k, 3.3% for AGIs $10k-25k, 6.1% for AGIs $25k-50k, 9.3% for AGIs $50k-75k, 12.1% for AGIs $75k-100k, 20.6% for AGIs over 100k)
Earned income credit: $2,027 (reported on 35.5% of returns)
Here:
$2,027
State:
$2,024
Percentage of individuals using paid preparers for their 2004 taxes: 59.2%
Here:
59%
State:
57%
(% for various income ranges: 52.0% for AGIs below $10k, 62.7% for AGIs $10k-25k, 56.8% for AGIs $25k-50k, 63.1% for AGIs $50k-75k, 67.1% for AGIs $75k-100k, 72.5% for AGIs over 100k)
Likely homosexual households (counted as self-reported same-sex unmarried-partner households)
Lesbian couples: 1.0% of all households
Gay men: 0.0% of all households
Household received Food Stamps/SNAP in the past 12 months: 336 Household did not receive Food Stamps/SNAP in the past 12 months: 982
Women who had a birth in the past 12 months: 46 (47 now married, 0 unmarried) Women who did not have a birth in the past 12 months: 1,013 (277 now married, 740 unmarried)
Housing units in zip code 77434 with a mortgage: 360 (6 second mortgage) Houses without a mortgage: 5
Median monthly owner costs for units with a mortgage: $1,067 Median monthly owner costs for units without a mortgage: $487
Residents with income below the poverty level in 2022:
This zip code:
9.6%
Whole state:
14.0%
Residents with income below 50% of the poverty level in 2022:
This zip code:
4.0%
Whole state:
7.4%
Median number of rooms in houses and condos:
Here:
5.8
State:
6.3
Median number of rooms in apartments:
Here:
5.3
State:
4.0
Notable locations in this zip code not listed on our city pages
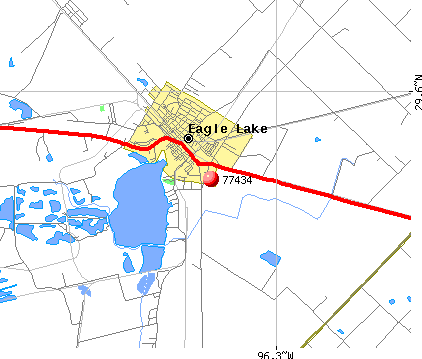
Notable locations in zip code 77434: Oakcrest Camp (A), Silver Creek Fish Hatchery (B), Rock Island Volunteer Fire Department (C), Eagle Lake Volunteer Fire Department (D), Eagle Lake Police Department and Crimestoppers (E), Prairie Edge Museum (F). Display/hide their locations on the map
Churches in zip code 77434 include: Saint Luke Church (A), White Cloud Church (B), Bonus Church (C), Elm Grove Church (D), Greater Rising Star Church (E), Mount Zion Church (F). Display/hide their locations on the map
Cemeteries: Mount Zion Cemetery (1), Elm Grove Cemetery (2), Frazer Cemetery (3), Lakeside Cemetery (4), Union Hill Cemetery (5). Display/hide their locations on the map
Lakes and reservoirs: Northington Lake (A), McCreary Lake (B), Lower Lake (C), Eagle Lake (D), Rockin Ranch Lake (E), Refuge Lake (F). Display/hide their locations on the map
In group quarters: 11 (-1 institutionalized population)
Size of family households: 585 2-persons, 157 3-persons, 49 4-persons, 156 5-persons, 36 6-persons, 37 7-or-more-persons
Size of nonfamily households: 211 1-person, 78 2-persons
714 married couples with children.
278 single-parent households (49 men, 229 women).
68.1% of residents of 77434 zip code speak English at home.
31.7% of residents speak Spanish at home (83% very well, 7% well, 10% not well).
0.2% of residents speak other language at home (100% very well).
Foreign born population: 322 (7.6%) (18.5% of them are naturalized citizens)
This zip code:
7.6%
Whole state:
17.2%
89%Honduras
5%Chile
2%Eritrea
5%German
2%American
2%English
1%Czech
1%Scotch-Irish
1%European
0%Irish
Year of entry for the foreign-born population
562010 or later
472000 to 2009
1541990 to 1999
60Before 1990
Facilities with environmental interests located in this zip code:
ANDERSON OF TEXAS (1503 E. MAIN in EAGLE LAKE, TX)
COMPLIANCE ACTIVITY (Tracking inspections of insecticide, fungicide, and rodenticide, and toxic substances)
Housing units lacking complete plumbing facilities: 13.9% Housing units lacking complete kitchen facilities: 14.0%
53.2%Electricity
27.0%Utility gas
19.8%Bottled, tank, or LP gas
Population in 1990: 4,543. Population change in the 1990s: +410 (+9.0%).
Place of birth for U.S.-born residents:
This state: 3,563
Northeast: 27
Midwest: 31
South: 164
West: 53
68% of the 77434 zip code residents lived in the same house 5 years ago. Out of people who lived in different houses, 65% lived in this county. Out of people who lived in different counties, 50% lived in Texas.
92% of the 77434 zip code residents lived in the same house 1 year ago. Out of people who lived in different houses, 26% moved from this county. Out of people who lived in different houses, 39% moved from different county within same state. Out of people who lived in different houses, 42% moved from different state.
Private vs. public school enrollment:
Students in private schools in grades 1 to 8 (elementary and middle school):
Here:
0.0%
Texas:
8.8%
Students in private schools in grades 9 to 12 (high school):
Here:
0.0%
Texas:
8.0%
Students in private undergraduate colleges: 25
Here:
9.1%
Texas:
16.2%
Occupation by median earnings in the past 12 months ($)
78,830Health diagnosing and treating practitioners and other technical occupations
61,216Material moving occupations
57,198Transportation occupations
54,102Education, training, and library occupations
50,013Installation, maintenance, and repair occupations
46,084Management occupations
Companies with federal contracts located in this zip code:
COLORADO COUNTY RICE MILL, INC (HWY 90 A in EAGLE LAKE, TX; small business) 20 employees, $2500000 revenue. Small Disadvantaged Business, Woman Owned Business: $7,772,081 in 41 contractsfrom 2001 to 2006
Contracts for Bakery and Cereal Products, Outerwear, Women's, Food, Oils and Fats by Farm Service Agency, Agricultural Stabilization and Conservation Service (disused code), Bureau of Prisoners/Federal Prison System Signed by year:2000: $0; 2001: $315,000; 2002: $51,000; 2003: $714,302; 2004: $2,326,451; 2005: $1,788,097; 2006: $2,577,231.
Biggest contracts:
$1,057,069 with Farm Service Agency for Bakery and Cereal Products. Signed on 2004-05-04. Completion date: 2004-07-20.
$797,180, same as above.Signed on 2006-07-19. Completion date: 2006-10-05.
$775,962, same as above.Signed on 2005-12-07. Completion date: 2006-02-20.
$723,078, same as above.Signed on 2006-02-06. Completion date: 2006-02-24.
Top industries in this zip code by the number of employees in 2005:
Health Care and Social Assistance: General Medical and Surgical Hospitals (100-249 employees: 1 establishment)
Administrative and Support and Waste Management and Remediation Services: Facilities Support Services (50-99: 1)
Health Care and Social Assistance: Nursing Care Facilities (50-99: 1)
Finance and Insurance: Commercial Banking (20-49: 1, 5-9: 1)
Real Estate and Rental and Leasing: Lessors of Nonresidential Buildings (except Miniwarehouses) (20-49: 1)
Mining: Industrial Sand Mining (10-19: 2)
Other Services (except Public Administration): Religious Organizations (10-19: 1, 5-9: 1, 1-4: 4)
People in group quarters in 2000:
50 people in nursing homes
6 people in hospitals or wards for drug/alcohol abuse
3 people in homes for the mentally retarded
Fatal accident statistics in 2013:
Fatal accident count: 1
Vehicles involved in fatal accidents: 1
Fatal accidents caused by drunken drivers: 0
Fatalities: 1
Persons involved in fatal accidents: 3
Pedestrians involved in fatal accidents: 1
Fatal accident statistics in 2012:
Fatal accident count: 3
Vehicles involved in fatal accidents: 6
Fatal accidents caused by drunken drivers: 0
Fatalities: 4
Persons involved in fatal accidents: 12
Pedestrians involved in fatal accidents: 0
2003 - 2018 National Fire Incident Reporting System (NFIRS) incidents
According to the data from the years 2003 - 2018 the average number of fires per year is 28. The highest number of fires - 55 took place in 2008, and the least - 9 in 2012. The data has a decreasing trend.
When looking into fire subcategories, the most incidents belonged to: Outside Fires (57.4%), and Structure Fires (27.1%).
Fire incident types reported to NFIRS in Zip Code 77434


 Nearest zip codes: 77454, 77412, 77436, 77460, 77435, 78935.


 According to the data from the years 2003 - 2018 the average number of fires per year is 28. The highest number of fires - 55 took place in 2008, and the least - 9 in 2012. The data has a decreasing trend.
 When looking into fire subcategories, the most incidents belonged to: Outside Fires (57.4%), and Structure Fires (27.1%).