Estimated zip code population in 2022: 30,503 Zip code population in 2010: 28,009 Zip code population in 2000: 19,815
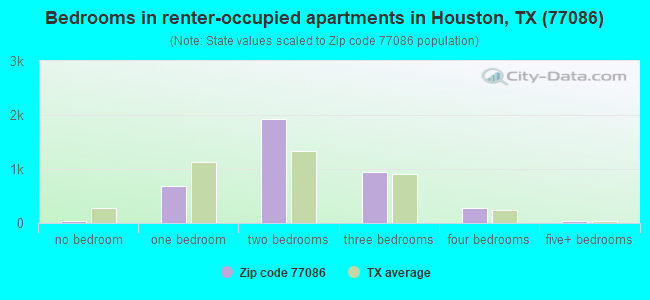
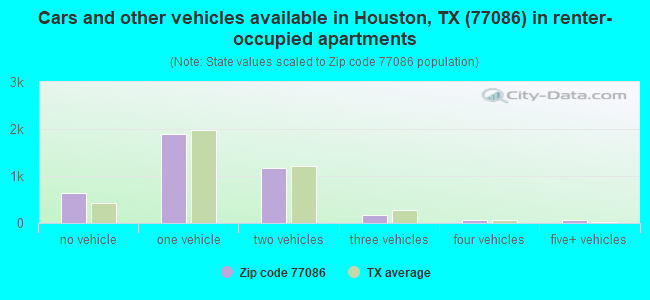
Houses and condos: 9,711 Renter-occupied apartments: 3,984
% of renters here:
43%
State:
38%
March 2022 cost of living index in zip code 77086: 95.8 (near average, U.S. average is 100)
Land area: 6.8 sq. mi. Water area: 0.0 sq. mi.
Population density: 4,495 people per square mile
(average).
OSM Map
General Map
Google Map
MSN Map
OSM Map
General Map
Google Map
MSN Map
OSM Map
General Map
Google Map
MSN Map
OSM Map
General Map
Google Map
MSN Map
Please wait while loading the map...
Real estate property taxes paid for housing units in 2022:
This zip code:
1.7% ($3,331)
Texas:
1.5% ($4,050)
Median real estate property taxes paid for housing units with mortgages in 2022: $3,738 (1.9%) Median real estate property taxes paid for housing units with no mortgage in 2022: $2,923 (1.5%)
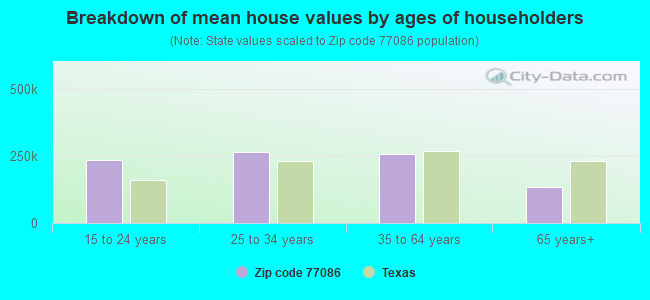
Estimated median house/condo value in 2022: $194,516
77086:
$194,516
Texas:
$275,400
According to our research of Texas and other state lists, there were 57 registered sex offenders living in 77086 zip code as of July 02, 2024. The ratio of all residents to sex offenders in zip code 77086 is 508 to 1. The ratio of registered sex offenders to all residents in this zip code is near the state average.
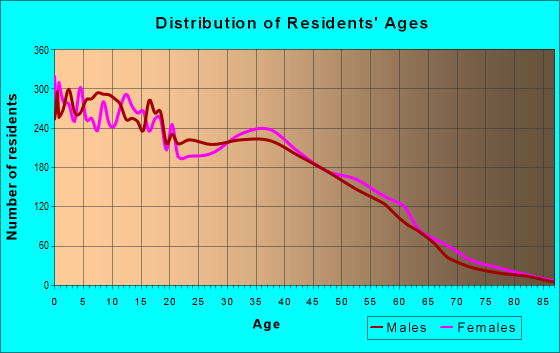
Median resident age:
This zip code:
32.8 years
Texas median age:
35.6 years
Average household size:
This zip code:
3.3 people
Texas:
2.6 people
Averages for the 2020 tax year for zip code 77086, filed in 2021:
Average Adjusted Gross Income (AGI) in 2020: $34,182 (Individual Income Tax Returns)
Here:
$34,182
State:
$77,054
Salary/wage: $34,032 (reported on 79.2% of returns)
Here:
$34,032
State:
$62,766
(% of AGI for various income ranges: 1187.4% for AGIs below $25k, 3607.7% for AGIs $25k-50k, 6763.4% for AGIs $50k-75k, 9152.1% for AGIs $75k-100k, 14479.2% for AGIs $100k-200k)
Taxable interest for individuals: $521 (reported on 7.7% of returns)
This zip code:
$521
Texas:
$2,665
(% of AGI for various income ranges: 2.0% for AGIs below $25k, 2.8% for AGIs $25k-50k, 9.3% for AGIs $50k-75k, 11.9% for AGIs $75k-100k, 58.8% for AGIs $100k-200k)
Ordinary dividends: $1,569 (reported on 3.1% of returns)
Here:
$1,569
State:
$10,044
(% of AGI for various income ranges: 2.5% for AGIs below $25k, 3.4% for AGIs $25k-50k, 11.4% for AGIs $50k-75k, 16.8% for AGIs $75k-100k, 67.7% for AGIs $100k-200k)
Net capital gain/loss in AGI: +$4,429 (reported on 3.6% of returns)
Here:
+$4,429
State:
+$39,590
(% of AGI for various income ranges: 1.3% for AGIs below $25k, 3.9% for AGIs $25k-50k, 19.9% for AGIs $50k-75k, 42.3% for AGIs $75k-100k, 527.7% for AGIs $100k-200k)
Profit/loss from business: +$8,372 (reported on 31.1% of returns)
Here:
+$8,372
State:
+$10,888
(% of AGI for various income ranges: 363.6% for AGIs below $25k, 296.3% for AGIs $25k-50k, 277.7% for AGIs $50k-75k, 166.8% for AGIs $75k-100k, 1048.5% for AGIs $100k-200k)
Taxable individual retirement arrangement distribution: $14,535 (reported on 2.1% of returns)
77086:
$14,535
Texas:
$24,740
(% of AGI for various income ranges: 9.4% for AGIs below $25k, 20.2% for AGIs $25k-50k, 43.2% for AGIs $50k-75k, 180.2% for AGIs $75k-100k, 515.4% for AGIs $100k-200k)
Total itemized deductions: $29,144 (reported on 3.6% of returns)
Here:
$29,144
State:
$40,428
(% of AGI for various income ranges: 22.8% for AGIs below $25k, 125.9% for AGIs $25k-50k, 358.4% for AGIs $50k-75k, 344.0% for AGIs $75k-100k, 807.3% for AGIs $100k-200k)
Charity contributions: $10,313 (reported on 2.5% of returns)
Here:
$10,313
State:
$18,201
(% of AGI for various income ranges: 2.9% for AGIs below $25k, 26.4% for AGIs $25k-50k, 89.1% for AGIs $50k-75k, 83.2% for AGIs $75k-100k, 289.6% for AGIs $100k-200k)
Taxes paid: $6,500 (reported on 3.1% of returns)
77086:
$6,500
State:
$7,821
(% of AGI for various income ranges: 3.2% for AGIs below $25k, 23.4% for AGIs $25k-50k, 74.3% for AGIs $50k-75k, 73.8% for AGIs $75k-100k, 153.1% for AGIs $100k-200k)
Earned income credit: $2,706 (reported on 30.1% of returns)
Here:
$2,706
State:
$2,584
(% of AGI for various income ranges: 156.3% for AGIs below $25k, 99.3% for AGIs $25k-50k, 2.1% for AGIs $50k-75k)
Percentage of individuals using paid preparers for their 2020 taxes: 89.1%
Here:
89%
State:
92%
(% for various income ranges: 87.7% for AGIs below $25k, 90.5% for AGIs $25k-50k, 91.0% for AGIs $50k-75k, 90.0% for AGIs $75k-100k, 89.5% for AGIs $100k-200k, 75.0% for AGIs over 200k)
Averages for the 2012 tax year for zip code 77086, filed in 2013:
Average Adjusted Gross Income (AGI) in 2012: $32,489 (Individual Income Tax Returns)
Here:
$32,489
State:
$65,384
Salary/wage: $32,608 (reported on 85.4% of returns)
Here:
$32,608
State:
$52,524
(% of AGI for various income ranges: 75.5% for AGIs below $25k, 89.9% for AGIs $25k-50k, 90.6% for AGIs $50k-75k, 90.3% for AGIs $75k-100k, 84.8% for AGIs $100k-200k, 59.7% for AGIs over 200k)
Taxable interest for individuals: $406 (reported on 8.3% of returns)
This zip code:
$406
Texas:
$2,372
(% of AGI for various income ranges: 0.1% for AGIs below $25k, 0.1% for AGIs $75k-100k, 0.2% for AGIs $100k-200k, 0.4% for AGIs over 200k)
Ordinary dividends: $2,688 (reported on 3.0% of returns)
Here:
$2,688
State:
$9,721
(% of AGI for various income ranges: 0.4% for AGIs below $25k, 0.2% for AGIs $25k-50k, 0.1% for AGIs $50k-75k, 0.2% for AGIs $75k-100k, 0.4% for AGIs $100k-200k)
Net capital gain/loss in AGI: +$1,413 (reported on 2.0% of returns)
Here:
+$1,413
State:
+$35,319
(% of AGI for various income ranges: 0.9% for AGIs $100k-200k)
Profit/loss from business: +$9,092 (reported on 25.2% of returns)
Here:
+$9,092
State:
+$13,732
(% of AGI for various income ranges: 20.4% for AGIs below $25k, 5.5% for AGIs $25k-50k, 2.5% for AGIs $50k-75k, 1.4% for AGIs $75k-100k, 2.1% for AGIs $100k-200k)
Taxable individual retirement arrangement distribution: $11,972 (reported on 2.2% of returns)
77086:
$11,972
Texas:
$19,511
(% of AGI for various income ranges: 0.6% for AGIs below $25k, 0.6% for AGIs $25k-50k, 0.9% for AGIs $50k-75k, 1.1% for AGIs $75k-100k, 1.7% for AGIs $100k-200k)
Total itemized deductions: $17,075 (29% of AGI, reported on 15.1% of returns)
Here:
$17,075
State:
$24,724
Here:
29.3% of AGI
State:
15.9% of AGI
(% of AGI for various income ranges: 3.5% for AGIs below $25k, 7.9% for AGIs $25k-50k, 10.6% for AGIs $50k-75k, 10.2% for AGIs $75k-100k, 11.0% for AGIs $100k-200k)
Charity contributions: $4,072 (reported on 10.9% of returns)
Here:
$4,072
State:
$6,808
(% of AGI for various income ranges: 0.5% for AGIs below $25k, 1.0% for AGIs $25k-50k, 1.9% for AGIs $50k-75k, 2.2% for AGIs $75k-100k, 2.7% for AGIs $100k-200k)
Taxes paid: $3,560 (reported on 14.3% of returns)
77086:
$3,560
State:
$6,921
(% of AGI for various income ranges: 0.6% for AGIs below $25k, 1.3% for AGIs $25k-50k, 2.2% for AGIs $50k-75k, 2.3% for AGIs $75k-100k, 2.6% for AGIs $100k-200k)
Earned income credit: $2,847 (reported on 34.8% of returns)
Here:
$2,847
State:
$2,570
(% of AGI for various income ranges: 11.6% for AGIs below $25k, 1.8% for AGIs $25k-50k)
Percentage of individuals using paid preparers for their 2012 taxes: 65.1%
Here:
65%
State:
51%
(% for various income ranges: 65.3% for AGIs below $25k, 65.9% for AGIs $25k-50k, 65.9% for AGIs $50k-75k, 58.7% for AGIs $75k-100k, 60.0% for AGIs $100k-200k, 66.7% for AGIs over 200k)
Averages for the 2004 tax year for zip code 77086, filed in 2005:
Average Adjusted Gross Income (AGI) in 2004: $28,145 (Individual Income Tax Returns)
Here:
$28,145
State:
$47,881
Salary/wage: $28,432 (reported on 88.6% of returns)
Here:
$28,432
State:
$41,947
(% of AGI for various income ranges: 88.0% for AGIs below $10k, 85.1% for AGIs $10k-25k, 93.1% for AGIs $25k-50k, 92.3% for AGIs $50k-75k, 88.3% for AGIs $75k-100k, 76.2% for AGIs over 100k)
Taxable interest for individuals: $625 (reported on 13.6% of returns)
This zip code:
$625
Texas:
$2,255
(% of AGI for various income ranges: 1.0% for AGIs below $10k, 0.3% for AGIs $10k-25k, 0.2% for AGIs $25k-50k, 0.3% for AGIs $50k-75k, 0.4% for AGIs $75k-100k, 0.8% for AGIs over 100k)
Taxable dividends: $926 (reported on 4.4% of returns)
Here:
$926
State:
$4,261
(% of AGI for various income ranges: 0.1% for AGIs below $10k, 0.1% for AGIs $10k-25k, 0.1% for AGIs $25k-50k, 0.2% for AGIs $50k-75k, 0.2% for AGIs $75k-100k, 0.2% for AGIs over 100k)
Net capital gain/loss: +$1,432 (reported on 3.5% of returns)
Here:
+$1,432
State:
+$16,110
(% of AGI for various income ranges: -0.0% for AGIs below $10k, -0.1% for AGIs $10k-25k, -0.0% for AGIs $25k-50k, 0.3% for AGIs $50k-75k, 0.4% for AGIs $75k-100k, 1.6% for AGIs over 100k)
Profit/loss from business: +$6,967 (reported on 20.6% of returns)
Here:
+$6,967
State:
+$11,013
(% of AGI for various income ranges: 24.2% for AGIs below $10k, 11.8% for AGIs $10k-25k, 2.9% for AGIs $25k-50k, 1.2% for AGIs $50k-75k, 2.0% for AGIs $75k-100k, 3.1% for AGIs over 100k)
IRA payment deduction: $2,747 (reported on 0.9% of returns)
77086:
$2,747
Texas:
$3,120
(% of AGI for various income ranges: 0.0% for AGIs $10k-25k, 0.1% for AGIs $25k-50k, 0.1% for AGIs $50k-75k, 0.2% for AGIs $75k-100k)
Total itemized deductions: $14,823 (30% of AGI, reported on 19.1% of returns)
Here:
$14,823
State:
$19,631
Here:
30.4% of AGI
State:
18.9% of AGI
(% of AGI for various income ranges: 3.7% for AGIs below $10k, 5.1% for AGIs $10k-25k, 11.5% for AGIs $25k-50k, 12.9% for AGIs $50k-75k, 11.5% for AGIs $75k-100k, 10.2% for AGIs over 100k)
Charity contributions deductions: $3,228 (6% of AGI, reported on 14.7% of returns)
Here:
$3,228
State:
$4,753
Here:
6.3% of AGI
State:
4.2% of AGI
(% of AGI for various income ranges: 0.3% for AGIs below $10k, 0.6% for AGIs $10k-25k, 1.7% for AGIs $25k-50k, 2.4% for AGIs $50k-75k, 2.8% for AGIs $75k-100k, 2.0% for AGIs over 100k)
Total tax: $2,914 (reported on 61.7% of returns)
77086:
$2,914
State:
$9,058
(% of AGI for various income ranges: 4.4% for AGIs below $10k, 3.7% for AGIs $10k-25k, 4.6% for AGIs $25k-50k, 8.0% for AGIs $50k-75k, 10.5% for AGIs $75k-100k, 15.6% for AGIs over 100k)
Earned income credit: $2,126 (reported on 34.5% of returns)
Here:
$2,126
State:
$2,024
Percentage of individuals using paid preparers for their 2004 taxes: 65.9%
Here:
66%
State:
57%
(% for various income ranges: 59.7% for AGIs below $10k, 72.4% for AGIs $10k-25k, 67.2% for AGIs $25k-50k, 58.8% for AGIs $50k-75k, 52.1% for AGIs $75k-100k, 51.2% for AGIs over 100k)
Likely homosexual households (counted as self-reported same-sex unmarried-partner households)
Lesbian couples: 0.2% of all households
Gay men: 0.3% of all households
Household received Food Stamps/SNAP in the past 12 months: 2,095 Household did not receive Food Stamps/SNAP in the past 12 months: 7,146
Women who had a birth in the past 12 months: 353 (291 now married, 64 unmarried) Women who did not have a birth in the past 12 months: 7,088 (2,627 now married, 4,476 unmarried)
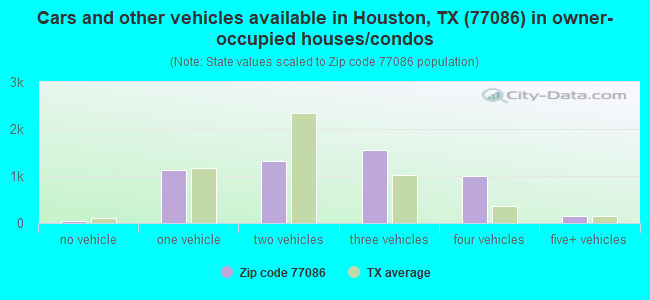
Housing units in zip code 77086 with a mortgage: 2,614 (233 second mortgage, 164 both second mortgage and home equity loan) Houses without a mortgage: 103
Median monthly owner costs for units with a mortgage: $1,569 Median monthly owner costs for units without a mortgage: $587
Residents with income below the poverty level in 2022:
This zip code:
15.9%
Whole state:
14.0%
Residents with income below 50% of the poverty level in 2022:
This zip code:
10.0%
Whole state:
7.4%
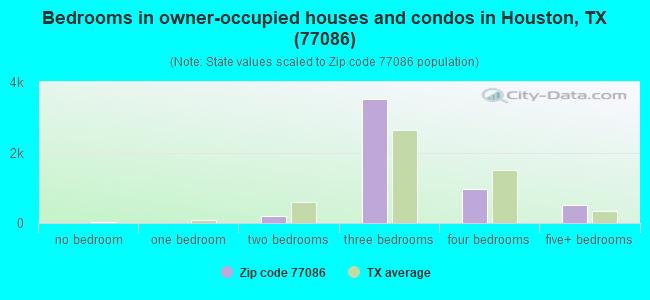
Median number of rooms in houses and condos:
Here:
6.2
State:
6.3
Median number of rooms in apartments:
Here:
4.2
State:
4.0
Notable locations in this zip code not listed on our city pages
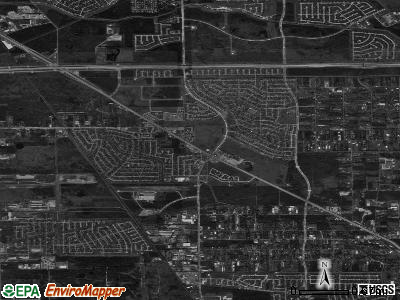
Notable locations in zip code 77086: Harris County Rural Fire Prevention District Number 20 Fire Station (A), Northwest Volunteer Fire Department Station 43 (B). Display/hide their locations on the map
Churches in zip code 77086 include: Highland Home Baptist Church (A), Wat Buddhavas of Houston (B), New Promise Land Missionary Baptist Church (C), Wright Grove Baptist Church (D), Willow Park Baptist Church (E). Display/hide their locations on the map
4,672 married couples with children.
2,512 single-parent households (664 men, 1,848 women).
37.8% of residents of 77086 zip code speak English at home.
53.1% of residents speak Spanish at home (49% very well, 15% well, 16% not well, 20% not at all).
0.6% of residents speak other Indo-European language at home (17% very well, 46% well, 37% not well).
8.0% of residents speak Asian or Pacific Island language at home (53% very well, 20% well, 23% not well, 4% not at all).
0.2% of residents speak other language at home (17% very well, 26% well, 43% not well, 15% not at all).
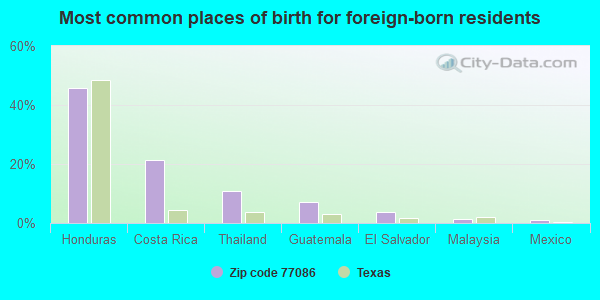
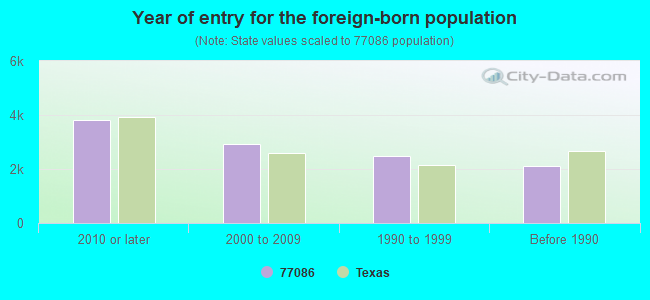
Foreign born population: 11,008 (36.1%) (35.0% of them are naturalized citizens)
Facilities with environmental interests located in this zip code:
ABB VETCO GRAY INC (11611 N HOUSTON ROSSLYN RD in HOUSTON, TX)
(Resource Conservation and Recovery Act (tracking hazardous waste))
ABER FENCE AND SUPPLY CO (12239 MOSIELEE in HOUSTON, TX)
(Resource Conservation and Recovery Act (tracking hazardous waste)) Business NAICS classification: ALL OTHER MISCELLANEOUS FABRICATED METAL PRODUCT MANUFACTURING. Organizations: THIBODEAUTIM (CONTACT/OPERATOR)
249 COLLISION (6615 BREEN in HOUSTON, TX)
Small Quantity Generators, between 100 kg and 1000 kg of hazardous waste/month (Resource Conservation and Recovery Act (tracking hazardous waste)) - notification Business NAICS classification: AUTOMOTIVE BODY, PAINT, AND INTERIOR REPAIR AND MAINTENANCE. Organizations: SON TRAN (CONTACT/OPERATOR)
AMERICAN ENGINE MASTERS (11622 N HOUSTON ROSSLYN in HOUSTON, TX)
(Resource Conservation and Recovery Act (tracking hazardous waste))
Housing units lacking complete plumbing facilities: 0.9% Housing units lacking complete kitchen facilities: 1.7%
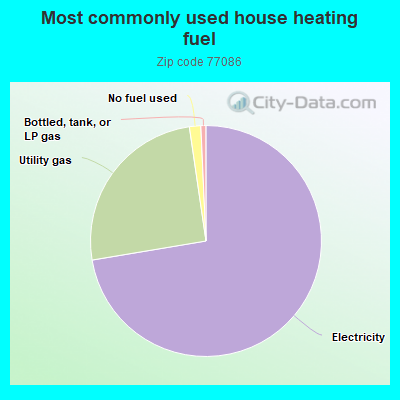
72.3%Electricity
25.3%Utility gas
1.6%No fuel used
0.7%Bottled, tank, or LP gas
Population in 1990: 16,075. Population change in the 1990s: +3,740 (+23.3%).
Place of birth for U.S.-born residents:
This state: 16,244
Northeast: 542
Midwest: 451
South: 1,290
West: 610
52% of the 77086 zip code residents lived in the same house 5 years ago. Out of people who lived in different houses, 84% lived in this county. Out of people who lived in different counties, 50% lived in Texas.
92% of the 77086 zip code residents lived in the same house 1 year ago. Out of people who lived in different houses, 79% moved from this county. Out of people who lived in different houses, 4% moved from different county within same state. Out of people who lived in different houses, 8% moved from different state. Out of people who lived in different houses, 6% moved from abroad.
Private vs. public school enrollment:
Students in private schools in grades 1 to 8 (elementary and middle school): 83
Here:
2.0%
Texas:
8.8%
Students in private schools in grades 9 to 12 (high school): 62
Here:
2.8%
Texas:
8.0%
Students in private undergraduate colleges: 184
Here:
12.5%
Texas:
16.2%
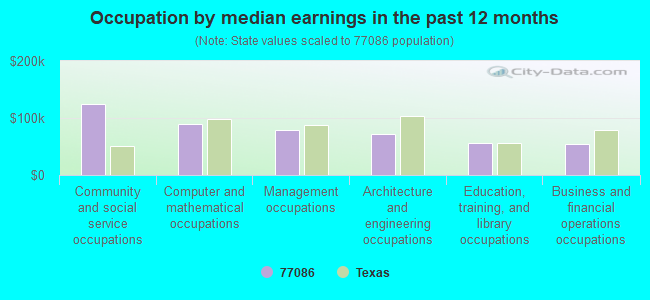
Occupation by median earnings in the past 12 months ($)
124,207Community and social service occupations
89,141Computer and mathematical occupations
79,230Management occupations
71,775Architecture and engineering occupations
56,827Education, training, and library occupations
54,631Business and financial operations occupations
Companies with federal contracts located in this zip code (HOUSTON, TX):
HAMILTON PRECISION ASSEMBLY SE (7101 BREEN DR; small business) : $537,652 in 8 contractsfrom 1999 to 2006
Contracts for Hardware, Commercial, Bushings, Rings, Shims, and Spacers by Defense Logistics Agency Signed by year:2000: $190,576; 2001: $99,001; 2002: $87,525; 2003: $0; 2004: $83,821; 2005: $4,368; 2006: $10,801.
Biggest contracts:
$99,640 with Defense Logistics Agency for Hardware, Commercial. Signed on 2000-05-23. Completion date: 2000-09-22.
$99,001, same as above.Signed on 2001-08-27. Completion date: 2001-08-27.
$90,936, same as above.Signed on 2000-01-22. Completion date: 2000-04-21.
$87,525, same as above.Signed on 2002-01-18. Completion date: 2002-04-18.
GARDNER DENVER WATER JETTING S (12300 N HOUSTON ROSILYN R) : $201,943 in 4 contractsfrom 2000 to 2005
$60,583 with Navy for Miscellaneous Maintenance and Repair Shop Specialized Equipment. Signed on 2003-03-28. Completion date: 2003-05-23.
$50,159, same as above.Signed on 2001-08-22. Completion date: 2001-10-12.
$48,063 with Army for Centrifugals, Separators, and Pressure and Vacuum Filters. Taking place in VA. Signed on 2000-09-22. Completion date: 2000-10-20.
$43,138 with Defense Logistics Agency for Miscellaneous Maintenance and Repair Shop Specialized Equipment. Signed on 2005-04-25. Completion date: 2005-05-25.
HANOVER COMPRESSOR COMPANY (12001 NORTH HOUSTON ROSSLY)
$24,999 with Navy for Maintenance, Repair and Rebuilding of Equipment -- Miscellaneous. Taking place in CA. Signed on 2005-05-02. Completion date: 2005-04-30.
KONECRANES INC (5125 HILTONVIEW RD) : $23,142 in 8 contractsfrom 2003 to 2005
Contracts for Winches, Hoists, Cranes, and Derricks, Cranes and Crane-Shovels, Maintenance, Repair and Rebuilding of Equipment -- Engine Accessories, Wire, Nonelectrical by Army, U.S. Coast Guard Signed by year:2000: $0; 2001: $0; 2002: $0; 2003: $8,213; 2004: $7,775; 2005: $7,154; 2006: $0.
Biggest contracts:
$7,154 with Army for Winches, Hoists, Cranes, and Derricks. Taking place in OH. Signed on 2005-02-11. Completion date: 2005-03-20.
$5,190 with U.S. Coast Guard for Cranes and Crane-Shovels. Signed on 2004-06-23. Completion date: 2004-07-23.
$4,600 with Army for Maintenance, Repair and Rebuilding of Equipment -- Engine Accessories. Signed on 2003-11-18. Completion date: 2003-12-17.
$3,077 with Army for Winches, Hoists, Cranes, and Derricks. Signed on 2003-10-10. Completion date: 2003-11-10.
TENTS OF THE SOUTHWEST INC (5920 KILLOUGH ST; small business) : $19,640 in 2 contractsfrom 2002 to 2003
$15,920 with Army for Lease or Rental of Equipment -- Miscellaneous. Signed on 2003-11-24. Completion date: 2003-12-08.
$3,720 with Army for Lease or Rental of Equipment -- Recreational and Athletic Equipment. Signed on 2002-05-03. Completion date: 2002-05-06.
COMPUTER WELD TECHNOLOGY INC (10702 OLD BAMMEL N HOUSTO; small business) : $15,295 in 2 contractsin 2005
$8,400 with Navy for ADPE System Configuration. Signed on 2005-02-08. Completion date: 2005-02-20.
$6,895 with Navy for Laundry and Dry Cleaning Equipment. Signed on 2005-09-26. Completion date: 2005-10-28.
Top industries in this zip code by the number of employees in 2005:
2003 - 2018 National Fire Incident Reporting System (NFIRS) incidents
Based on the data from the years 2003 - 2018 the average number of fires per year is 68. The highest number of fires - 186 took place in 2011, and the least - 2 in 2006. The data has a growing trend.
When looking into fire subcategories, the most incidents belonged to: Structure Fires (38.4%), and Outside Fires (35.3%).
Fire incident types reported to NFIRS in Zip Code 77086


 Nearest zip codes: 77066, 77064, 77038, 77088, 77067, 77040.


 Based on the data from the years 2003 - 2018 the average number of fires per year is 68. The highest number of fires - 186 took place in 2011, and the least - 2 in 2006. The data has a growing trend.
 When looking into fire subcategories, the most incidents belonged to: Structure Fires (38.4%), and Outside Fires (35.3%).