Estimated zip code population in 2022: 16,438 Zip code population in 2010: 17,814 Zip code population in 2000: 18,272
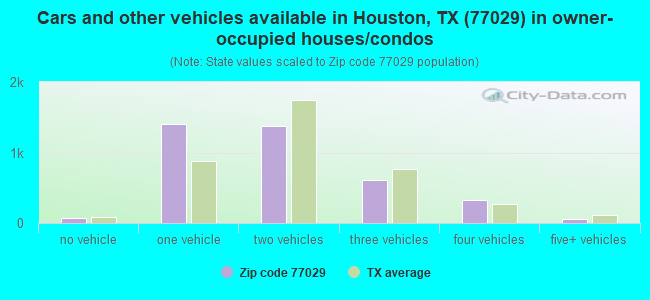
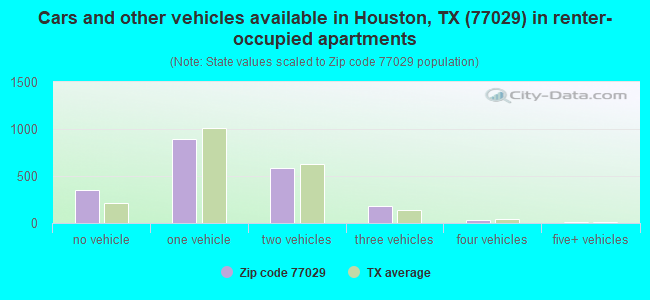
Houses and condos: 6,611 Renter-occupied apartments: 2,047
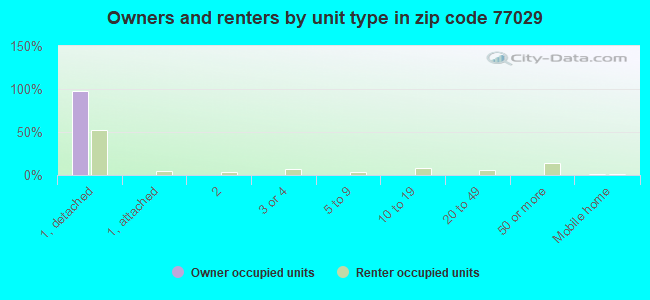
% of renters here:
35%
State:
38%
March 2022 cost of living index in zip code 77029: 94.4 (less than average, U.S. average is 100)
Land area: 13.0 sq. mi. Water area: 0.4 sq. mi.
Population density: 1,267 people per square mile
(low).
OSM Map
General Map
Google Map
MSN Map
OSM Map
General Map
Google Map
MSN Map
OSM Map
General Map
Google Map
MSN Map
OSM Map
General Map
Google Map
MSN Map
Please wait while loading the map...
Real estate property taxes paid for housing units in 2022:
This zip code:
1.6% ($1,987)
Texas:
1.5% ($4,050)
Median real estate property taxes paid for housing units with mortgages in 2022: $2,312 (1.8%) Median real estate property taxes paid for housing units with no mortgage in 2022: $1,850 (1.5%)
Averages for the 2020 tax year for zip code 77029, filed in 2021:
Average Adjusted Gross Income (AGI) in 2020: $34,575 (Individual Income Tax Returns)
Here:
$34,575
State:
$77,054
Salary/wage: $33,832 (reported on 81.3% of returns)
Here:
$33,832
State:
$62,766
(% of AGI for various income ranges: 1246.0% for AGIs below $25k, 3827.3% for AGIs $25k-50k, 6442.2% for AGIs $50k-75k, 9271.1% for AGIs $75k-100k, 15438.7% for AGIs $100k-200k)
Taxable interest for individuals: $898 (reported on 7.9% of returns)
This zip code:
$898
Texas:
$2,665
(% of AGI for various income ranges: 2.3% for AGIs below $25k, 7.0% for AGIs $25k-50k, 8.7% for AGIs $50k-75k, 11.4% for AGIs $75k-100k, 166.7% for AGIs $100k-200k)
Ordinary dividends: $1,706 (reported on 2.3% of returns)
Here:
$1,706
State:
$10,044
(% of AGI for various income ranges: 0.4% for AGIs below $25k, 8.1% for AGIs $25k-50k, 3.3% for AGIs $50k-75k, 3.2% for AGIs $75k-100k, 65.3% for AGIs $100k-200k)
Net capital gain/loss in AGI: +$8,153 (reported on 2.2% of returns)
Here:
+$8,153
State:
+$39,590
(% of AGI for various income ranges: 0.1% for AGIs below $25k, 9.1% for AGIs $25k-50k, 21.9% for AGIs $50k-75k, 678.7% for AGIs $100k-200k)
Profit/loss from business: +$6,016 (reported on 25.4% of returns)
Here:
+$6,016
State:
+$10,888
(% of AGI for various income ranges: 229.9% for AGIs below $25k, 116.1% for AGIs $25k-50k, 109.5% for AGIs $50k-75k, 155.7% for AGIs $75k-100k, 1391.3% for AGIs $100k-200k)
Taxable individual retirement arrangement distribution: $11,289 (reported on 2.3% of returns)
77029:
$11,289
Texas:
$24,740
(% of AGI for various income ranges: 10.4% for AGIs below $25k, 21.1% for AGIs $25k-50k, 67.6% for AGIs $50k-75k, 273.6% for AGIs $75k-100k)
Total itemized deductions: $32,908 (reported on 3.0% of returns)
Here:
$32,908
State:
$40,428
(% of AGI for various income ranges: 14.8% for AGIs below $25k, 104.4% for AGIs $25k-50k, 327.2% for AGIs $50k-75k, 415.0% for AGIs $75k-100k, 1019.3% for AGIs $100k-200k)
Charity contributions: $13,912 (reported on 2.2% of returns)
Here:
$13,912
State:
$18,201
(% of AGI for various income ranges: 30.6% for AGIs $25k-50k, 96.7% for AGIs $50k-75k, 112.5% for AGIs $75k-100k, 423.3% for AGIs $100k-200k)
Taxes paid: $6,357 (reported on 2.7% of returns)
77029:
$6,357
State:
$7,821
(% of AGI for various income ranges: 21.8% for AGIs $25k-50k, 58.9% for AGIs $50k-75k, 70.0% for AGIs $75k-100k, 142.7% for AGIs $100k-200k)
Earned income credit: $2,663 (reported on 30.6% of returns)
Here:
$2,663
State:
$2,584
(% of AGI for various income ranges: 166.2% for AGIs below $25k, 93.4% for AGIs $25k-50k, 1.4% for AGIs $50k-75k)
Percentage of individuals using paid preparers for their 2020 taxes: 85.9%
Here:
86%
State:
92%
(% for various income ranges: 83.7% for AGIs below $25k, 86.6% for AGIs $25k-50k, 88.5% for AGIs $50k-75k, 91.7% for AGIs $75k-100k, 91.3% for AGIs $100k-200k, 100.0% for AGIs over 200k)
Averages for the 2012 tax year for zip code 77029, filed in 2013:
Average Adjusted Gross Income (AGI) in 2012: $32,128 (Individual Income Tax Returns)
Here:
$32,128
State:
$65,384
Salary/wage: $31,757 (reported on 84.6% of returns)
Here:
$31,757
State:
$52,524
(% of AGI for various income ranges: 74.8% for AGIs below $25k, 88.7% for AGIs $25k-50k, 88.2% for AGIs $50k-75k, 89.0% for AGIs $75k-100k, 117.5% for AGIs $100k-200k)
Taxable interest for individuals: $721 (reported on 9.6% of returns)
This zip code:
$721
Texas:
$2,372
(% of AGI for various income ranges: 0.2% for AGIs below $25k, 0.1% for AGIs $25k-50k, 0.3% for AGIs $50k-75k, 0.7% for AGIs $100k-200k)
Ordinary dividends: $2,250 (reported on 3.2% of returns)
Here:
$2,250
State:
$9,721
(% of AGI for various income ranges: 0.3% for AGIs below $25k, 0.2% for AGIs $25k-50k, 0.6% for AGIs $100k-200k)
Net capital gain/loss in AGI: +$55 (reported on 1.4% of returns)
Here:
+$55
State:
+$35,319
Profit/loss from business: +$9,016 (reported on 19.2% of returns)
Here:
+$9,016
State:
+$13,732
(% of AGI for various income ranges: 16.2% for AGIs below $25k, 2.5% for AGIs $25k-50k, 1.8% for AGIs $50k-75k, 2.0% for AGIs $75k-100k, 7.7% for AGIs $100k-200k)
Taxable individual retirement arrangement distribution: $10,882 (reported on 2.9% of returns)
77029:
$10,882
Texas:
$19,511
(% of AGI for various income ranges: 0.8% for AGIs below $25k, 0.9% for AGIs $25k-50k, 0.7% for AGIs $50k-75k, 3.3% for AGIs $75k-100k)
Total itemized deductions: $19,087 (28% of AGI, reported on 9.9% of returns)
Here:
$19,087
State:
$24,724
Here:
28.0% of AGI
State:
15.9% of AGI
(% of AGI for various income ranges: 2.6% for AGIs below $25k, 5.5% for AGIs $25k-50k, 7.8% for AGIs $50k-75k, 7.0% for AGIs $75k-100k, 13.4% for AGIs $100k-200k)
Charity contributions: $5,161 (reported on 7.1% of returns)
Here:
$5,161
State:
$6,808
(% of AGI for various income ranges: 0.3% for AGIs below $25k, 0.8% for AGIs $25k-50k, 1.4% for AGIs $50k-75k, 1.3% for AGIs $75k-100k, 4.9% for AGIs $100k-200k)
Taxes paid: $3,606 (reported on 9.1% of returns)
77029:
$3,606
State:
$6,921
(% of AGI for various income ranges: 0.4% for AGIs below $25k, 0.8% for AGIs $25k-50k, 1.3% for AGIs $50k-75k, 1.2% for AGIs $75k-100k, 3.5% for AGIs $100k-200k)
Earned income credit: $2,649 (reported on 33.3% of returns)
Here:
$2,649
State:
$2,570
(% of AGI for various income ranges: 10.5% for AGIs below $25k, 1.6% for AGIs $25k-50k)
Percentage of individuals using paid preparers for their 2012 taxes: 64.3%
Here:
64%
State:
51%
(% for various income ranges: 61.0% for AGIs below $25k, 66.1% for AGIs $25k-50k, 69.7% for AGIs $50k-75k, 69.0% for AGIs $75k-100k, 86.7% for AGIs $100k-200k)
Averages for the 2004 tax year for zip code 77029, filed in 2005:
Average Adjusted Gross Income (AGI) in 2004: $27,443 (Individual Income Tax Returns)
Here:
$27,443
State:
$47,881
Salary/wage: $25,222 (reported on 85.8% of returns)
Here:
$25,222
State:
$41,947
(% of AGI for various income ranges: 84.8% for AGIs below $10k, 80.6% for AGIs $10k-25k, 90.2% for AGIs $25k-50k, 85.5% for AGIs $50k-75k, 76.7% for AGIs $75k-100k, 27.8% for AGIs over 100k)
Taxable interest for individuals: $758 (reported on 16.6% of returns)
This zip code:
$758
Texas:
$2,255
(% of AGI for various income ranges: 1.2% for AGIs below $10k, 0.5% for AGIs $10k-25k, 0.3% for AGIs $25k-50k, 0.4% for AGIs $50k-75k, 0.5% for AGIs $75k-100k, 0.8% for AGIs over 100k)
Taxable dividends: $969 (reported on 4.2% of returns)
Here:
$969
State:
$4,261
(% of AGI for various income ranges: 0.4% for AGIs below $10k, 0.1% for AGIs $10k-25k, 0.1% for AGIs $25k-50k, 0.1% for AGIs $50k-75k, 0.6% for AGIs $75k-100k, 0.1% for AGIs over 100k)
Net capital gain/loss: +$2,789 (reported on 2.9% of returns)
Here:
+$2,789
State:
+$16,110
(% of AGI for various income ranges: -0.2% for AGIs below $10k, 0.0% for AGIs $10k-25k, 0.2% for AGIs $25k-50k, 0.2% for AGIs $50k-75k, 1.0% for AGIs $75k-100k, 1.0% for AGIs over 100k)
Profit/loss from business: +$7,624 (reported on 16.0% of returns)
Here:
+$7,624
State:
+$11,013
(% of AGI for various income ranges: 11.4% for AGIs below $10k, 9.8% for AGIs $10k-25k, 1.9% for AGIs $25k-50k, 1.1% for AGIs $50k-75k, 3.2% for AGIs $75k-100k, 5.2% for AGIs over 100k)
IRA payment deduction: $2,070 (reported on 0.6% of returns)
77029:
$2,070
Texas:
$3,120
Total itemized deductions: $14,552 (25% of AGI, reported on 7.5% of returns)
Here:
$14,552
State:
$19,631
Here:
25.3% of AGI
State:
18.9% of AGI
(% of AGI for various income ranges: 2.2% for AGIs $10k-25k, 4.4% for AGIs $25k-50k, 5.6% for AGIs $50k-75k, 6.9% for AGIs $75k-100k, 3.8% for AGIs over 100k)
Charity contributions deductions: $4,005 (7% of AGI, reported on 6.2% of returns)
Here:
$4,005
State:
$4,753
Here:
6.7% of AGI
State:
4.2% of AGI
(% of AGI for various income ranges: 0.4% for AGIs $10k-25k, 0.9% for AGIs $25k-50k, 1.3% for AGIs $50k-75k, 2.1% for AGIs $75k-100k, 1.0% for AGIs over 100k)
Total tax: $2,945 (reported on 59.9% of returns)
77029:
$2,945
State:
$9,058
(% of AGI for various income ranges: 4.0% for AGIs below $10k, 3.5% for AGIs $10k-25k, 5.0% for AGIs $25k-50k, 8.5% for AGIs $50k-75k, 11.7% for AGIs $75k-100k, 12.1% for AGIs over 100k)
Earned income credit: $2,040 (reported on 35.6% of returns)
Here:
$2,040
State:
$2,024
Percentage of individuals using paid preparers for their 2004 taxes: 68.0%
Here:
68%
State:
57%
(% for various income ranges: 64.7% for AGIs below $10k, 70.8% for AGIs $10k-25k, 67.5% for AGIs $25k-50k, 64.5% for AGIs $50k-75k, 66.1% for AGIs $75k-100k, 76.3% for AGIs over 100k)
Household received Food Stamps/SNAP in the past 12 months: 1,401 Household did not receive Food Stamps/SNAP in the past 12 months: 4,521
Women who had a birth in the past 12 months: 194 (106 now married, 86 unmarried) Women who did not have a birth in the past 12 months: 3,872 (1,373 now married, 2,509 unmarried)
Housing units in zip code 77029 with a mortgage: 1,225 (56 second mortgage, 43 both second mortgage and home equity loan) Houses without a mortgage: 25
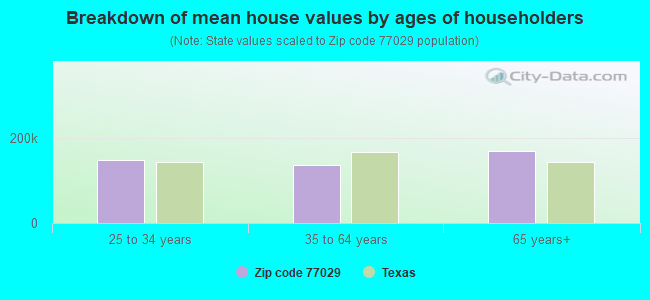
Median monthly owner costs for units with a mortgage: $1,310 Median monthly owner costs for units without a mortgage: $499
Residents with income below the poverty level in 2022:
This zip code:
18.7%
Whole state:
14.0%
Residents with income below 50% of the poverty level in 2022:
This zip code:
10.3%
Whole state:
7.4%
Median number of rooms in houses and condos:
Here:
5.6
State:
6.3
Median number of rooms in apartments:
Here:
4.2
State:
4.0
Notable locations in this zip code not listed on our city pages
Notable locations in zip code 77029: North Yard (A), Jacinto City Volunteer Fire Department (B), Houston Fire Department / Emergency Medical Services Station 41 (C), Houston Fire Department Station 42 (D), Jacinto City Police Department (E), City of Jacinto Fire Department (F), Houston Fire Station Number 41 (G), Houston Fire Station Number 42 (H), Jacinto City Hall (I), Jacinto City Library (J), Jacinto City Police Station (K). Display/hide their locations on the map
Churches in zip code 77029 include: Calvary Missionary Baptist Church (A), First Baptist Church of Jacinto City (B), Gethsemane Missionary Baptist Church (C), Gethsemane Baptist Church (D), Greater Mount Moriah Baptist Church (E), Jerusalem Baptist Church (F), Holland Avenue Baptist Church (G), Calvary City Church (H), Fidelity Baptist Church (I). Display/hide their locations on the map
Parks in zip code 77029 include: Pleasanton Manor Park (1), Port Houston Park (2), Pleasant Manor Park (3), Pleasantville Park (4), Smith Park (5), Wilke Park (6). Display/hide their locations on the map
In group quarters: 91 (-1 institutionalized population)
Size of family households: 1,488 2-persons, 862 3-persons, 788 4-persons, 319 5-persons, 286 6-persons, 183 7-or-more-persons
Size of nonfamily households: 1,786 1-person, 154 2-persons, 17 3-persons
1,398 married couples with children.
1,647 single-parent households (377 men, 1,270 women).
37.6% of residents of 77029 zip code speak English at home.
61.1% of residents speak Spanish at home (59% very well, 13% well, 19% not well, 10% not at all).
0.2% of residents speak other Indo-European language at home (100% well).
0.1% of residents speak other language at home (100% very well).
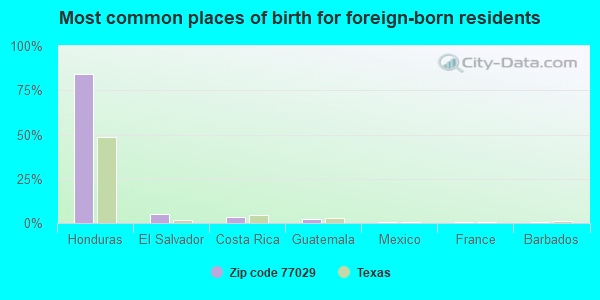
Foreign born population: 5,069 (30.8%) (38.5% of them are naturalized citizens)
This zip code:
30.8%
Whole state:
17.2%
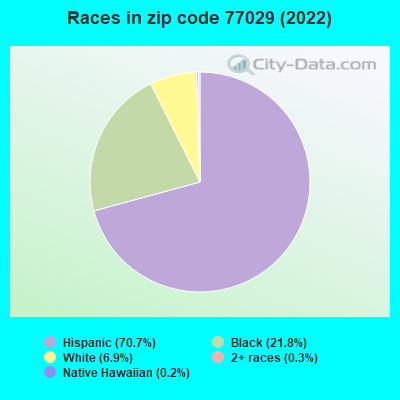
84%Honduras
5%El Salvador
3%Costa Rica
3%Guatemala
1%Mexico
0%France
0%Barbados
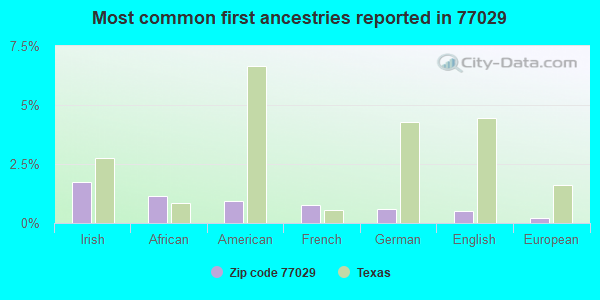
2%Irish
1%African
1%American
1%French
1%German
1%English
0%European
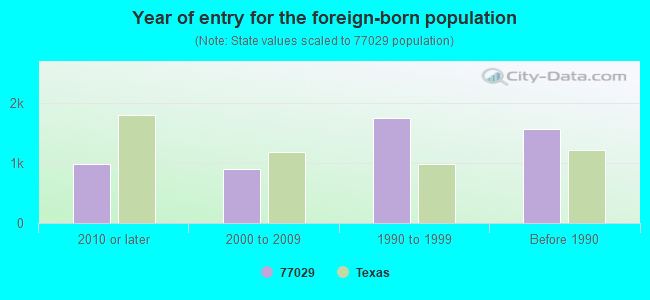
Year of entry for the foreign-born population
9732010 or later
8902000 to 2009
1,7441990 to 1999
1,560Before 1990
Facilities with environmental interests located in this zip code:
ANHEUSER-BUSCH, INC. (775 GELLHORN DRIVE in HOUSTON, TX)
AIR MAJOR (AIRS/AFS) CRITERIA AND HAZARDOUS AIR POLLUTANT INVENTORY (Inventory of air pollution sources) AIR MAJOR ("Best Available" air pollution technologies tracking) HAZARDOUS WASTE BIENNIAL REPORTER (Resource Conservation and Recovery Act (tracking hazardous waste)) Small Quantity Generators, between 100 kg and 1000 kg of hazardous waste/month (Resource Conservation and Recovery Act (tracking hazardous waste)) - notification TRI REPORTER (Tracking of toxic chemicals releasing facilities) Business SIC classification: MALT BEVERAGES Organizations: ANHEUSER-BUSCH INCORPORATED (CONTACT/OPERATOR)
Alternative names: ANHEUSER-BUSCH INC HOUSTON BREWERY, ANHEUSER-BUSH HOUSTON BREWERY, ANHEUSER-BUSH HOUSTON BREWERY, HOUSTON BREWERY, HOUSTON BREWERY
AMIGO TRUCK PARTS (710 MCCARTY in HOUSTON, TX)
(Integrated Compliance Information System) - ICIS-06-1999-0699, FORMAL ENFORCEMENT ACTION (Resource Conservation and Recovery Act (tracking hazardous waste)) Business SIC classification: MOTOR VEHICLE SUPPLIES AND NEW PARTS Business NAICS classification: GENERAL AUTOMOTIVE REPAIR.
ANCHOR GLASS CONTAINER PLANT 18 (4202 FIDELITY STREET in HOUSTON, TX)
AIR MAJOR (AIRS/AFS) CRITERIA AND HAZARDOUS AIR POLLUTANT INVENTORY (Inventory of air pollution sources) Small Quantity Generators, between 100 kg and 1000 kg of hazardous waste/month (Resource Conservation and Recovery Act (tracking hazardous waste)) - notification TRI REPORTER (Tracking of toxic chemicals releasing facilities) Business SIC classification: GLASS CONTAINERS Business NAICS classification: GLASS CONTAINER MANUFACTURING. Organizations: LONGHORN GLASS MANUFACTURING LP (CONTACT/OPERATOR)
Alternative names: ANCHOR GLASS CONTAINER CORP, ANCHOR GLASS CONTAINER CORP. PLANT 18, LONGHORN GLASS, LONGHORN GLASS MANUFACTURING, L.P.
ARTS AUTO PARTS (2018 MCCARTY ST in HOUSTON, TX)
(Integrated Compliance Information System) - ICIS-06-1996-0224, FORMAL ENFORCEMENT ACTION, Business SIC classification: MOTOR VEHICLE SUPPLIES AND NEW PARTS; MOTOR VEHICLE PARTS, USED; AUTO AND HOME SUPPLY STORES
AARO METALS CO (1924 MCCARTY in HOUSTON, TX)
(Resource Conservation and Recovery Act (tracking hazardous waste))
ABJ TRUCKING (1717 TURNING BASIN DR STE 370 in HOUSTON, TX)
(Resource Conservation and Recovery Act (tracking hazardous waste)) Organizations: BTX TRUCKING (CONTACT/OPERATOR)
, ABJ TRUCKING INC (CONTACT/OWNER)
Alternative names: AMERICAN INDUSTRIAL TECHNOLOGY, BTX TRUCKING
AIR THREADS INC (8921 MARKET STREET RD in HOUSTON, TX)
(Resource Conservation and Recovery Act (tracking hazardous waste)) Alternative names: AIR TREADS
APV INC (1101 A PLEASANTVILLE DRIVE in HOUSTON, TX)
Small Quantity Generators, between 100 kg and 1000 kg of hazardous waste/month (Resource Conservation and Recovery Act (tracking hazardous waste)) - notification Business NAICS classification: CONSUMER ELECTRONICS REPAIR AND MAINTENANCE.
ARROW TRUCKING CO. INC. (TXR000053561) (9640 CLINTON DRIVE, BLDG 23C in HOUSTON, TX)
AIR MONITORING SITE (Airborne pollution emission tracking) ENFORCEMENT/COMPLIANCE ACTIVITY (Integrated Compliance Information System)
A & L TRUCKING (TXR000053587) (9640 CLINTON DRIVE, BLDG. 20 in HOUSTON, TX)
ENFORCEMENT/COMPLIANCE ACTIVITY (Integrated Compliance Information System)
Housing units lacking complete plumbing facilities: 6.2% Housing units lacking complete kitchen facilities: 5.8%
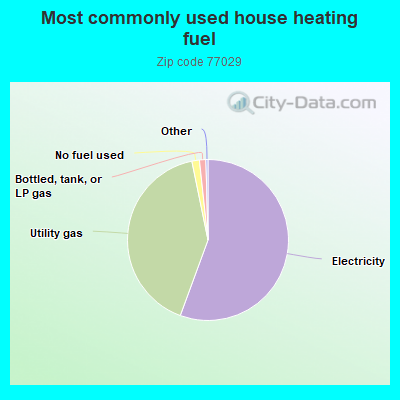
55.6%Electricity
41.2%Utility gas
1.5%No fuel used
1.3%Bottled, tank, or LP gas
Population in 1990: 17,739. Population change in the 1990s: +533 (+3.0%).
Place of birth for U.S.-born residents:
This state: 9,743
Northeast: 173
Midwest: 112
South: 726
West: 266
69% of the 77029 zip code residents lived in the same house 5 years ago. Out of people who lived in different houses, 89% lived in this county. Out of people who lived in different counties, 50% lived in Texas.
94% of the 77029 zip code residents lived in the same house 1 year ago. Out of people who lived in different houses, 75% moved from this county. Out of people who lived in different houses, 14% moved from different county within same state. Out of people who lived in different houses, 4% moved from different state. Out of people who lived in different houses, 6% moved from abroad.
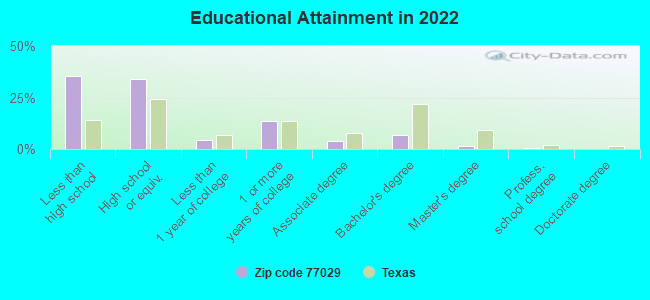
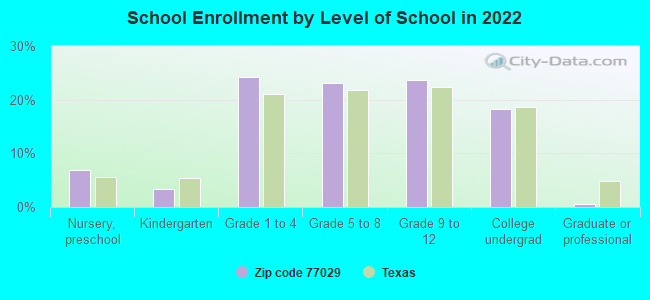
Private vs. public school enrollment:
Students in private schools in grades 1 to 8 (elementary and middle school): 21
Here:
1.1%
Texas:
8.8%
Students in private schools in grades 9 to 12 (high school): 47
Here:
4.9%
Texas:
8.0%
Students in private undergraduate colleges: 43
Here:
5.8%
Texas:
16.2%
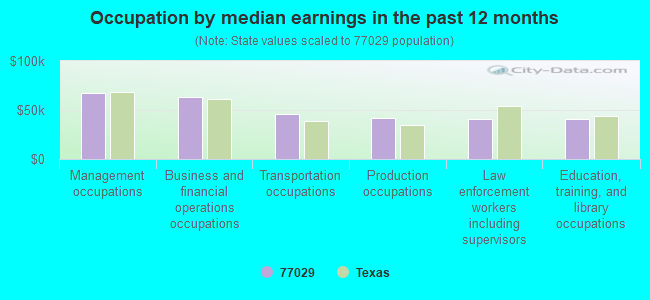
Occupation by median earnings in the past 12 months ($)
67,227Management occupations
63,158Business and financial operations occupations
45,888Transportation occupations
42,143Production occupations
41,164Law enforcement workers including supervisors
41,148Education, training, and library occupations
Companies with federal contracts located in this zip code (HOUSTON, TX):
STEWART & STEVENSON SERVICES I (8631 EAST FWY) : $11,122,664 in 54 contractsfrom 2000 to 2006
Contracts for Vehicular Power Transmission Components, Generators and Generators Sets, Electrical, Miscellaneous Vehicular Components, Fuel Burning Equipment Units, and moreby Army, Defense Logistics Agency, Air Force, Navy, and others Signed by year:2000: $104,689; 2001: $80,290; 2002: $195,628; 2003: $213,792; 2004: $10,292,460; 2005: $198,095; 2006: $37,710.
Biggest contracts:
$9,873,116 with Army for Vehicular Power Transmission Components. Signed on 2004-02-11. Completion date: 2004-08-15.
$230,943 with Defense Logistics Agency for Vehicular Power Transmission Components. Taking place in OR. Signed on 2004-06-30. Completion date: 2004-08-29.
$137,800 with Army for Generators and Generators Sets, Electrical. Signed on 2003-04-09. Completion date: 2003-06-04.
$82,944 with Air Force for Miscellaneous Vehicular Components. Taking place in AK. Signed on 2002-05-02. Completion date: 2002-10-02.
FABRICATED PRODUCTS, INC (9200 MARKET STREET) : $99,427 in 3 contractsfrom 2001 to 2002
$83,148 with Navy for Non-nuclear Ship Repair (East) Ship repair (including overhauls and conversions) performed on non-nuclear propelled and nonpropelled ships east of the 108th meridian. Taking place in VA. Signed on 2001-04-05. Completion date: 2001-04-13.
$11,379 with Navy for Maintenance, Repair or Alteration of Real Property -- Other Non-Building Facilities. Taking place in VA. Signed on 2002-02-21. Completion date: 2002-04-19.
$4,900, same as above.Signed on 2001-08-03. Completion date: 2001-08-16.
HOUSTON WIRE & CABLE COMPANY I (10201 NORTH LOOP E; small business) : $84,309 in 9 contractsin 2005
Contracts for Wire and Cable, Electrical, Cable, Cord, and Wire Assemblies: Communications Equipment, Electrical Hardware and Supplies by Army, U.S. Army Corps of Engineers - civil program financing only, Bureau of Prisoners/Federal Prison System Signed by year:2000: $0; 2001: $0; 2002: $0; 2003: $0; 2004: $0; 2005: $84,309; 2006: $0.
Biggest contracts:
$18,175 with Army for Wire and Cable, Electrical. Taking place in WA. Signed on 2005-03-29. Completion date: 2005-03-28.
$18,175 with U.S. Army Corps of Engineers - civil program financing only for Wire and Cable, Electrical. Taking place in WA. Signed on 2005-03-29. Completion date: 2005-03-28.
$12,025 with Army for Cable, Cord, and Wire Assemblies: Communications Equipment. Signed on 2005-12-08. Completion date: 2005-12-27.
$9,975 with Army for Wire and Cable, Electrical. Taking place in WA. Signed on 2005-04-22. Completion date: 2005-05-31.
PORTA-KAMP CONSTRUCTION INC (555 GELLHORN DR; small business)
$84,002 with Navy for Prefabricated and Portable Buildings. Signed on 2000-06-16. Completion date: 2000-08-31.
CUSA, GCT, LLC (950 MCCARTY ST) : $50,788 in 7 contractsfrom 2002 to 2005
Contracts for Passenger Motor Charter Service, Motor Passenger Services by Army Signed by year:2000: $0; 2001: $0; 2002: $10,320; 2003: $10,320; 2004: $10,320; 2005: $19,828; 2006: $0.
Biggest contracts:
$10,800 with Army for Passenger Motor Charter Service. Signed on 2005-06-01. Completion date: 2005-06-11.
$10,320, same as above.Signed on 2004-06-03. Completion date: 2004-06-12.
$10,320, same as above.Signed on 2003-05-30. Completion date: 2003-06-07.
$8,600 with Army for Motor Passenger Services. Signed on 2002-05-08. Completion date: 2002-06-08.
Top industries in this zip code by the number of employees in 2005:
Management of Companies and Enterprises: Corporate, Subsidiary, and Regional Managing Offices (500-999 employees: 1 establishment, 20-49 employees: 1 establishment, 5-9 employees: 2 establishments, 1-4 employees: 1 establishment)
Wholesale Trade: General Line Grocery Merchant Wholesalers (500-999: 1)
Other Services (except Public Administration): Commercial and Industrial Machinery and Equipment (except Automotive and Electronic) Repair and Maintenance (250-499: 1, 100-249: 1, 20-49: 1, 10-19: 2, 5-9: 1, 1-4: 3)
Wholesale Trade: Automobile and Other Motor Vehicle Merchant Wholesalers (250-499: 1, 100-249: 1, 10-19: 3, 5-9: 2, 1-4: 6)
Health Care and Social Assistance: Home Health Care Services (250-499: 1, 100-249: 1, 10-19: 1, 1-4: 1)
People in group quarters in 2010:
133 people in nursing facilities/skilled-nursing facilities
People in group quarters in 2000:
133 people in nursing homes
8 people in crews of maritime vessels
6 people in hospitals/wards and hospices for chronically ill
6 people in hospices or homes for chronically ill
6 people in homes for the mentally retarded
Fatal accident statistics in 2014:
Fatal accident count: 10
Vehicles involved in fatal accidents: 17
Fatal accidents caused by drunken drivers: 3
Fatalities: 11
Persons involved in fatal accidents: 17
Pedestrians involved in fatal accidents: 4
Fatal accident statistics in 2013:
Fatal accident count: 3
Vehicles involved in fatal accidents: 5
Fatal accidents caused by drunken drivers: 1
Fatalities: 4
Persons involved in fatal accidents: 7
Pedestrians involved in fatal accidents: 0
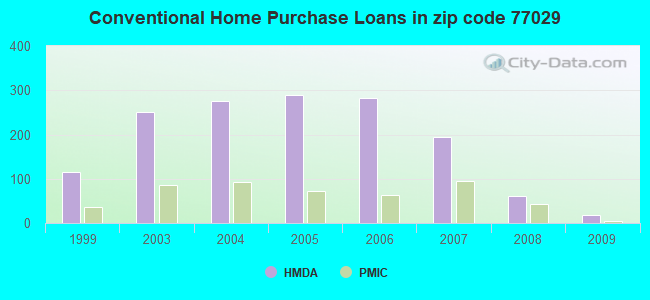
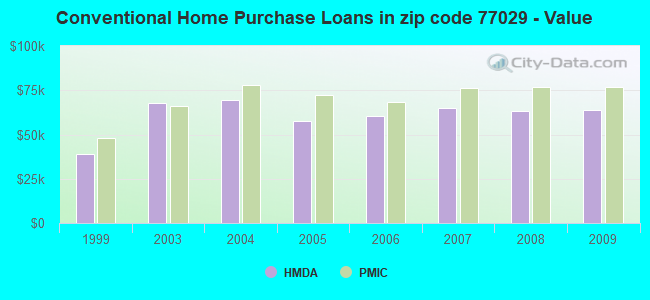
Home Mortgage Disclosure Act Aggregated Statistics For Year 2009 (Based on 6 full and 8 partial tracts)
A) FHA, FSA/RHS & VA Home Purchase Loans
B) Conventional Home Purchase Loans
C) Refinancings
D) Home Improvement Loans
F) Non-occupant Loans on < 5 Family Dwellings (A B C & D)
G) Loans On Manufactured Home Dwelling (A B C & D)
Number
Average Value
Number
Average Value
Number
Average Value
Number
Average Value
Number
Average Value
Number
Average Value
LOANS ORIGINATED
52
$72,055
18
$63,625
64
$61,999
22
$31,741
9
$45,001
1
$31,380
APPLICATIONS APPROVED, NOT ACCEPTED
5
$54,136
4
$100,170
7
$61,541
1
$5,000
0
$0
0
$0
APPLICATIONS DENIED
16
$81,240
23
$70,513
72
$55,142
106
$27,190
21
$37,916
0
$0
APPLICATIONS WITHDRAWN
13
$75,418
8
$46,369
16
$70,172
8
$25,749
0
$0
0
$0
FILES CLOSED FOR INCOMPLETENESS
4
$105,225
2
$74,765
8
$61,192
6
$23,878
1
$92,000
0
$0
Aggregated Statistics For Year 2008 (Based on 6 full and 8 partial tracts)
A) FHA, FSA/RHS & VA Home Purchase Loans
B) Conventional Home Purchase Loans
C) Refinancings
D) Home Improvement Loans
E) Loans on Dwellings For 5+ Families
F) Non-occupant Loans on < 5 Family Dwellings (A B C & D)
G) Loans On Manufactured Home Dwelling (A B C & D)
Number
Average Value
Number
Average Value
Number
Average Value
Number
Average Value
Number
Average Value
Number
Average Value
Number
Average Value
LOANS ORIGINATED
34
$78,563
60
$63,449
91
$55,193
52
$37,139
1
$21,783,000
25
$44,072
0
$0
APPLICATIONS APPROVED, NOT ACCEPTED
1
$73,880
12
$75,037
26
$55,153
6
$15,345
0
$0
9
$52,756
1
$106,000
APPLICATIONS DENIED
10
$90,166
56
$69,814
195
$64,595
121
$36,674
3
$474,597
38
$51,884
2
$40,675
APPLICATIONS WITHDRAWN
4
$66,575
17
$68,387
39
$82,022
10
$43,830
0
$0
9
$58,889
0
$0
FILES CLOSED FOR INCOMPLETENESS
0
$0
12
$73,957
17
$65,788
3
$36,000
0
$0
1
$23,260
0
$0
Aggregated Statistics For Year 2007 (Based on 6 full and 10 partial tracts)
A) FHA, FSA/RHS & VA Home Purchase Loans
B) Conventional Home Purchase Loans
C) Refinancings
D) Home Improvement Loans
E) Loans on Dwellings For 5+ Families
F) Non-occupant Loans on < 5 Family Dwellings (A B C & D)
G) Loans On Manufactured Home Dwelling (A B C & D)
Number
Average Value
Number
Average Value
Number
Average Value
Number
Average Value
Number
Average Value
Number
Average Value
Number
Average Value
LOANS ORIGINATED
13
$75,332
194
$64,927
159
$60,346
88
$37,650
4
$181,288
80
$52,040
0
$0
APPLICATIONS APPROVED, NOT ACCEPTED
3
$73,003
25
$72,374
46
$51,045
16
$25,488
0
$0
15
$56,317
1
$260,320
APPLICATIONS DENIED
4
$100,215
102
$67,574
289
$60,015
180
$34,053
2
$248,025
72
$50,784
2
$46,160
APPLICATIONS WITHDRAWN
0
$0
38
$83,095
118
$67,104
27
$35,038
0
$0
18
$58,111
0
$0
FILES CLOSED FOR INCOMPLETENESS
0
$0
26
$70,418
48
$66,772
5
$14,870
0
$0
5
$55,966
0
$0
Aggregated Statistics For Year 2006 (Based on 6 full and 10 partial tracts)
A) FHA, FSA/RHS & VA Home Purchase Loans
B) Conventional Home Purchase Loans
C) Refinancings
D) Home Improvement Loans
E) Loans on Dwellings For 5+ Families
F) Non-occupant Loans on < 5 Family Dwellings (A B C & D)
G) Loans On Manufactured Home Dwelling (A B C & D)
Number
Average Value
Number
Average Value
Number
Average Value
Number
Average Value
Number
Average Value
Number
Average Value
Number
Average Value
LOANS ORIGINATED
24
$73,627
282
$60,305
213
$61,791
70
$32,480
3
$242,720
75
$50,648
2
$48,000
APPLICATIONS APPROVED, NOT ACCEPTED
1
$48,380
81
$57,956
81
$60,839
13
$25,580
0
$0
12
$40,255
1
$83,000
APPLICATIONS DENIED
3
$56,190
212
$61,616
374
$59,572
221
$30,866
0
$0
105
$57,072
6
$26,602
APPLICATIONS WITHDRAWN
7
$82,264
80
$77,256
212
$64,480
16
$48,134
0
$0
27
$54,745
3
$128,693
FILES CLOSED FOR INCOMPLETENESS
0
$0
26
$76,554
42
$71,508
4
$43,495
0
$0
12
$66,098
0
$0
Aggregated Statistics For Year 2005 (Based on 6 full and 8 partial tracts)
A) FHA, FSA/RHS & VA Home Purchase Loans
B) Conventional Home Purchase Loans
C) Refinancings
D) Home Improvement Loans
E) Loans on Dwellings For 5+ Families
F) Non-occupant Loans on < 5 Family Dwellings (A B C & D)
G) Loans On Manufactured Home Dwelling (A B C & D)
Number
Average Value
Number
Average Value
Number
Average Value
Number
Average Value
Number
Average Value
Number
Average Value
Number
Average Value
LOANS ORIGINATED
26
$69,189
289
$57,498
294
$58,874
91
$45,968
2
$325,690
81
$58,428
0
$0
APPLICATIONS APPROVED, NOT ACCEPTED
1
$48,380
96
$54,420
71
$54,873
20
$41,114
0
$0
23
$46,965
3
$25,153
APPLICATIONS DENIED
6
$81,603
192
$58,232
507
$57,653
191
$27,242
3
$76,013
87
$49,131
15
$33,390
APPLICATIONS WITHDRAWN
4
$61,708
76
$108,543
206
$75,035
58
$117,744
0
$0
33
$93,162
2
$42,180
FILES CLOSED FOR INCOMPLETENESS
1
$62,810
17
$77,196
78
$68,058
5
$39,342
0
$0
3
$54,287
0
$0
Aggregated Statistics For Year 2004 (Based on 6 full and 10 partial tracts)
A) FHA, FSA/RHS & VA Home Purchase Loans
B) Conventional Home Purchase Loans
C) Refinancings
D) Home Improvement Loans
E) Loans on Dwellings For 5+ Families
F) Non-occupant Loans on < 5 Family Dwellings (A B C & D)
G) Loans On Manufactured Home Dwelling (A B C & D)
Number
Average Value
Number
Average Value
Number
Average Value
Number
Average Value
Number
Average Value
Number
Average Value
Number
Average Value
LOANS ORIGINATED
38
$70,707
276
$69,300
347
$53,883
80
$34,880
3
$1,899,203
78
$52,734
1
$22,000
APPLICATIONS APPROVED, NOT ACCEPTED
2
$76,115
102
$55,388
64
$53,886
14
$42,956
0
$0
19
$50,223
4
$36,085
APPLICATIONS DENIED
11
$62,268
164
$67,264
452
$53,448
180
$26,371
0
$0
61
$47,837
17
$38,893
APPLICATIONS WITHDRAWN
4
$58,838
43
$64,526
196
$53,840
17
$41,909
3
$57,667
14
$51,171
0
$0
FILES CLOSED FOR INCOMPLETENESS
1
$47,730
18
$85,832
59
$69,903
2
$49,385
0
$0
2
$51,250
0
$0
Aggregated Statistics For Year 2003 (Based on 6 full and 10 partial tracts)
A) FHA, FSA/RHS & VA Home Purchase Loans
B) Conventional Home Purchase Loans
C) Refinancings
D) Home Improvement Loans
E) Loans on Dwellings For 5+ Families
F) Non-occupant Loans on < 5 Family Dwellings (A B C & D)
Number
Average Value
Number
Average Value
Number
Average Value
Number
Average Value
Number
Average Value
Number
Average Value
LOANS ORIGINATED
50
$76,087
251
$67,769
354
$58,133
40
$14,415
2
$3,755,000
68
$58,233
APPLICATIONS APPROVED, NOT ACCEPTED
1
$43,150
56
$74,266
82
$58,831
20
$19,683
0
$0
20
$62,066
APPLICATIONS DENIED
5
$79,424
139
$57,728
401
$51,611
87
$17,342
0
$0
34
$38,812
APPLICATIONS WITHDRAWN
7
$79,440
43
$64,255
194
$53,008
6
$28,283
0
$0
17
$41,928
FILES CLOSED FOR INCOMPLETENESS
0
$0
22
$73,649
14
$73,786
0
$0
0
$0
7
$85,963
Aggregated Statistics For Year 1999 (Based on 3 full and 5 partial tracts)
A) FHA, FSA/RHS & VA Home Purchase Loans
B) Conventional Home Purchase Loans
C) Refinancings
D) Home Improvement Loans
E) Loans on Dwellings For 5+ Families
F) Non-occupant Loans on < 5 Family Dwellings (A B C & D)
2002 - 2018 National Fire Incident Reporting System (NFIRS) incidents
According to the data from the years 2002 - 2018 the average number of fire incidents per year is 54. The highest number of reported fires - 104 took place in 2011, and the least - 20 in 2009. The data has a rising trend.
When looking into fire subcategories, the most incidents belonged to: Outside Fires (33.6%), and Structure Fires (30.3%).
Fire incident types reported to NFIRS in Zip Code 77029
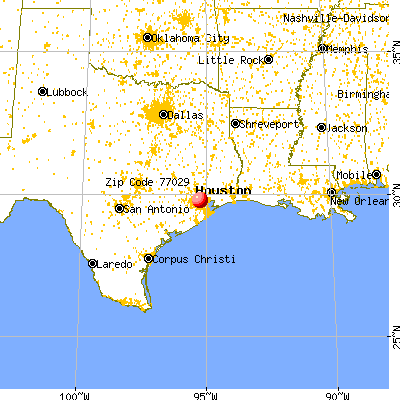


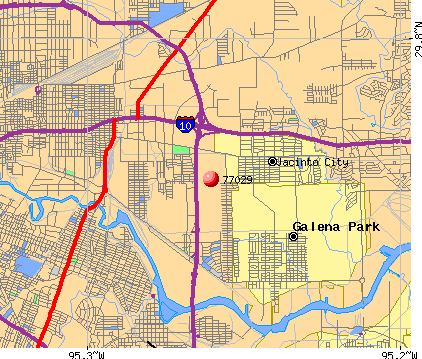 Nearest zip codes: 77547, 77013, 77012, 77011, 77020, 77017.


 According to the data from the years 2002 - 2018 the average number of fire incidents per year is 54. The highest number of reported fires - 104 took place in 2011, and the least - 20 in 2009. The data has a rising trend.
 When looking into fire subcategories, the most incidents belonged to: Outside Fires (33.6%), and Structure Fires (30.3%).