Estimated zip code population in 2022: 4,555 Zip code population in 2010: 4,869 Zip code population in 2000: 5,396
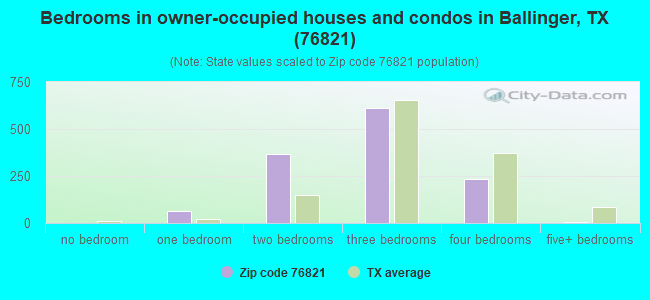
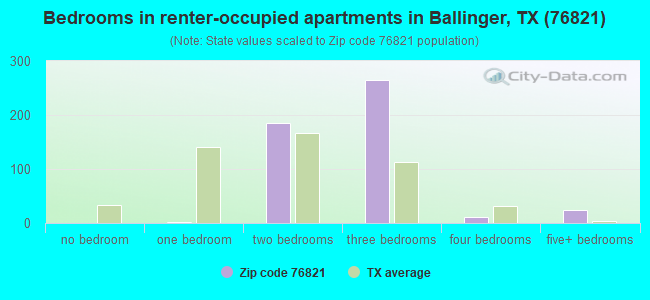
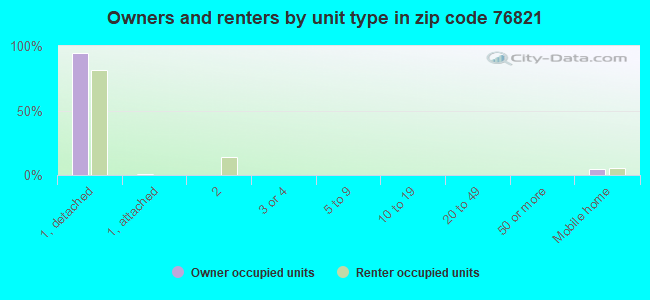
Houses and condos: 2,281 Renter-occupied apartments: 498
% of renters here:
28%
State:
38%
March 2022 cost of living index in zip code 76821: 76.6 (low, U.S. average is 100)
Land area: 305.0 sq. mi. Water area: 4.3 sq. mi.
Population density: 15 people per square mile
(very low).
OSM Map
General Map
Google Map
MSN Map
OSM Map
General Map
Google Map
MSN Map
OSM Map
General Map
Google Map
MSN Map
OSM Map
General Map
Google Map
MSN Map
Please wait while loading the map...
Real estate property taxes paid for housing units in 2022:
This zip code:
1.4% ($1,463)
Texas:
1.5% ($4,050)
Median real estate property taxes paid for housing units with mortgages in 2022: $2,264 (1.6%) Median real estate property taxes paid for housing units with no mortgage in 2022: $1,220 (1.5%)
Business Search- 14 Million verified businesses
Males: 2,478
(54.4%)
Females: 2,076
(45.6%)
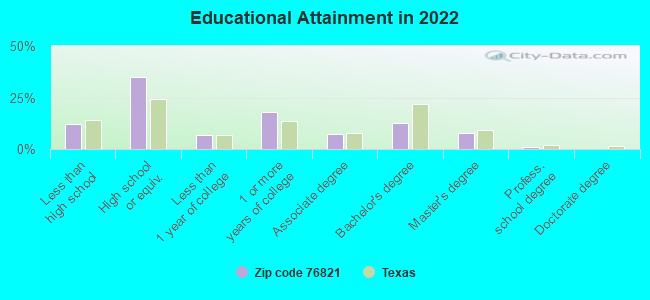
For population 25 years and over in 76821:
High school or higher: 87.2%
Bachelor's degree or higher: 21.1%
Graduate or professional degree: 8.5%
Unemployed: 3.7%
Mean travel time to work (commute): 19.6 minutes
For population 15 years and over in 76821:
Never married: 27.0%
Now married: 48.7%
Separated: 3.0%
Widowed: 9.5%
Divorced: 11.7%
Zip code 76821 compared to state average:
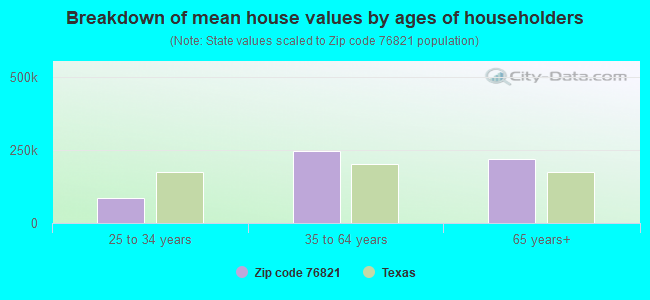
Median house value significantly below state average.
Black race population percentage below state average.
Median age above state average.
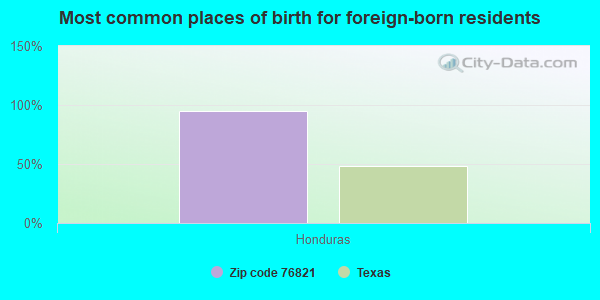
Foreign-born population percentage significantly below state average.
Length of stay since moving in significantly above state average.
House age significantly above state average.
Number of college students significantly below state average.
Averages for the 2020 tax year for zip code 76821, filed in 2021:
Average Adjusted Gross Income (AGI) in 2020: $53,972 (Individual Income Tax Returns)
Here:
$53,972
State:
$77,054
Salary/wage: $42,632 (reported on 81.7% of returns)
Here:
$42,632
State:
$62,766
(% of AGI for various income ranges: 1257.2% for AGIs below $25k, 3594.8% for AGIs $25k-50k, 6359.0% for AGIs $50k-75k, 9814.0% for AGIs $75k-100k, 15307.7% for AGIs $100k-200k)
Taxable interest for individuals: $1,696 (reported on 24.5% of returns)
This zip code:
$1,696
Texas:
$2,665
(% of AGI for various income ranges: 14.3% for AGIs below $25k, 15.7% for AGIs $25k-50k, 62.4% for AGIs $50k-75k, 43.0% for AGIs $75k-100k, 85.4% for AGIs $100k-200k)
Ordinary dividends: $4,654 (reported on 13.5% of returns)
Here:
$4,654
State:
$10,044
(% of AGI for various income ranges: 16.3% for AGIs below $25k, 30.0% for AGIs $25k-50k, 86.2% for AGIs $50k-75k, 209.0% for AGIs $75k-100k, 221.5% for AGIs $100k-200k)
Net capital gain/loss in AGI: +$15,900 (reported on 13.0% of returns)
Here:
+$15,900
State:
+$39,590
(% of AGI for various income ranges: 0.5% for AGIs below $25k, 15.2% for AGIs $25k-50k, 70.5% for AGIs $50k-75k, 306.0% for AGIs $75k-100k, 688.5% for AGIs $100k-200k)
Profit/loss from business: +$13,479 (reported on 18.8% of returns)
Here:
+$13,479
State:
+$10,888
(% of AGI for various income ranges: 123.2% for AGIs below $25k, 179.8% for AGIs $25k-50k, 478.6% for AGIs $50k-75k, 550.0% for AGIs $75k-100k, 1670.8% for AGIs $100k-200k)
Taxable individual retirement arrangement distribution: $19,400 (reported on 6.7% of returns)
76821:
$19,400
Texas:
$24,740
(% of AGI for various income ranges: 36.7% for AGIs below $25k, 70.0% for AGIs $25k-50k, 341.9% for AGIs $50k-75k, 1130.8% for AGIs $100k-200k)
Total itemized deductions: $36,100 (reported on 2.9% of returns)
Here:
$36,100
State:
$40,428
(% of AGI for various income ranges: 126.0% for AGIs below $25k, 1084.6% for AGIs $100k-200k)
Charity contributions: $15,600 (reported on 1.9% of returns)
Here:
$15,600
State:
$18,201
(% of AGI for various income ranges: 480.0% for AGIs $100k-200k)
Taxes paid: $5,620 (reported on 2.4% of returns)
76821:
$5,620
State:
$7,821
(% of AGI for various income ranges: 12.3% for AGIs below $25k, 159.2% for AGIs $100k-200k)
Earned income credit: $2,529 (reported on 23.1% of returns)
Here:
$2,529
State:
$2,584
(% of AGI for various income ranges: 129.2% for AGIs below $25k, 99.8% for AGIs $25k-50k)
Percentage of individuals using paid preparers for their 2020 taxes: 96.2%
Here:
96%
State:
92%
(% for various income ranges: 94.0% for AGIs below $25k, 98.2% for AGIs $25k-50k, 96.6% for AGIs $50k-75k, 100.0% for AGIs $75k-100k, 95.2% for AGIs $100k-200k, 100.0% for AGIs over 200k)
Averages for the 2012 tax year for zip code 76821, filed in 2013:
Average Adjusted Gross Income (AGI) in 2012: $47,192 (Individual Income Tax Returns)
Here:
$47,192
State:
$65,384
Salary/wage: $36,701 (reported on 83.2% of returns)
Here:
$36,701
State:
$52,524
(% of AGI for various income ranges: 81.2% for AGIs below $25k, 79.5% for AGIs $25k-50k, 71.7% for AGIs $50k-75k, 72.0% for AGIs $75k-100k, 68.2% for AGIs $100k-200k, 27.7% for AGIs over 200k)
Taxable interest for individuals: $1,027 (reported on 24.5% of returns)
This zip code:
$1,027
Texas:
$2,372
(% of AGI for various income ranges: 1.0% for AGIs below $25k, 1.0% for AGIs $25k-50k, 0.4% for AGIs $50k-75k, 0.4% for AGIs $75k-100k, 0.3% for AGIs $100k-200k, 0.4% for AGIs over 200k)
Ordinary dividends: $3,847 (reported on 14.4% of returns)
Here:
$3,847
State:
$9,721
(% of AGI for various income ranges: 1.3% for AGIs below $25k, 0.9% for AGIs $25k-50k, 1.2% for AGIs $50k-75k, 1.3% for AGIs $75k-100k, 2.6% for AGIs $100k-200k)
Net capital gain/loss in AGI: +$9,258 (reported on 12.5% of returns)
Here:
+$9,258
State:
+$35,319
(% of AGI for various income ranges: 0.1% for AGIs below $25k, 0.5% for AGIs $25k-50k, 0.8% for AGIs $50k-75k, 0.7% for AGIs $75k-100k, 12.0% for AGIs $100k-200k)
Profit/loss from business: +$13,344 (reported on 20.7% of returns)
Here:
+$13,344
State:
+$13,732
(% of AGI for various income ranges: 9.4% for AGIs below $25k, 5.3% for AGIs $25k-50k, 7.4% for AGIs $50k-75k, 5.5% for AGIs $75k-100k, 9.3% for AGIs $100k-200k)
Taxable individual retirement arrangement distribution: $10,195 (reported on 9.1% of returns)
76821:
$10,195
Texas:
$19,511
(% of AGI for various income ranges: 1.0% for AGIs below $25k, 2.4% for AGIs $25k-50k, 2.4% for AGIs $50k-75k, 2.3% for AGIs $75k-100k, 3.8% for AGIs $100k-200k)
Total itemized deductions: $20,754 (19% of AGI, reported on 11.5% of returns)
Here:
$20,754
State:
$24,724
Here:
18.5% of AGI
State:
15.9% of AGI
(% of AGI for various income ranges: 4.2% for AGIs below $25k, 4.7% for AGIs $25k-50k, 4.9% for AGIs $50k-75k, 5.9% for AGIs $75k-100k, 7.6% for AGIs $100k-200k, 3.5% for AGIs over 200k)
Charity contributions: $6,584 (reported on 9.1% of returns)
Here:
$6,584
State:
$6,808
(% of AGI for various income ranges: 1.0% for AGIs $25k-50k, 0.7% for AGIs $50k-75k, 1.0% for AGIs $75k-100k, 2.5% for AGIs $100k-200k, 1.9% for AGIs over 200k)
Taxes paid: $4,025 (reported on 11.5% of returns)
76821:
$4,025
State:
$6,921
(% of AGI for various income ranges: 0.3% for AGIs below $25k, 0.7% for AGIs $25k-50k, 0.8% for AGIs $50k-75k, 1.1% for AGIs $75k-100k, 1.6% for AGIs $100k-200k, 1.2% for AGIs over 200k)
Earned income credit: $2,428 (reported on 27.4% of returns)
Here:
$2,428
State:
$2,570
(% of AGI for various income ranges: 8.7% for AGIs below $25k, 1.8% for AGIs $25k-50k)
Percentage of individuals using paid preparers for their 2012 taxes: 68.8%
Here:
69%
State:
51%
(% for various income ranges: 63.9% for AGIs below $25k, 68.0% for AGIs $25k-50k, 71.0% for AGIs $50k-75k, 78.6% for AGIs $75k-100k, 84.6% for AGIs $100k-200k, 100.0% for AGIs over 200k)
Averages for the 2004 tax year for zip code 76821, filed in 2005:
Average Adjusted Gross Income (AGI) in 2004: $28,798 (Individual Income Tax Returns)
Here:
$28,798
State:
$47,881
Salary/wage: $26,910 (reported on 82.8% of returns)
Here:
$26,910
State:
$41,947
(% of AGI for various income ranges: 142.8% for AGIs below $10k, 81.2% for AGIs $10k-25k, 78.8% for AGIs $25k-50k, 79.1% for AGIs $50k-75k, 68.6% for AGIs $75k-100k, 61.6% for AGIs over 100k)
Taxable interest for individuals: $1,851 (reported on 31.7% of returns)
This zip code:
$1,851
Texas:
$2,255
(% of AGI for various income ranges: 6.5% for AGIs below $10k, 2.5% for AGIs $10k-25k, 1.8% for AGIs $25k-50k, 1.3% for AGIs $50k-75k, 1.0% for AGIs $75k-100k, 2.9% for AGIs over 100k)
Taxable dividends: $1,966 (reported on 16.7% of returns)
Here:
$1,966
State:
$4,261
(% of AGI for various income ranges: 3.7% for AGIs below $10k, 0.9% for AGIs $10k-25k, 0.7% for AGIs $25k-50k, 0.7% for AGIs $50k-75k, 2.6% for AGIs $75k-100k, 1.3% for AGIs over 100k)
Net capital gain/loss: +$3,772 (reported on 16.0% of returns)
Here:
+$3,772
State:
+$16,110
(% of AGI for various income ranges: -0.7% for AGIs below $10k, 0.5% for AGIs $10k-25k, 1.1% for AGIs $25k-50k, 1.4% for AGIs $50k-75k, 2.1% for AGIs $75k-100k, 8.0% for AGIs over 100k)
Profit/loss from business: +$8,186 (reported on 18.6% of returns)
Here:
+$8,186
State:
+$11,013
(% of AGI for various income ranges: 6.1% for AGIs below $10k, 4.9% for AGIs $10k-25k, 5.0% for AGIs $25k-50k, 3.5% for AGIs $50k-75k, 0.8% for AGIs $75k-100k, 12.7% for AGIs over 100k)
IRA payment deduction: $3,318 (reported on 3.1% of returns)
76821:
$3,318
Texas:
$3,120
Total itemized deductions: $15,913 (23% of AGI, reported on 9.7% of returns)
Here:
$15,913
State:
$19,631
Here:
23.4% of AGI
State:
18.9% of AGI
(% of AGI for various income ranges: 4.7% for AGIs $10k-25k, 4.2% for AGIs $25k-50k, 4.7% for AGIs $50k-75k, 6.3% for AGIs $75k-100k, 9.9% for AGIs over 100k)
Charity contributions deductions: $4,012 (6% of AGI, reported on 7.5% of returns)
Here:
$4,012
State:
$4,753
Here:
5.6% of AGI
State:
4.2% of AGI
(% of AGI for various income ranges: 0.4% for AGIs $10k-25k, 0.6% for AGIs $25k-50k, 0.7% for AGIs $50k-75k, 1.3% for AGIs $75k-100k, 3.2% for AGIs over 100k)
Total tax: $3,814 (reported on 64.1% of returns)
76821:
$3,814
State:
$9,058
(% of AGI for various income ranges: 3.8% for AGIs below $10k, 3.4% for AGIs $10k-25k, 6.1% for AGIs $25k-50k, 9.0% for AGIs $50k-75k, 11.1% for AGIs $75k-100k, 17.9% for AGIs over 100k)
Earned income credit: $1,846 (reported on 27.6% of returns)
Here:
$1,846
State:
$2,024
Percentage of individuals using paid preparers for their 2004 taxes: 74.2%
Here:
74%
State:
57%
(% for various income ranges: 71.9% for AGIs below $10k, 72.4% for AGIs $10k-25k, 77.0% for AGIs $25k-50k, 74.5% for AGIs $50k-75k, 75.3% for AGIs $75k-100k, 87.1% for AGIs over 100k)
Likely homosexual households (counted as self-reported same-sex unmarried-partner households)
Lesbian couples: 1.4% of all households
Gay men: 0.0% of all households
Household received Food Stamps/SNAP in the past 12 months: 260 Household did not receive Food Stamps/SNAP in the past 12 months: 1,539
Women who had a birth in the past 12 months: 35 (35 now married, 0 unmarried) Women who did not have a birth in the past 12 months: 782 (378 now married, 402 unmarried)
Housing units in zip code 76821 with a mortgage: 454 Median monthly owner costs for units with a mortgage: $1,140 Median monthly owner costs for units without a mortgage: $478
Residents with income below the poverty level in 2022:
This zip code:
9.8%
Whole state:
14.0%
Residents with income below 50% of the poverty level in 2022:
This zip code:
9.1%
Whole state:
7.4%
Median number of rooms in houses and condos:
Here:
5.8
State:
6.3
Median number of rooms in apartments:
Here:
4.8
State:
4.0
Notable locations in this zip code not listed on our city pages
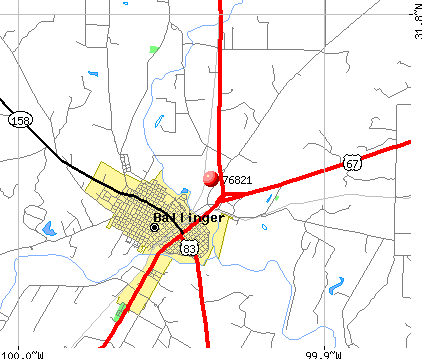
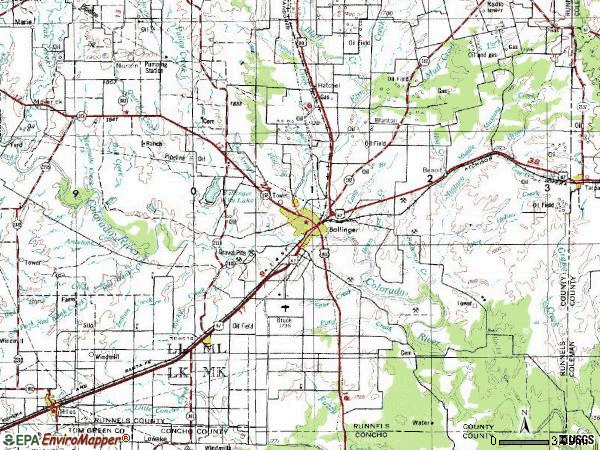
Notable locations in zip code 76821: Allen Number One Windmill (A), Herring Ranch (B), Kristoff School (C), Edwin and Hattie Day House (D), Ballinger Fire Department (E), Ballinger Carnegie Library (F), Van Pelt House (G). Display/hide their locations on the map
Churches in zip code 76821 include: Valley View Church (A), First Baptist Church (B), Brady Coleman Runnels Baptist Area Church (C), Church of the Nazarene (D), First Church of God (E), Church of Christ (F). Display/hide their locations on the map
Lakes and reservoirs: Country Club Lake (A), Ballinger City Lake (B), Kuhn Lake (C), Lee Lake (D), Country Club Lake (E), Elm Creek Lake (F), Currie Lake (G), Lloyd Lake (H). Display/hide their locations on the map
Streams, rivers, and creeks: Valley Creek (A), Turkey Creek (B), Bears Foot Creek (C), Rocky Creek (D), Red Bank Creek (E), Rattlesnake Creek (F), Quarry Creek (G), Mesquite Creek (H), Eagle Branch (I). Display/hide their locations on the map
In group quarters: 173 (-1 institutionalized population)
Size of family households: 602 2-persons, 191 3-persons, 204 4-persons, 91 5-persons, 14 6-persons, 49 7-or-more-persons
Size of nonfamily households: 489 1-person, 127 2-persons, 35 3-persons
602 married couples with children.
305 single-parent households (165 men, 140 women).
84.9% of residents of 76821 zip code speak English at home.
14.9% of residents speak Spanish at home (87% very well, 5% well, 3% not well, 5% not at all).
0.6% of residents speak other Indo-European language at home (100% very well).
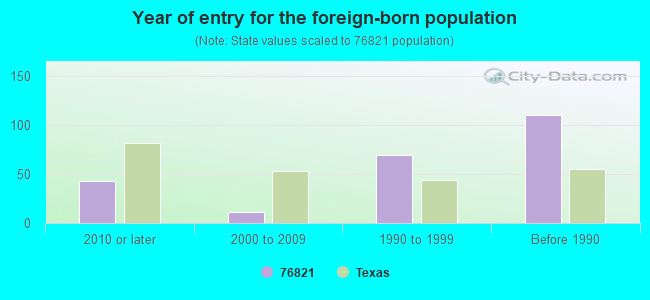
Foreign born population: 189 (4.1%) (40.2% of them are naturalized citizens)
This zip code:
4.1%
Whole state:
17.2%
95%Honduras
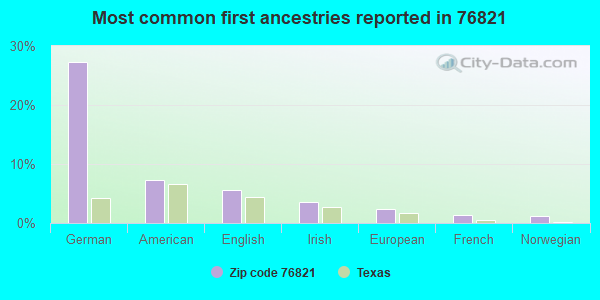
27%German
7%American
6%English
4%Irish
2%European
1%French
1%Norwegian
Year of entry for the foreign-born population
432010 or later
112000 to 2009
691990 to 1999
110Before 1990
Facilities with environmental interests located in this zip code:
BALLINGER ISD (302 8TH ST in BALLINGER, TX)
(Integrated Compliance Information System) - ICIS-06-1986-0115, FORMAL ENFORCEMENT ACTION COMPLIANCE ACTIVITY (Tracking inspections of insecticide, fungicide, and rodenticide, and toxic substances) Business SIC classification: ELEMENTARY AND SECONDARY SCHOOLS
BALLINGER ELEMENTARY (802 CONDA AVE in BALLINGER, TX)
(National Center for Education Statistics) - STATE ID-200901101 Organizations: BALLINGER ISD (SCHOOL DISTRICT)
BALLINGER H S (802 CONDA AVE in BALLINGER, TX)
(National Center for Education Statistics) - STATE ID-200901001 Organizations: BALLINGER ISD (SCHOOL DISTRICT)
BALLINGER J H (802 CONDA AVE in BALLINGER, TX)
(National Center for Education Statistics) - STATE ID-200901041 Organizations: BALLINGER ISD (SCHOOL DISTRICT)
AERO-AG SERVICE INC (BRUCE FIELD in BALLINGER, TX)
(Resource Conservation and Recovery Act (tracking hazardous waste))
BALLINGER WWTP (1440 HWY 158 WEST in BALLINGER, TX)
National Pollutant Discharge Elimination System NON-MAJOR (Tracking pollutant discharge elimination systems) - permit Business SIC classification: READY-MIXED CONCRETE Organizations: INGRAM ENTERPRISES, LP (CONTACT/OWNER)
Alternative names: INGRAM ENTERPRISES, LP
AFCO NO 10112 (1001 HUTCHINGS in BALLINGER, TX)
Conditionally Exempt Small Quantity Generators, less than 100 kg/month of hazardous waste (Resource Conservation and Recovery Act (tracking hazardous waste)) - notification Organizations: MICOR ENERGY LLC DBA AFCO (CONTACT/OWNER)
Housing units lacking complete plumbing facilities: 3.2% Housing units lacking complete kitchen facilities: 11.2%
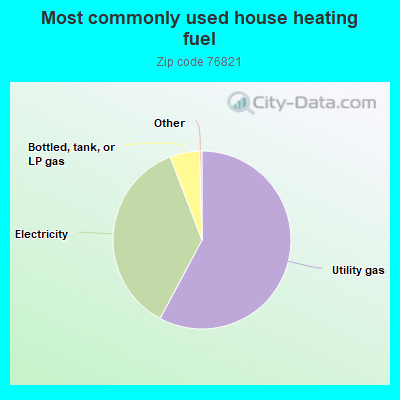
57.8%Utility gas
36.4%Electricity
5.4%Bottled, tank, or LP gas
Population in 1990: 4,957. Population change in the 1990s: +439 (+8.9%).
Place of birth for U.S.-born residents:
This state: 3,596
Northeast: 80
Midwest: 109
South: 177
West: 322
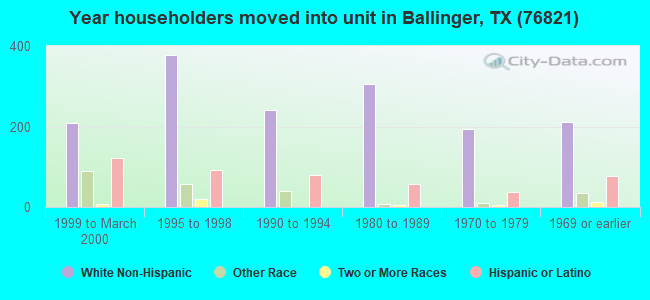
56% of the 76821 zip code residents lived in the same house 5 years ago. Out of people who lived in different houses, 47% lived in this county. Out of people who lived in different counties, 50% lived in Texas.
89% of the 76821 zip code residents lived in the same house 1 year ago. Out of people who lived in different houses, 62% moved from this county. Out of people who lived in different houses, 29% moved from different county within same state. Out of people who lived in different houses, 7% moved from different state.
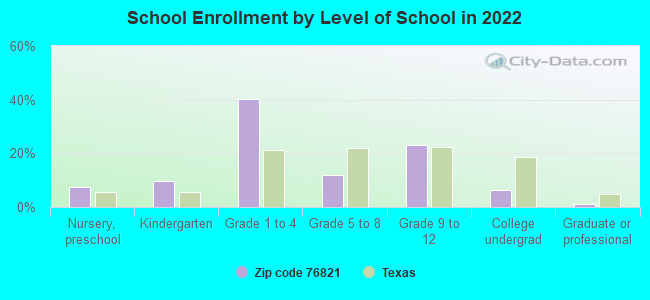
Private vs. public school enrollment:
Students in private schools in grades 1 to 8 (elementary and middle school): 5
Here:
1.3%
Texas:
8.8%
Students in private schools in grades 9 to 12 (high school): 21
Here:
10.8%
Texas:
8.0%
Students in private undergraduate colleges: 36
Here:
64.5%
Texas:
16.2%
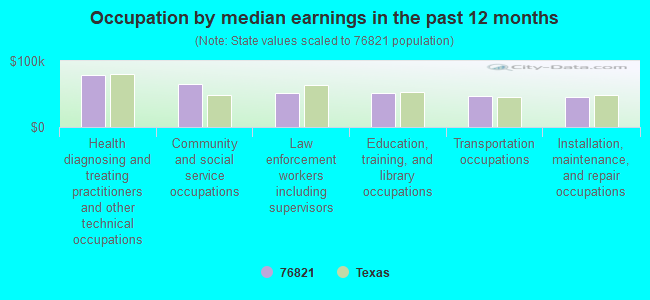
Occupation by median earnings in the past 12 months ($)
79,089Health diagnosing and treating practitioners and other technical occupations
64,826Community and social service occupations
51,593Law enforcement workers including supervisors
51,537Education, training, and library occupations
46,875Transportation occupations
45,426Installation, maintenance, and repair occupations
Top industries in this zip code by the number of employees in 2005:
Health Care and Social Assistance: Nursing Care Facilities (50-99 employees: 2 establishments)
Health Care and Social Assistance: General Medical and Surgical Hospitals (50-99: 1)
Other Services (except Public Administration): Religious Organizations (20-49: 1, 10-19: 2, 1-4: 4)
People in group quarters in 2010:
111 people in nursing facilities/skilled-nursing facilities
48 people in local jails and other municipal confinement facilities
2 people in workers' group living quarters and job corps centers
People in group quarters in 2000:
176 people in nursing homes
57 people in local jails and other confinement facilities (including police lockups)
9 people in other group homes
2 people in other noninstitutional group quarters
Fatal accident statistics in 2014:
Fatal accident count: 3
Vehicles involved in fatal accidents: 3
Fatal accidents caused by drunken drivers: 0
Fatalities: 4
Persons involved in fatal accidents: 15
Pedestrians involved in fatal accidents: 0
Fatal accident statistics in 2012:
Fatal accident count: 2
Vehicles involved in fatal accidents: 3
Fatal accidents caused by drunken drivers: 1
Fatalities: 4
Persons involved in fatal accidents: 6
Pedestrians involved in fatal accidents: 0
2002 - 2018 National Fire Incident Reporting System (NFIRS) incidents
Based on the data from the years 2002 - 2018 the average number of fire incidents per year is 45. The highest number of fires - 70 took place in 2011, and the least - 21 in 2013. The data has a declining trend.
When looking into fire subcategories, the most reports belonged to: Outside Fires (67.4%), and Structure Fires (17.2%).
Fire incident types reported to NFIRS in Zip Code 76821

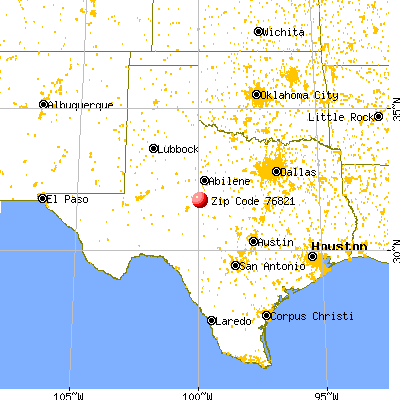


 Nearest zip codes: 76875, 79567, 76882, 76865, 76866, 76861.
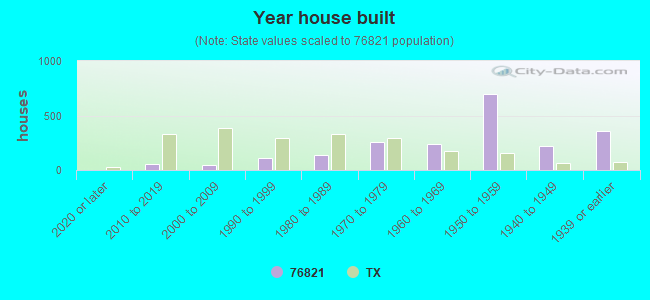


 Based on the data from the years 2002 - 2018 the average number of fire incidents per year is 45. The highest number of fires - 70 took place in 2011, and the least - 21 in 2013. The data has a declining trend.
 When looking into fire subcategories, the most reports belonged to: Outside Fires (67.4%), and Structure Fires (17.2%).