Estimated zip code population in 2022: 766 Zip code population in 2010: 1,063 Zip code population in 2000: 1,214
Houses and condos: 571 Renter-occupied apartments: 118
% of renters here:
30%
State:
38%
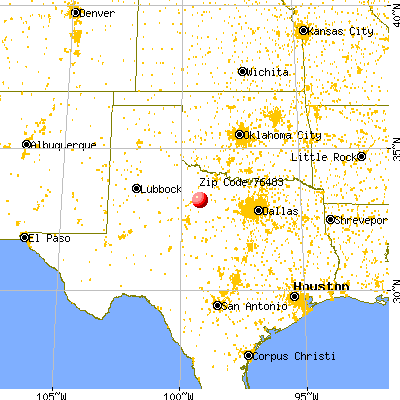
March 2022 cost of living index in zip code 76483: 75.8 (low, U.S. average is 100)
Land area: 635.8 sq. mi. Water area: 2.1 sq. mi.
Population density: 1 people per square mile
(very low).
OSM Map
General Map
Google Map
MSN Map
OSM Map
General Map
Google Map
MSN Map
OSM Map
General Map
Google Map
MSN Map
OSM Map
General Map
Google Map
MSN Map
Please wait while loading the map...
Real estate property taxes paid for housing units in 2022:
This zip code:
1.4% ($906)
Texas:
1.5% ($4,050)
Median real estate property taxes paid for housing units with mortgages in 2022: $1,885 (1.9%) Median real estate property taxes paid for housing units with no mortgage in 2022: $778 (1.3%)
Business Search- 14 Million verified businesses
Males: 422
(55.1%)
Females: 343
(44.9%)
For population 25 years and over in 76483:
High school or higher: 88.2%
Bachelor's degree or higher: 21.4%
Graduate or professional degree: 5.2%
Unemployed: 3.6%
Mean travel time to work (commute): 19.6 minutes
For population 15 years and over in 76483:
Never married: 28.7%
Now married: 51.8%
Separated: 2.7%
Widowed: 6.9%
Divorced: 9.8%
Zip code 76483 compared to state average:
Median house value significantly below state average.
Black race population percentage significantly below state average.
Hispanic race population percentage below state average.
Median age significantly above state average.
Foreign-born population percentage significantly below state average.
Length of stay since moving in significantly above state average.
Averages for the 2020 tax year for zip code 76483, filed in 2021:
Average Adjusted Gross Income (AGI) in 2020: $64,041 (Individual Income Tax Returns)
Here:
$64,041
State:
$77,054
Salary/wage: $44,103 (reported on 77.3% of returns)
Here:
$44,103
State:
$62,766
(% of AGI for various income ranges: 1324.0% for AGIs below $25k, 3691.4% for AGIs $25k-50k, 5868.3% for AGIs $50k-75k, 6760.0% for AGIs $75k-100k)
Taxable interest for individuals: $2,423 (reported on 29.5% of returns)
This zip code:
$2,423
Texas:
$2,665
(% of AGI for various income ranges: 3.0% for AGIs below $25k, 15.7% for AGIs $25k-50k, 61.7% for AGIs $50k-75k)
Ordinary dividends: $4,383 (reported on 13.6% of returns)
Here:
$4,383
State:
$10,044
(% of AGI for various income ranges: 126.7% for AGIs $50k-75k)
Net capital gain/loss in AGI: +$25,262 (reported on 18.2% of returns)
Here:
+$25,262
State:
+$39,590
(% of AGI for various income ranges: 615.0% for AGIs $50k-75k)
Profit/loss from business: +$9,138 (reported on 29.5% of returns)
Here:
+$9,138
State:
+$10,888
(% of AGI for various income ranges: 118.0% for AGIs below $25k, 367.1% for AGIs $25k-50k, 453.3% for AGIs $50k-75k)
Taxable individual retirement arrangement distribution: $7,167 (reported on 6.8% of returns)
76483:
$7,167
Texas:
$24,740
(% of AGI for various income ranges: 307.1% for AGIs $25k-50k)
Earned income credit: $2,588 (reported on 18.2% of returns)
Here:
$2,588
State:
$2,584
(% of AGI for various income ranges: 123.0% for AGIs below $25k, 120.0% for AGIs $25k-50k)
Percentage of individuals using paid preparers for their 2020 taxes: 88.6%
Here:
89%
State:
92%
(% for various income ranges: 92.9% for AGIs below $25k, 90.0% for AGIs $25k-50k, 88.9% for AGIs $50k-75k, 80.0% for AGIs $75k-100k, 83.3% for AGIs $100k-200k)
Averages for the 2012 tax year for zip code 76483, filed in 2013:
Average Adjusted Gross Income (AGI) in 2012: $68,491 (Individual Income Tax Returns)
Here:
$68,491
State:
$65,384
Salary/wage: $37,308 (reported on 80.4% of returns)
Here:
$37,308
State:
$52,524
(% of AGI for various income ranges: 79.7% for AGIs below $25k, 74.8% for AGIs $25k-50k, 72.9% for AGIs $50k-75k, 72.3% for AGIs $75k-100k, 75.4% for AGIs $100k-200k)
Taxable interest for individuals: $1,031 (reported on 34.8% of returns)
This zip code:
$1,031
Texas:
$2,372
(% of AGI for various income ranges: 0.5% for AGIs below $25k, 0.8% for AGIs $25k-50k, 0.4% for AGIs $50k-75k, 0.8% for AGIs $100k-200k, 0.6% for AGIs over 200k)
Ordinary dividends: $2,162 (reported on 17.4% of returns)
Here:
$2,162
State:
$9,721
(% of AGI for various income ranges: 1.4% for AGIs $25k-50k, 1.2% for AGIs $75k-100k, 0.6% for AGIs over 200k)
Net capital gain/loss in AGI: +$10,150 (reported on 13.0% of returns)
Here:
+$10,150
State:
+$35,319
Profit/loss from business: +$21,708 (reported on 28.3% of returns)
Here:
+$21,708
State:
+$13,732
(% of AGI for various income ranges: 8.8% for AGIs below $25k, 6.3% for AGIs $25k-50k, 8.6% for AGIs $50k-75k, 43.2% for AGIs $100k-200k)
Taxable individual retirement arrangement distribution: $6,900 (reported on 6.5% of returns)
76483:
$6,900
Texas:
$19,511
Total itemized deductions: $21,871 (13% of AGI, reported on 15.2% of returns)
Here:
$21,871
State:
$24,724
Here:
13.2% of AGI
State:
15.9% of AGI
Charity contributions: $7,850 (reported on 13.0% of returns)
Here:
$7,850
State:
$6,808
Taxes paid: $3,586 (reported on 15.2% of returns)
76483:
$3,586
State:
$6,921
Earned income credit: $2,125 (reported on 17.4% of returns)
Here:
$2,125
State:
$2,570
(% of AGI for various income ranges: 6.2% for AGIs below $25k, 1.2% for AGIs $25k-50k)
Percentage of individuals using paid preparers for their 2012 taxes: 60.9%
Here:
61%
State:
51%
(% for various income ranges: 50.0% for AGIs below $25k, 50.0% for AGIs $25k-50k, 62.5% for AGIs $50k-75k, 75.0% for AGIs $75k-100k, 100.0% for AGIs $100k-200k, 100.0% for AGIs over 200k)
Averages for the 2004 tax year for zip code 76483, filed in 2005:
Average Adjusted Gross Income (AGI) in 2004: $42,786 (Individual Income Tax Returns)
Here:
$42,786
State:
$47,881
Salary/wage: $26,081 (reported on 76.9% of returns)
Here:
$26,081
State:
$41,947
(% of AGI for various income ranges: 103.5% for AGIs below $10k, 77.4% for AGIs $10k-25k, 81.5% for AGIs $25k-50k, 67.1% for AGIs $50k-75k, 50.9% for AGIs $75k-100k, 6.1% for AGIs over 100k)
Taxable interest for individuals: $3,093 (reported on 39.1% of returns)
This zip code:
$3,093
Texas:
$2,255
(% of AGI for various income ranges: 9.4% for AGIs below $10k, 2.5% for AGIs $10k-25k, 1.8% for AGIs $25k-50k, 3.0% for AGIs $50k-75k, 4.7% for AGIs $75k-100k, 2.8% for AGIs over 100k)
Taxable dividends: $1,603 (reported on 15.6% of returns)
Here:
$1,603
State:
$4,261
(% of AGI for various income ranges: 9.4% for AGIs below $10k, 0.1% for AGIs $25k-50k, 1.8% for AGIs $50k-75k, 0.1% for AGIs over 100k)
Net capital gain/loss: +$9,821 (reported on 16.7% of returns)
Here:
+$9,821
State:
+$16,110
(% of AGI for various income ranges: 0.3% for AGIs below $10k, 1.7% for AGIs $25k-50k, 2.6% for AGIs $50k-75k, 7.5% for AGIs over 100k)
Profit/loss from business: +$20,610 (reported on 25.2% of returns)
Here:
+$20,610
State:
+$11,013
(% of AGI for various income ranges: 24.8% for AGIs below $10k, 12.6% for AGIs $10k-25k, 4.9% for AGIs $25k-50k, 1.8% for AGIs $50k-75k, 22.8% for AGIs over 100k)
Total itemized deductions: $17,386 (25% of AGI, reported on 12.2% of returns)
Here:
$17,386
State:
$19,631
Here:
24.8% of AGI
State:
18.9% of AGI
(% of AGI for various income ranges: 8.4% for AGIs $10k-25k, 4.1% for AGIs $25k-50k, 11.0% for AGIs $50k-75k, 14.2% for AGIs $75k-100k)
Charity contributions deductions: $5,596 (7% of AGI, reported on 10.0% of returns)
Here:
$5,596
State:
$4,753
Here:
7.2% of AGI
State:
4.2% of AGI
(% of AGI for various income ranges: 4.6% for AGIs below $10k, 0.8% for AGIs $25k-50k, 2.7% for AGIs $50k-75k, 7.3% for AGIs $75k-100k)
Total tax: $8,798 (reported on 69.9% of returns)
76483:
$8,798
State:
$9,058
(% of AGI for various income ranges: 6.5% for AGIs below $10k, 4.2% for AGIs $10k-25k, 5.9% for AGIs $25k-50k, 8.0% for AGIs $50k-75k, 10.1% for AGIs $75k-100k, 26.1% for AGIs over 100k)
Earned income credit: $1,742 (reported on 19.0% of returns)
Here:
$1,742
State:
$2,024
Percentage of individuals using paid preparers for their 2004 taxes: 62.2%
Here:
62%
State:
57%
(% for various income ranges: 61.0% for AGIs below $10k, 58.7% for AGIs $10k-25k, 62.0% for AGIs $25k-50k, 59.4% for AGIs $50k-75k, 70.6% for AGIs $75k-100k, 90.9% for AGIs over 100k)
Household received Food Stamps/SNAP in the past 12 months: 32 Household did not receive Food Stamps/SNAP in the past 12 months: 363
Women who had a birth in the past 12 months: 6 (6 now married, 0 unmarried) Women who did not have a birth in the past 12 months: 129 (69 now married, 59 unmarried)
Housing units in zip code 76483 with a mortgage: 43 Median monthly owner costs for units with a mortgage: $933 Median monthly owner costs for units without a mortgage: $424
Residents with income below the poverty level in 2022:
This zip code:
9.6%
Whole state:
14.0%
Residents with income below 50% of the poverty level in 2022:
This zip code:
3.8%
Whole state:
7.4%
Median number of rooms in houses and condos:
Here:
5.4
State:
6.3
Median number of rooms in apartments:
Here:
4.4
State:
4.0
Notable locations in this zip code not listed on our city pages
Notable locations in zip code 76483: Buzzard Peak Corral (A), Camp Cooper Ruins (B), Sloan Ranch (C), Tecumseh Ruins (D), Throckmorton County Museum (E), Throckmorton Volunteer Fire Department (F). Display/hide their locations on the map
Reservoirs: Wolf Creek Tank (A), Antelope Lake (B), Big Wolf Tank (C), Ada Tank (D), Ranger Canyon Tank (E), Patterson Lake Number 1 (F), Patterson Lake Number 2 (G), Wildcat Tank (H). Display/hide their locations on the map
Streams, rivers, and creeks: Bow Creek (A), Walnut Creek (B), Stagestand Branch (C), Sibley Creek (D), Plum Branch (E), Paint Creek (F), Wolf Creek (G), Tecumseh Creek (H), Jackson Branch (I). Display/hide their locations on the map
Size of family households: 122 2-persons, 31 3-persons, 31 4-persons, 5 5-persons
Size of nonfamily households: 178 1-person, 32 2-persons
67 married couples with children.
13 single-parent households (13 women).
93.2% of residents of 76483 zip code speak English at home.
5.0% of residents speak Spanish at home (62% very well, 38% well).
1.1% of residents speak other Indo-European language at home (100% very well).
0.7% of residents speak Asian or Pacific Island language at home (60% very well, 40% well).
Foreign born population: 27 (3.5%) (48.8% of them are naturalized citizens)
This zip code:
3.5%
Whole state:
17.2%
42%Honduras
35%Croatia
23%Malaysia
27%Irish
9%English
4%German
3%Norwegian
3%Slovak
2%American
2%European
Year of entry for the foreign-born population
172010 or later
02000 to 2009
01990 to 1999
11Before 1990
Housing units lacking complete plumbing facilities: 19.6% Housing units lacking complete kitchen facilities: 3.5%
49.0%Utility gas
47.4%Electricity
4.0%Bottled, tank, or LP gas
Population in 1990: 1,321.
Place of birth for U.S.-born residents:
This state: 626
Northeast: 9
Midwest: 27
South: 26
West: 45
64% of the 76483 zip code residents lived in the same house 5 years ago. Out of people who lived in different houses, 40% lived in this county. Out of people who lived in different counties, 50% lived in Texas.
89% of the 76483 zip code residents lived in the same house 1 year ago. Out of people who lived in different houses, 10% moved from this county. Out of people who lived in different houses, 79% moved from different county within same state. Out of people who lived in different houses, 12% moved from different state.
Private vs. public school enrollment:
Students in private schools in grades 1 to 8 (elementary and middle school):
Here:
0.0%
Texas:
8.8%
Students in private schools in grades 9 to 12 (high school): 7
Here:
21.6%
Texas:
8.0%
Students in private undergraduate colleges:
Here:
0.0%
Texas:
16.2%
Occupation by median earnings in the past 12 months ($)
69,905Construction and extraction occupations
62,870Farming, fishing, and forestry occupations
41,081Office and administrative support occupations
33,425Management occupations
27,971Sales and related occupations
27,573Installation, maintenance, and repair occupations
Top industries in this zip code by the number of employees in 2005:
Mining: Crude Petroleum and Natural Gas Extraction (10-19 employees: 2 establishments, 1-4 employees: 2 establishments)
Health Care and Social Assistance: Nursing Care Facilities (20-49: 1)
Health Care and Social Assistance: General Medical and Surgical Hospitals (20-49: 1)
Mining: Support Activities for Oil and Gas Operations (10-19: 1, 1-4: 3)
Accommodation and Food Services: Full-Service Restaurants (5-9: 3)
Finance and Insurance: Commercial Banking (5-9: 2)
Wholesale Trade: Industrial Machinery and Equipment Merchant Wholesalers (5-9: 1)
People in group quarters in 2010:
13 people in group homes intended for adults
People in group quarters in 2000:
22 people in nursing homes
Fatal accident statistics in 2012:
Fatal accident count: 1
Vehicles involved in fatal accidents: 1
Fatal accidents caused by drunken drivers: 0
Fatalities: 1
Persons involved in fatal accidents: 2
Pedestrians involved in fatal accidents: 0
Most common first names in zip code 76483 among deceased individuals
Name
Count
Lived (average)
James
3
73.4 years
Billy
3
65.4 years
Edna
3
89.0 years
Margaret
3
74.7 years
Wanda
3
55.7 years
William
3
73.3 years
Joe
2
67.0 years
Mabel
2
90.0 years
Jane
2
78.5 years
Emma
2
85.0 years
Most common last names in zip code 76483 among deceased individuals
Last name
Count
Lived (average)
Davis
5
84.6 years
Alexander
3
77.4 years
Martin
3
79.6 years
Ellerd
2
76.5 years
Brown
2
82.5 years
Bachman
2
76.5 years
Hooper
2
65.5 years
Condron
2
70.5 years
Everett
2
81.5 years
Cantrell
2
81.0 years
Discuss Throckmorton, Texas (TX) on our hugely popular Texas forum.


 Nearest zip codes: 76491, 76372, 79521, 76363, 76388, 76430.


