Estimated zip code population in 2022: 5,324 Zip code population in 2010: 4,745 Zip code population in 2000: 3,984
Houses and condos: 2,153 Renter-occupied apartments: 222
% of renters here:
11%
State:
38%
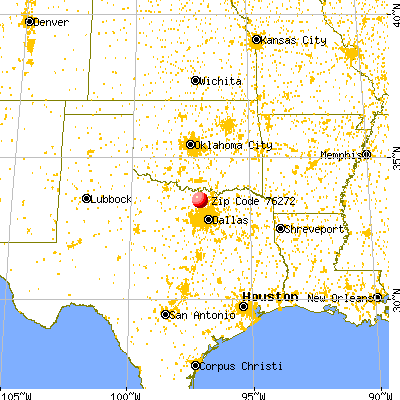
March 2022 cost of living index in zip code 76272: 79.6 (low, U.S. average is 100)
Land area: 98.9 sq. mi. Water area: 19.3 sq. mi.
Population density: 54 people per square mile
(very low).
OSM Map
General Map
Google Map
MSN Map
OSM Map
General Map
Google Map
MSN Map
OSM Map
General Map
Google Map
MSN Map
OSM Map
General Map
Google Map
MSN Map
Please wait while loading the map...
Real estate property taxes paid for housing units in 2022:
This zip code:
1.0% ($3,472)
Texas:
1.5% ($4,050)
Median real estate property taxes paid for housing units with mortgages in 2022: $4,201 (1.3%) Median real estate property taxes paid for housing units with no mortgage in 2022: $3,291 (1.0%)
Averages for the 2020 tax year for zip code 76272, filed in 2021:
Average Adjusted Gross Income (AGI) in 2020: $74,597 (Individual Income Tax Returns)
Here:
$74,597
State:
$77,054
Salary/wage: $66,141 (reported on 80.4% of returns)
Here:
$66,141
State:
$62,766
(% of AGI for various income ranges: 1197.5% for AGIs below $25k, 3787.4% for AGIs $25k-50k, 6377.6% for AGIs $50k-75k, 9298.9% for AGIs $75k-100k, 15842.1% for AGIs $100k-200k, 56913.3% for AGIs over 200k)
Taxable interest for individuals: $1,512 (reported on 27.5% of returns)
This zip code:
$1,512
Texas:
$2,665
(% of AGI for various income ranges: 14.7% for AGIs below $25k, 28.1% for AGIs $25k-50k, 37.9% for AGIs $50k-75k, 43.7% for AGIs $75k-100k, 114.8% for AGIs $100k-200k, 603.3% for AGIs over 200k)
Ordinary dividends: $6,266 (reported on 14.3% of returns)
Here:
$6,266
State:
$10,044
(% of AGI for various income ranges: 13.5% for AGIs below $25k, 52.8% for AGIs $25k-50k, 81.7% for AGIs $50k-75k, 135.8% for AGIs $75k-100k, 266.6% for AGIs $100k-200k, 1313.3% for AGIs over 200k)
Net capital gain/loss in AGI: +$32,546 (reported on 14.0% of returns)
Here:
+$32,546
State:
+$39,590
(% of AGI for various income ranges: 8.8% for AGIs below $25k, 33.6% for AGIs $25k-50k, 103.4% for AGIs $50k-75k, 256.8% for AGIs $75k-100k, 435.9% for AGIs $100k-200k, 16303.3% for AGIs over 200k)
Profit/loss from business: +$12,772 (reported on 21.9% of returns)
Here:
+$12,772
State:
+$10,888
(% of AGI for various income ranges: 243.5% for AGIs below $25k, 196.4% for AGIs $25k-50k, 179.7% for AGIs $50k-75k, 364.2% for AGIs $75k-100k, 419.3% for AGIs $100k-200k, 4446.7% for AGIs over 200k)
Taxable individual retirement arrangement distribution: $21,090 (reported on 7.9% of returns)
76272:
$21,090
Texas:
$24,740
(% of AGI for various income ranges: 49.8% for AGIs below $25k, 112.1% for AGIs $25k-50k, 172.4% for AGIs $50k-75k, 319.5% for AGIs $75k-100k, 576.9% for AGIs $100k-200k, 1396.7% for AGIs over 200k)
Total itemized deductions: $36,626 (reported on 8.7% of returns)
Here:
$36,626
State:
$40,428
(% of AGI for various income ranges: 141.3% for AGIs $25k-50k, 308.6% for AGIs $50k-75k, 419.5% for AGIs $75k-100k, 905.2% for AGIs $100k-200k, 5738.3% for AGIs over 200k)
Charity contributions: $9,967 (reported on 6.8% of returns)
Here:
$9,967
State:
$18,201
(% of AGI for various income ranges: 9.8% for AGIs below $25k, 76.6% for AGIs $50k-75k, 231.0% for AGIs $100k-200k, 1410.0% for AGIs over 200k)
Taxes paid: $7,935 (reported on 7.5% of returns)
76272:
$7,935
State:
$7,821
(% of AGI for various income ranges: 19.8% for AGIs below $25k, 42.8% for AGIs $50k-75k, 86.3% for AGIs $75k-100k, 207.6% for AGIs $100k-200k, 973.3% for AGIs over 200k)
Earned income credit: $2,495 (reported on 14.0% of returns)
Here:
$2,495
State:
$2,584
(% of AGI for various income ranges: 101.2% for AGIs below $25k, 73.6% for AGIs $25k-50k)
Percentage of individuals using paid preparers for their 2020 taxes: 92.8%
Here:
93%
State:
92%
(% for various income ranges: 91.5% for AGIs below $25k, 93.2% for AGIs $25k-50k, 92.3% for AGIs $50k-75k, 92.6% for AGIs $75k-100k, 95.3% for AGIs $100k-200k, 93.3% for AGIs over 200k)
Averages for the 2012 tax year for zip code 76272, filed in 2013:
Average Adjusted Gross Income (AGI) in 2012: $57,130 (Individual Income Tax Returns)
Here:
$57,130
State:
$65,384
Salary/wage: $51,619 (reported on 83.2% of returns)
Here:
$51,619
State:
$52,524
(% of AGI for various income ranges: 77.5% for AGIs below $25k, 80.5% for AGIs $25k-50k, 85.6% for AGIs $50k-75k, 84.3% for AGIs $75k-100k, 76.6% for AGIs $100k-200k, 48.6% for AGIs over 200k)
Taxable interest for individuals: $1,048 (reported on 30.2% of returns)
This zip code:
$1,048
Texas:
$2,372
(% of AGI for various income ranges: 1.2% for AGIs below $25k, 0.6% for AGIs $25k-50k, 0.4% for AGIs $50k-75k, 0.6% for AGIs $75k-100k, 0.3% for AGIs $100k-200k, 0.6% for AGIs over 200k)
Ordinary dividends: $3,147 (reported on 14.9% of returns)
Here:
$3,147
State:
$9,721
(% of AGI for various income ranges: 0.4% for AGIs below $25k, 0.9% for AGIs $25k-50k, 0.5% for AGIs $50k-75k, 1.0% for AGIs $75k-100k, 0.7% for AGIs $100k-200k, 1.3% for AGIs over 200k)
Net capital gain/loss in AGI: +$6,037 (reported on 13.4% of returns)
Here:
+$6,037
State:
+$35,319
(% of AGI for various income ranges: 0.3% for AGIs $25k-50k, 0.5% for AGIs $50k-75k, 1.6% for AGIs $75k-100k, 1.8% for AGIs $100k-200k, 3.1% for AGIs over 200k)
Profit/loss from business: +$11,371 (reported on 20.8% of returns)
Here:
+$11,371
State:
+$13,732
(% of AGI for various income ranges: 9.9% for AGIs below $25k, 3.8% for AGIs $25k-50k, 2.9% for AGIs $50k-75k, 4.4% for AGIs $100k-200k, 6.6% for AGIs over 200k)
Taxable individual retirement arrangement distribution: $16,837 (reported on 9.4% of returns)
76272:
$16,837
Texas:
$19,511
(% of AGI for various income ranges: 4.4% for AGIs below $25k, 3.4% for AGIs $25k-50k, 1.8% for AGIs $50k-75k, 2.3% for AGIs $75k-100k, 4.7% for AGIs $100k-200k)
Total itemized deductions: $23,343 (21% of AGI, reported on 26.7% of returns)
Here:
$23,343
State:
$24,724
Here:
21.4% of AGI
State:
15.9% of AGI
(% of AGI for various income ranges: 11.0% for AGIs below $25k, 6.8% for AGIs $25k-50k, 11.6% for AGIs $50k-75k, 10.5% for AGIs $75k-100k, 13.1% for AGIs $100k-200k, 10.9% for AGIs over 200k)
Charity contributions: $4,943 (reported on 20.8% of returns)
Here:
$4,943
State:
$6,808
(% of AGI for various income ranges: 0.8% for AGIs below $25k, 0.8% for AGIs $25k-50k, 1.5% for AGIs $50k-75k, 1.5% for AGIs $75k-100k, 2.5% for AGIs $100k-200k, 2.7% for AGIs over 200k)
Taxes paid: $5,757 (reported on 26.2% of returns)
76272:
$5,757
State:
$6,921
(% of AGI for various income ranges: 1.9% for AGIs below $25k, 1.2% for AGIs $25k-50k, 2.8% for AGIs $50k-75k, 2.6% for AGIs $75k-100k, 3.5% for AGIs $100k-200k, 2.8% for AGIs over 200k)
Earned income credit: $2,314 (reported on 17.8% of returns)
Here:
$2,314
State:
$2,570
(% of AGI for various income ranges: 6.8% for AGIs below $25k, 1.3% for AGIs $25k-50k)
Percentage of individuals using paid preparers for their 2012 taxes: 59.9%
Here:
60%
State:
51%
(% for various income ranges: 56.9% for AGIs below $25k, 61.7% for AGIs $25k-50k, 59.4% for AGIs $50k-75k, 63.6% for AGIs $75k-100k, 60.9% for AGIs $100k-200k, 66.7% for AGIs over 200k)
Averages for the 2004 tax year for zip code 76272, filed in 2005:
Average Adjusted Gross Income (AGI) in 2004: $48,399 (Individual Income Tax Returns)
Here:
$48,399
State:
$47,881
Salary/wage: $44,442 (reported on 86.3% of returns)
Here:
$44,442
State:
$41,947
(% of AGI for various income ranges: 107.2% for AGIs below $10k, 82.0% for AGIs $10k-25k, 87.1% for AGIs $25k-50k, 88.3% for AGIs $50k-75k, 88.2% for AGIs $75k-100k, 64.7% for AGIs over 100k)
Taxable interest for individuals: $1,748 (reported on 34.3% of returns)
This zip code:
$1,748
Texas:
$2,255
(% of AGI for various income ranges: 6.9% for AGIs below $10k, 2.1% for AGIs $10k-25k, 1.6% for AGIs $25k-50k, 0.6% for AGIs $50k-75k, 0.7% for AGIs $75k-100k, 1.2% for AGIs over 100k)
Taxable dividends: $1,469 (reported on 16.0% of returns)
Here:
$1,469
State:
$4,261
(% of AGI for various income ranges: 1.2% for AGIs below $10k, 0.5% for AGIs $10k-25k, 0.5% for AGIs $25k-50k, 0.2% for AGIs $50k-75k, 0.4% for AGIs $75k-100k, 0.6% for AGIs over 100k)
Net capital gain/loss: +$14,416 (reported on 14.7% of returns)
Here:
+$14,416
State:
+$16,110
(% of AGI for various income ranges: 1.1% for AGIs below $10k, 0.1% for AGIs $10k-25k, 0.7% for AGIs $25k-50k, 2.0% for AGIs $50k-75k, 2.1% for AGIs $75k-100k, 9.7% for AGIs over 100k)
Profit/loss from business: +$6,333 (reported on 20.5% of returns)
Here:
+$6,333
State:
+$11,013
(% of AGI for various income ranges: 8.2% for AGIs below $10k, 7.3% for AGIs $10k-25k, 2.8% for AGIs $25k-50k, 1.9% for AGIs $50k-75k, 0.2% for AGIs $75k-100k, 2.7% for AGIs over 100k)
IRA payment deduction: $3,303 (reported on 1.8% of returns)
76272:
$3,303
Texas:
$3,120
Total itemized deductions: $19,267 (21% of AGI, reported on 26.8% of returns)
Here:
$19,267
State:
$19,631
Here:
21.3% of AGI
State:
18.9% of AGI
(% of AGI for various income ranges: 8.3% for AGIs below $10k, 8.3% for AGIs $10k-25k, 9.2% for AGIs $25k-50k, 11.7% for AGIs $50k-75k, 13.7% for AGIs $75k-100k, 10.4% for AGIs over 100k)
Charity contributions deductions: $4,819 (5% of AGI, reported on 22.0% of returns)
Here:
$4,819
State:
$4,753
Here:
5.0% of AGI
State:
4.2% of AGI
(% of AGI for various income ranges: 1.3% for AGIs $10k-25k, 1.2% for AGIs $25k-50k, 1.7% for AGIs $50k-75k, 2.3% for AGIs $75k-100k, 3.2% for AGIs over 100k)
Total tax: $8,058 (reported on 75.1% of returns)
76272:
$8,058
State:
$9,058
(% of AGI for various income ranges: 4.0% for AGIs below $10k, 4.3% for AGIs $10k-25k, 6.0% for AGIs $25k-50k, 8.4% for AGIs $50k-75k, 10.1% for AGIs $75k-100k, 21.4% for AGIs over 100k)
Earned income credit: $1,862 (reported on 16.6% of returns)
Here:
$1,862
State:
$2,024
Percentage of individuals using paid preparers for their 2004 taxes: 61.6%
Here:
62%
State:
57%
(% for various income ranges: 49.7% for AGIs below $10k, 64.8% for AGIs $10k-25k, 65.6% for AGIs $25k-50k, 61.6% for AGIs $50k-75k, 57.0% for AGIs $75k-100k, 72.7% for AGIs over 100k)
Household received Food Stamps/SNAP in the past 12 months: 105 Household did not receive Food Stamps/SNAP in the past 12 months: 1,867
Women who did not have a birth in the past 12 months: 796 (428 now married, 365 unmarried)
Housing units in zip code 76272 with a mortgage: 866 (68 second mortgage, 9 home equity loan, 62 both second mortgage and home equity loan) Median monthly owner costs for units with a mortgage: $1,775 Median monthly owner costs for units without a mortgage: $808
Residents with income below the poverty level in 2022:
This zip code:
6.3%
Whole state:
14.0%
Residents with income below 50% of the poverty level in 2022:
This zip code:
5.0%
Whole state:
7.4%
Median number of rooms in houses and condos:
Here:
6.2
State:
6.3
Median number of rooms in apartments:
Here:
4.9
State:
4.0
Notable locations in this zip code not listed on our city pages
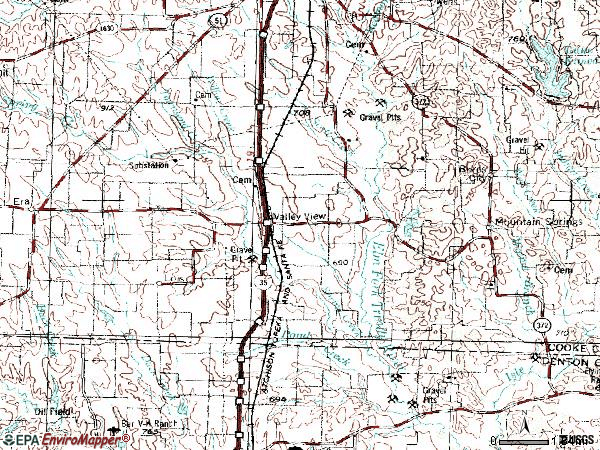
Churches in zip code 76272 include: Prairie Grove Baptist Church (A), First Baptist Church (B), Cornerstone Baptist Church (C), Prairie Grove Church (D), Mount Pleasant Church (E), New Hope Church (F). Display/hide their locations on the map
Cemeteries: Oak Hill Cemetery (1), Walling Cemetery (2), Mount Olive Cemetery (3), Tyson Cemetery (4), Valley View Cemetery (5), New Hope Cemetery (6). Display/hide their locations on the map
Reservoirs: Tipps Lake (A), Soil Conservation Service Site 61t Reservoir (B), Soil Conservation Service Site 61u Reservoir (C), Soil Conservation Service Site Number 18 Reservoir (D), Soil Conservation Service Site 61v Reservoir (E), Soil Conservation Service Site 61w Reservoir (F), Soil Conservation Service Site 61x Reservoir (G). Display/hide their locations on the map
Streams, rivers, and creeks: Walnut Branch (A), Willow Creek (B), Spring Creek (C), Indian Creek (D), Townsend Creek (E), Sand Branch (F), Pond Creek (G), Persimmon Creek (H), Pecan Creek (I). Display/hide their locations on the map
Size of family households: 916 2-persons, 394 3-persons, 209 4-persons, 109 5-persons, 33 6-persons, 42 7-or-more-persons
Size of nonfamily households: 223 1-person, 47 2-persons
606 married couples with children.
311 single-parent households (66 men, 245 women).
85.7% of residents of 76272 zip code speak English at home.
13.3% of residents speak Spanish at home (60% very well, 26% well, 13% not well, 1% not at all).
0.8% of residents speak other Indo-European language at home (100% very well).
Foreign born population: 315 (5.9%) (31.1% of them are naturalized citizens)
This zip code:
5.9%
Whole state:
17.2%
76%Honduras
8%North Macedonia (Macedonia)
5%Bolivia
2%Japan
2%Costa Rica
1%Sweden
17%English
12%German
9%American
6%Italian
4%Scottish
2%Irish
2%Scotch-Irish
Year of entry for the foreign-born population
1502010 or later
882000 to 2009
991990 to 1999
56Before 1990
Facilities with environmental interests located in this zip code:
ALAN RITCHEY DAIRY (2.7 MILES WEST OF YUBA, OK in BRYAN COUNTY, OK)
ENFORCEMENT/COMPLIANCE ACTIVITY (Integrated Compliance Information System) - ICIS-06-2004-2166, FORMAL ENFORCEMENT ACTION, ICIS-06-2003-1987, ICIS-06-2004-1949, ICIS-06-2004-2337, ICIS-06-2004-2338, ICIS-06-2004-2343, (Integrated Compliance Information System) - ICIS-06-2004-2166, FORMAL ENFORCEMENT ACTION, ICIS-06-2003-1987, ICIS-06-2004-1949, ICIS-06-2004-2337, ICIS-06-2004-2338, ICIS-06-2004-2343, Business SIC classification: DAIRY FARMS
ALAN RITCHEY INCORPORATED (I-35 EAST FRONTAGE ROAD, P.O. BOX 249 in VALLEY VIEW, TX)
National Pollutant Discharge Elimination System NON-MAJOR (Tracking pollutant discharge elimination systems) - permit - ICIS-06-2004-1903, FORMAL ENFORCEMENT ACTION, ICIS-06-2004-1904, ICIS-06-2004-1935, ICIS-06-2004-2027, ICIS-06-2004-2124, ICIS-06-2004-2125, ICIS-06-2004-2333, (Resource Conservation and Recovery Act (tracking hazardous waste)) Business SIC classification: DAIRY FARMS Business NAICS classification: GENERAL AUTOMOTIVE REPAIR. Alternative names: ALAN RITCHEY DAIRY
Housing units lacking complete plumbing facilities: 0.6% Housing units lacking complete kitchen facilities: 0.5%
62.3%Electricity
26.9%Bottled, tank, or LP gas
10.1%Utility gas
0.9%Wood
Population in 1990: 2,754. Population change in the 1990s: +1,230 (+44.7%).
Place of birth for U.S.-born residents:
This state: 3,780
Northeast: 273
Midwest: 220
South: 343
West: 296
54% of the 76272 zip code residents lived in the same house 5 years ago. Out of people who lived in different houses, 28% lived in this county. Out of people who lived in different counties, 50% lived in Texas.
97% of the 76272 zip code residents lived in the same house 1 year ago. Out of people who lived in different houses, 38% moved from this county. Out of people who lived in different houses, 68% moved from different county within same state. Out of people who lived in different houses, 2% moved from abroad.
Private vs. public school enrollment:
Students in private schools in grades 1 to 8 (elementary and middle school): 37
Here:
7.3%
Texas:
8.8%
Students in private schools in grades 9 to 12 (high school): 47
Here:
23.9%
Texas:
8.0%
Students in private undergraduate colleges: 2
Here:
1.4%
Texas:
16.2%
Occupation by median earnings in the past 12 months ($)
139,912Architecture and engineering occupations
89,382Health diagnosing and treating practitioners and other technical occupations
85,249Computer and mathematical occupations
80,899Fire fighting and prevention, and other protective service workers including supervisors
79,197Business and financial operations occupations
77,662Management occupations
Top industries in this zip code by the number of employees in 2005:
Accommodation and Food Services: Limited-Service Restaurants (10-19 employees: 1 establishment)
Mining: Construction Sand and Gravel Mining (5-9: 1)
Professional, Scientific, and Technical Services: Surveying and Mapping (except Geophysical) Services (5-9: 1)
Fatal accident statistics in 2014:
Fatal accident count: 1
Vehicles involved in fatal accidents: 1
Fatal accidents caused by drunken drivers: 1
Fatalities: 1
Persons involved in fatal accidents: 1
Pedestrians involved in fatal accidents: 0
Fatal accident statistics in 2012:
Fatal accident count: 2
Vehicles involved in fatal accidents: 3
Fatal accidents caused by drunken drivers: 0
Fatalities: 2
Persons involved in fatal accidents: 5
Pedestrians involved in fatal accidents: 0
2002 - 2018 National Fire Incident Reporting System (NFIRS) incidents
According to the data from the years 2002 - 2018 the average number of fires per year is 69. The highest number of reported fire incidents - 152 took place in 2005, and the least - 9 in 2002. The data has an increasing trend.
When looking into fire subcategories, the most reports belonged to: Outside Fires (66.2%), and Structure Fires (19.8%).
Fire incident types reported to NFIRS in Zip Code 76272


 Nearest zip codes: 76266, 76250, 76240, 76258, 76238, 76209.


 According to the data from the years 2002 - 2018 the average number of fires per year is 69. The highest number of reported fire incidents - 152 took place in 2005, and the least - 9 in 2002. The data has an increasing trend.
 When looking into fire subcategories, the most reports belonged to: Outside Fires (66.2%), and Structure Fires (19.8%).