Estimated zip code population in 2022: 7,421 Zip code population in 2010: 5,832 Zip code population in 2000: 5,334
Houses and condos: 2,726 Renter-occupied apartments: 338
% of renters here:
13%
State:
38%
March 2022 cost of living index in zip code 76023: 80.5 (low, U.S. average is 100)
Land area: 56.2 sq. mi. Water area: 0.0 sq. mi.
Population density: 132 people per square mile
(very low).
OSM Map
General Map
Google Map
MSN Map
OSM Map
General Map
Google Map
MSN Map
OSM Map
General Map
Google Map
MSN Map
OSM Map
General Map
Google Map
MSN Map
Please wait while loading the map...
Real estate property taxes paid for housing units in 2022:
This zip code:
1.1% ($3,461)
Texas:
1.5% ($4,050)
Median real estate property taxes paid for housing units with mortgages in 2022: $4,199 (1.1%) Median real estate property taxes paid for housing units with no mortgage in 2022: $2,605 (1.3%)
Business Search- 14 Million verified businesses
Males: 3,779
(50.9%)
Females: 3,641
(49.1%)
For population 25 years and over in 76023:
High school or higher: 87.5%
Bachelor's degree or higher: 19.8%
Graduate or professional degree: 3.1%
Unemployed: 1.4%
Mean travel time to work (commute): 39.8 minutes
For population 15 years and over in 76023:
Never married: 21.6%
Now married: 65.2%
Separated: 0.9%
Widowed: 5.4%
Divorced: 6.9%
Zip code 76023 compared to state average:
Unemployed percentage significantly below state average.
Black race population percentage significantly below state average.
Hispanic race population percentage significantly below state average.
Median age above state average.
Foreign-born population percentage significantly below state average.
Renting percentage significantly below state average.
Length of stay since moving in significantly above state average.
Number of college students below state average.
Percentage of population with a bachelor's degree or higher below state average.
Averages for the 2020 tax year for zip code 76023, filed in 2021:
Average Adjusted Gross Income (AGI) in 2020: $66,821 (Individual Income Tax Returns)
Here:
$66,821
State:
$77,054
Salary/wage: $59,297 (reported on 81.0% of returns)
Here:
$59,297
State:
$62,766
(% of AGI for various income ranges: 1120.9% for AGIs below $25k, 3505.6% for AGIs $25k-50k, 6571.1% for AGIs $50k-75k, 9517.0% for AGIs $75k-100k, 17315.9% for AGIs $100k-200k, 48052.0% for AGIs over 200k)
Taxable interest for individuals: $1,456 (reported on 20.5% of returns)
This zip code:
$1,456
Texas:
$2,665
(% of AGI for various income ranges: 14.1% for AGIs below $25k, 23.3% for AGIs $25k-50k, 26.1% for AGIs $50k-75k, 19.6% for AGIs $75k-100k, 113.1% for AGIs $100k-200k, 458.0% for AGIs over 200k)
Ordinary dividends: $4,670 (reported on 10.0% of returns)
Here:
$4,670
State:
$10,044
(% of AGI for various income ranges: 8.2% for AGIs below $25k, 13.0% for AGIs $25k-50k, 27.2% for AGIs $50k-75k, 53.0% for AGIs $75k-100k, 145.6% for AGIs $100k-200k, 1382.0% for AGIs over 200k)
Net capital gain/loss in AGI: +$19,791 (reported on 10.6% of returns)
Here:
+$19,791
State:
+$39,590
(% of AGI for various income ranges: 21.0% for AGIs below $25k, 22.0% for AGIs $25k-50k, 45.6% for AGIs $50k-75k, 68.5% for AGIs $75k-100k, 359.1% for AGIs $100k-200k, 10262.0% for AGIs over 200k)
Profit/loss from business: +$11,609 (reported on 21.1% of returns)
Here:
+$11,609
State:
+$10,888
(% of AGI for various income ranges: 118.3% for AGIs below $25k, 183.4% for AGIs $25k-50k, 243.9% for AGIs $50k-75k, 255.6% for AGIs $75k-100k, 627.2% for AGIs $100k-200k, 5018.0% for AGIs over 200k)
Taxable individual retirement arrangement distribution: $21,500 (reported on 6.9% of returns)
76023:
$21,500
Texas:
$24,740
(% of AGI for various income ranges: 39.0% for AGIs below $25k, 93.0% for AGIs $25k-50k, 118.3% for AGIs $50k-75k, 210.7% for AGIs $75k-100k, 962.2% for AGIs $100k-200k)
Total itemized deductions: $34,471 (reported on 6.3% of returns)
Here:
$34,471
State:
$40,428
(% of AGI for various income ranges: 85.8% for AGIs below $25k, 143.3% for AGIs $50k-75k, 362.6% for AGIs $75k-100k, 804.1% for AGIs $100k-200k, 5004.0% for AGIs over 200k)
Charity contributions: $10,629 (reported on 5.1% of returns)
Here:
$10,629
State:
$18,201
(% of AGI for various income ranges: 23.0% for AGIs $25k-50k, 103.0% for AGIs $75k-100k, 177.8% for AGIs $100k-200k, 1640.0% for AGIs over 200k)
Taxes paid: $6,414 (reported on 6.3% of returns)
76023:
$6,414
State:
$7,821
(% of AGI for various income ranges: 17.2% for AGIs below $25k, 24.4% for AGIs $50k-75k, 84.4% for AGIs $75k-100k, 160.6% for AGIs $100k-200k, 766.0% for AGIs over 200k)
Earned income credit: $2,261 (reported on 16.3% of returns)
Here:
$2,261
State:
$2,584
(% of AGI for various income ranges: 99.5% for AGIs below $25k, 73.0% for AGIs $25k-50k)
Percentage of individuals using paid preparers for their 2020 taxes: 93.1%
Here:
93%
State:
92%
(% for various income ranges: 92.3% for AGIs below $25k, 93.4% for AGIs $25k-50k, 91.8% for AGIs $50k-75k, 97.2% for AGIs $75k-100k, 92.5% for AGIs $100k-200k, 92.3% for AGIs over 200k)
Averages for the 2012 tax year for zip code 76023, filed in 2013:
Average Adjusted Gross Income (AGI) in 2012: $50,533 (Individual Income Tax Returns)
Here:
$50,533
State:
$65,384
Salary/wage: $44,406 (reported on 82.5% of returns)
Here:
$44,406
State:
$52,524
(% of AGI for various income ranges: 73.3% for AGIs below $25k, 79.5% for AGIs $25k-50k, 80.6% for AGIs $50k-75k, 76.8% for AGIs $75k-100k, 78.5% for AGIs $100k-200k, 28.5% for AGIs over 200k)
Taxable interest for individuals: $1,231 (reported on 24.7% of returns)
This zip code:
$1,231
Texas:
$2,372
(% of AGI for various income ranges: 0.7% for AGIs below $25k, 1.0% for AGIs $25k-50k, 0.5% for AGIs $50k-75k, 0.6% for AGIs $75k-100k, 0.3% for AGIs $100k-200k, 0.8% for AGIs over 200k)
Ordinary dividends: $1,716 (reported on 9.5% of returns)
Here:
$1,716
State:
$9,721
(% of AGI for various income ranges: 0.4% for AGIs below $25k, 0.3% for AGIs $25k-50k, 0.6% for AGIs $50k-75k, 0.2% for AGIs $75k-100k, 0.2% for AGIs $100k-200k)
Net capital gain/loss in AGI: +$4,919 (reported on 8.0% of returns)
Here:
+$4,919
State:
+$35,319
(% of AGI for various income ranges: 0.2% for AGIs $25k-50k, 0.2% for AGIs $50k-75k, 1.0% for AGIs $75k-100k, 2.1% for AGIs $100k-200k)
Profit/loss from business: +$13,802 (reported on 20.5% of returns)
Here:
+$13,802
State:
+$13,732
(% of AGI for various income ranges: 11.5% for AGIs below $25k, 5.6% for AGIs $25k-50k, 5.4% for AGIs $50k-75k, 5.3% for AGIs $75k-100k, 6.4% for AGIs $100k-200k)
Taxable individual retirement arrangement distribution: $10,614 (reported on 8.4% of returns)
76023:
$10,614
Texas:
$19,511
(% of AGI for various income ranges: 2.6% for AGIs below $25k, 1.8% for AGIs $25k-50k, 1.4% for AGIs $50k-75k, 2.5% for AGIs $75k-100k, 2.1% for AGIs $100k-200k)
Total itemized deductions: $20,518 (24% of AGI, reported on 20.9% of returns)
Here:
$20,518
State:
$24,724
Here:
24.1% of AGI
State:
15.9% of AGI
(% of AGI for various income ranges: 7.9% for AGIs below $25k, 8.4% for AGIs $25k-50k, 8.5% for AGIs $50k-75k, 8.1% for AGIs $75k-100k, 9.8% for AGIs $100k-200k, 6.8% for AGIs over 200k)
Charity contributions: $4,595 (reported on 14.4% of returns)
Here:
$4,595
State:
$6,808
(% of AGI for various income ranges: 0.9% for AGIs below $25k, 0.8% for AGIs $25k-50k, 1.3% for AGIs $50k-75k, 1.5% for AGIs $75k-100k, 2.3% for AGIs $100k-200k)
Taxes paid: $4,208 (reported on 19.8% of returns)
76023:
$4,208
State:
$6,921
(% of AGI for various income ranges: 1.3% for AGIs below $25k, 1.3% for AGIs $25k-50k, 1.6% for AGIs $50k-75k, 1.8% for AGIs $75k-100k, 2.3% for AGIs $100k-200k, 1.1% for AGIs over 200k)
Earned income credit: $2,263 (reported on 19.4% of returns)
Here:
$2,263
State:
$2,570
(% of AGI for various income ranges: 6.9% for AGIs below $25k, 1.2% for AGIs $25k-50k)
Percentage of individuals using paid preparers for their 2012 taxes: 58.2%
Here:
58%
State:
51%
(% for various income ranges: 53.9% for AGIs below $25k, 55.4% for AGIs $25k-50k, 60.5% for AGIs $50k-75k, 66.7% for AGIs $75k-100k, 65.4% for AGIs $100k-200k, 100.0% for AGIs over 200k)
Averages for the 2004 tax year for zip code 76023, filed in 2005:
Average Adjusted Gross Income (AGI) in 2004: $38,688 (Individual Income Tax Returns)
Here:
$38,688
State:
$47,881
Salary/wage: $38,060 (reported on 83.7% of returns)
Here:
$38,060
State:
$41,947
(% of AGI for various income ranges: 159.2% for AGIs below $10k, 77.4% for AGIs $10k-25k, 85.7% for AGIs $25k-50k, 87.5% for AGIs $50k-75k, 83.5% for AGIs $75k-100k, 70.6% for AGIs over 100k)
Taxable interest for individuals: $1,463 (reported on 31.9% of returns)
This zip code:
$1,463
Texas:
$2,255
(% of AGI for various income ranges: 6.2% for AGIs below $10k, 1.6% for AGIs $10k-25k, 1.1% for AGIs $25k-50k, 0.7% for AGIs $50k-75k, 0.6% for AGIs $75k-100k, 1.8% for AGIs over 100k)
Taxable dividends: $1,104 (reported on 13.2% of returns)
Here:
$1,104
State:
$4,261
(% of AGI for various income ranges: 4.2% for AGIs below $10k, 0.3% for AGIs $10k-25k, 0.1% for AGIs $25k-50k, 0.2% for AGIs $50k-75k, 0.0% for AGIs $75k-100k, 0.9% for AGIs over 100k)
Net capital gain/loss: +$5,420 (reported on 11.7% of returns)
Here:
+$5,420
State:
+$16,110
(% of AGI for various income ranges: -0.8% for AGIs below $10k, 0.3% for AGIs $10k-25k, 0.2% for AGIs $25k-50k, 0.6% for AGIs $50k-75k, 1.5% for AGIs $75k-100k, 5.3% for AGIs over 100k)
Profit/loss from business: +$7,465 (reported on 20.1% of returns)
Here:
+$7,465
State:
+$11,013
(% of AGI for various income ranges: 17.9% for AGIs below $10k, 8.1% for AGIs $10k-25k, 2.8% for AGIs $25k-50k, 3.4% for AGIs $50k-75k, 1.5% for AGIs $75k-100k, 4.4% for AGIs over 100k)
IRA payment deduction: $2,860 (reported on 2.1% of returns)
76023:
$2,860
Texas:
$3,120
(% of AGI for various income ranges: 0.2% for AGIs $10k-25k, 0.1% for AGIs $25k-50k, 0.2% for AGIs $50k-75k, 0.3% for AGIs $75k-100k)
Total itemized deductions: $17,460 (25% of AGI, reported on 21.4% of returns)
Here:
$17,460
State:
$19,631
Here:
25.2% of AGI
State:
18.9% of AGI
(% of AGI for various income ranges: 12.4% for AGIs below $10k, 5.6% for AGIs $10k-25k, 8.5% for AGIs $25k-50k, 13.7% for AGIs $50k-75k, 9.6% for AGIs $75k-100k, 8.4% for AGIs over 100k)
Charity contributions deductions: $3,320 (4% of AGI, reported on 15.7% of returns)
Here:
$3,320
State:
$4,753
Here:
4.5% of AGI
State:
4.2% of AGI
(% of AGI for various income ranges: 0.7% for AGIs $10k-25k, 1.0% for AGIs $25k-50k, 1.3% for AGIs $50k-75k, 1.5% for AGIs $75k-100k, 2.1% for AGIs over 100k)
Total tax: $5,141 (reported on 74.9% of returns)
76023:
$5,141
State:
$9,058
(% of AGI for various income ranges: 7.7% for AGIs below $10k, 4.3% for AGIs $10k-25k, 6.3% for AGIs $25k-50k, 9.0% for AGIs $50k-75k, 11.1% for AGIs $75k-100k, 17.4% for AGIs over 100k)
Earned income credit: $1,871 (reported on 18.1% of returns)
Here:
$1,871
State:
$2,024
Percentage of individuals using paid preparers for their 2004 taxes: 61.4%
Here:
61%
State:
57%
(% for various income ranges: 55.3% for AGIs below $10k, 60.5% for AGIs $10k-25k, 64.0% for AGIs $25k-50k, 64.0% for AGIs $50k-75k, 58.4% for AGIs $75k-100k, 71.4% for AGIs over 100k)
Likely homosexual households (counted as self-reported same-sex unmarried-partner households)
Lesbian couples: 0.4% of all households
Gay men: 0.0% of all households
Household received Food Stamps/SNAP in the past 12 months: 140 Household did not receive Food Stamps/SNAP in the past 12 months: 2,484
Women who had a birth in the past 12 months: 97 (22 now married, 72 unmarried) Women who did not have a birth in the past 12 months: 1,563 (883 now married, 673 unmarried)
Housing units in zip code 76023 with a mortgage: 1,202 (65 second mortgage, 12 both second mortgage and home equity loan) Median monthly owner costs for units with a mortgage: $2,078 Median monthly owner costs for units without a mortgage: $670
Residents with income below the poverty level in 2022:
This zip code:
10.7%
Whole state:
14.0%
Residents with income below 50% of the poverty level in 2022:
This zip code:
2.3%
Whole state:
7.4%
Median number of rooms in houses and condos:
Here:
6.2
State:
6.3
Median number of rooms in apartments:
Here:
4.4
State:
4.0
Notable locations in this zip code not listed on our city pages
Churches in zip code 76023 include: Pleasant Grove Church Number 2 (A), Trinity Baptist Church (B), Grove Baptist Church (C), First Baptist Church (D), Friendship Church (E), Garvin Church (F), New Hope Church (G). Display/hide their locations on the map
Streams, rivers, and creeks: Blue Creek (A), Walker Creek (B), Salt Creek (C), Dry Fork (D), Garrett Creek (E), Hog Branch (F), Deep Creek (G). Display/hide their locations on the map
Size of family households: 1,009 2-persons, 259 3-persons, 606 4-persons, 118 5-persons, 86 6-persons, 34 7-or-more-persons
Size of nonfamily households: 385 1-person, 119 2-persons
1,063 married couples with children.
445 single-parent households (370 men, 75 women).
93.2% of residents of 76023 zip code speak English at home.
5.2% of residents speak Spanish at home (65% very well, 20% well, 11% not well, 4% not at all).
1.5% of residents speak other Indo-European language at home (100% very well).
Foreign born population: 254 (3.4%) (1.3% of them are naturalized citizens)
This zip code:
3.4%
Whole state:
17.2%
91%Honduras
3%Barbados
2%Chile
42%English
14%Irish
11%American
8%German
3%Russian
2%French
2%Scottish
Year of entry for the foreign-born population
322010 or later
962000 to 2009
781990 to 1999
66Before 1990
Housing units lacking complete plumbing facilities: 2.1% Housing units lacking complete kitchen facilities: 1.5%
79.7%Electricity
13.5%Bottled, tank, or LP gas
5.9%Utility gas
0.5%Other fuel
Population in 1990: 4,292. Population change in the 1990s: +1,042 (+24.3%).
Place of birth for U.S.-born residents:
This state: 5,336
Northeast: 54
Midwest: 382
South: 668
West: 676
57% of the 76023 zip code residents lived in the same house 5 years ago. Out of people who lived in different houses, 34% lived in this county. Out of people who lived in different counties, 50% lived in Texas.
93% of the 76023 zip code residents lived in the same house 1 year ago. Out of people who lived in different houses, 17% moved from this county. Out of people who lived in different houses, 87% moved from different county within same state.
Private vs. public school enrollment:
Students in private schools in grades 1 to 8 (elementary and middle school): 50
Here:
6.2%
Texas:
8.8%
Students in private schools in grades 9 to 12 (high school): 7
Here:
1.9%
Texas:
8.0%
Students in private undergraduate colleges: 48
Here:
37.0%
Texas:
16.2%
Occupation by median earnings in the past 12 months ($)
127,264Business and financial operations occupations
111,142Health diagnosing and treating practitioners and other technical occupations
91,666Computer and mathematical occupations
86,642Architecture and engineering occupations
84,533Community and social service occupations
79,595Management occupations
Companies with federal contracts located in this zip code:
TOBY L MILLER (550 E ROCK ISLAND AVE in BOYD, TX; small business)
$300,000 with Army for Maintenance, Repair and Rebuilding of Equipment -- Ground Effect Vehicles, Motor Vehicles, Trailers, and Cycles. Signed on 2005-08-05. Completion date: 2005-04-22.
Top industries in this zip code by the number of employees in 2005:
Other Services (except Public Administration): Automotive Body, Paint, and Interior Repair and Maintenance (10-19 employees: 2 establishments)
Finance and Insurance: Commercial Banking (10-19: 2)
Construction: Poured Concrete Foundation and Structure Contractors (10-19: 1, 5-9: 1, 1-4: 1)
Fatal accident statistics in 2013:
Fatal accident count: 1
Vehicles involved in fatal accidents: 1
Fatal accidents caused by drunken drivers: 0
Fatalities: 1
Persons involved in fatal accidents: 2
Pedestrians involved in fatal accidents: 1
Fatal accident statistics in 2012:
Fatal accident count: 4
Vehicles involved in fatal accidents: 5
Fatal accidents caused by drunken drivers: 1
Fatalities: 4
Persons involved in fatal accidents: 5
Pedestrians involved in fatal accidents: 1
Home Mortgage Disclosure Act Aggregated Statistics For Year 2009 (Based on 4 partial tracts)
A) FHA, FSA/RHS & VA Home Purchase Loans
B) Conventional Home Purchase Loans
C) Refinancings
D) Home Improvement Loans
F) Non-occupant Loans on < 5 Family Dwellings (A B C & D)
G) Loans On Manufactured Home Dwelling (A B C & D)
Number
Average Value
Number
Average Value
Number
Average Value
Number
Average Value
Number
Average Value
Number
Average Value
LOANS ORIGINATED
33
$126,473
38
$118,559
91
$154,254
13
$40,344
19
$97,809
26
$80,479
APPLICATIONS APPROVED, NOT ACCEPTED
4
$77,105
4
$71,960
15
$127,539
0
$0
1
$35,420
10
$62,400
APPLICATIONS DENIED
12
$86,294
6
$119,695
49
$111,941
23
$45,773
0
$0
20
$71,638
APPLICATIONS WITHDRAWN
3
$72,477
3
$144,533
31
$127,351
10
$45,364
1
$113,360
9
$53,917
FILES CLOSED FOR INCOMPLETENESS
3
$87,783
3
$98,060
10
$121,498
4
$59,778
1
$116,190
4
$89,000
Aggregated Statistics For Year 2008 (Based on 4 partial tracts)
A) FHA, FSA/RHS & VA Home Purchase Loans
B) Conventional Home Purchase Loans
C) Refinancings
D) Home Improvement Loans
F) Non-occupant Loans on < 5 Family Dwellings (A B C & D)
G) Loans On Manufactured Home Dwelling (A B C & D)
Number
Average Value
Number
Average Value
Number
Average Value
Number
Average Value
Number
Average Value
Number
Average Value
LOANS ORIGINATED
53
$124,386
67
$145,111
74
$128,132
22
$44,882
12
$126,961
47
$82,521
APPLICATIONS APPROVED, NOT ACCEPTED
1
$252,190
17
$100,725
10
$108,397
3
$16,377
1
$86,510
11
$72,423
APPLICATIONS DENIED
4
$81,635
36
$79,356
76
$137,137
32
$27,518
7
$51,099
36
$66,678
APPLICATIONS WITHDRAWN
6
$128,045
3
$122,383
36
$121,978
4
$90,850
0
$0
6
$78,675
FILES CLOSED FOR INCOMPLETENESS
3
$98,717
1
$212,550
9
$176,909
3
$14,170
0
$0
3
$98,717
Aggregated Statistics For Year 2007 (Based on 4 partial tracts)
A) FHA, FSA/RHS & VA Home Purchase Loans
B) Conventional Home Purchase Loans
C) Refinancings
D) Home Improvement Loans
F) Non-occupant Loans on < 5 Family Dwellings (A B C & D)
G) Loans On Manufactured Home Dwelling (A B C & D)
Number
Average Value
Number
Average Value
Number
Average Value
Number
Average Value
Number
Average Value
Number
Average Value
LOANS ORIGINATED
42
$117,316
117
$124,802
83
$127,790
22
$57,279
17
$149,208
54
$93,783
APPLICATIONS APPROVED, NOT ACCEPTED
0
$0
21
$121,532
15
$153,885
11
$33,076
4
$137,802
9
$58,903
APPLICATIONS DENIED
6
$103,243
43
$104,681
99
$125,561
54
$43,747
9
$60,726
42
$55,373
APPLICATIONS WITHDRAWN
4
$121,152
16
$145,800
46
$121,180
4
$51,328
0
$0
7
$88,360
FILES CLOSED FOR INCOMPLETENESS
0
$0
4
$139,868
14
$154,076
3
$19,870
0
$0
1
$104,880
Aggregated Statistics For Year 2006 (Based on 4 partial tracts)
A) FHA, FSA/RHS & VA Home Purchase Loans
B) Conventional Home Purchase Loans
C) Refinancings
D) Home Improvement Loans
F) Non-occupant Loans on < 5 Family Dwellings (A B C & D)
G) Loans On Manufactured Home Dwelling (A B C & D)
Number
Average Value
Number
Average Value
Number
Average Value
Number
Average Value
Number
Average Value
Number
Average Value
LOANS ORIGINATED
29
$102,833
105
$96,525
87
$120,957
15
$70,813
19
$129,137
35
$84,924
APPLICATIONS APPROVED, NOT ACCEPTED
4
$150,555
18
$65,819
30
$91,271
7
$31,557
4
$131,428
14
$63,846
APPLICATIONS DENIED
3
$83,130
56
$96,699
69
$110,128
39
$25,524
7
$88,801
35
$55,012
APPLICATIONS WITHDRAWN
0
$0
11
$161,438
32
$120,529
4
$23,982
1
$212,550
1
$20,120
FILES CLOSED FOR INCOMPLETENESS
0
$0
3
$119,527
29
$132,522
0
$0
0
$0
1
$202,630
Aggregated Statistics For Year 2005 (Based on 4 partial tracts)
A) FHA, FSA/RHS & VA Home Purchase Loans
B) Conventional Home Purchase Loans
C) Refinancings
D) Home Improvement Loans
F) Non-occupant Loans on < 5 Family Dwellings (A B C & D)
G) Loans On Manufactured Home Dwelling (A B C & D)
Number
Average Value
Number
Average Value
Number
Average Value
Number
Average Value
Number
Average Value
Number
Average Value
LOANS ORIGINATED
37
$101,388
121
$98,525
148
$111,710
19
$36,576
22
$82,996
46
$69,023
APPLICATIONS APPROVED, NOT ACCEPTED
1
$216,800
29
$93,860
22
$118,139
2
$23,205
0
$0
10
$80,291
APPLICATIONS DENIED
4
$101,110
65
$87,994
161
$104,855
49
$45,496
10
$72,634
52
$59,613
APPLICATIONS WITHDRAWN
1
$131,940
26
$137,013
94
$133,030
10
$178,947
3
$102,023
7
$83,957
FILES CLOSED FOR INCOMPLETENESS
0
$0
11
$109,298
32
$119,986
0
$0
1
$86,440
1
$185,560
Aggregated Statistics For Year 2004 (Based on 4 partial tracts)
A) FHA, FSA/RHS & VA Home Purchase Loans
B) Conventional Home Purchase Loans
C) Refinancings
D) Home Improvement Loans
F) Non-occupant Loans on < 5 Family Dwellings (A B C & D)
G) Loans On Manufactured Home Dwelling (A B C & D)
Detailed PMIC statistics for the following Tracts:1501.02
, 1506.01
2002 - 2018 National Fire Incident Reporting System (NFIRS) incidents
According to the data from the years 2002 - 2018 the average number of fires per year is 131. The highest number of reported fires - 376 took place in 2005, and the least - 16 in 2002. The data has an increasing trend.
When looking into fire subcategories, the most reports belonged to: Outside Fires (52.6%), and Structure Fires (23.1%).
Fire incident types reported to NFIRS in Zip Code 76023

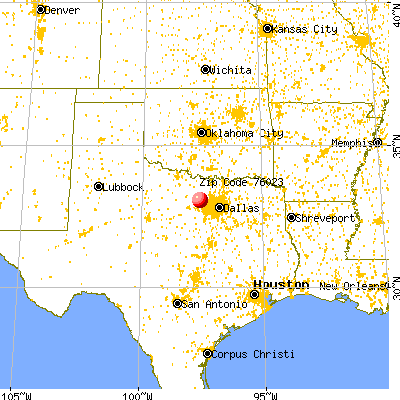


 Nearest zip codes: 76073, 76078, 76020, 76082, 76071, 76085.


 According to the data from the years 2002 - 2018 the average number of fires per year is 131. The highest number of reported fires - 376 took place in 2005, and the least - 16 in 2002. The data has an increasing trend.
 When looking into fire subcategories, the most reports belonged to: Outside Fires (52.6%), and Structure Fires (23.1%).