Estimated zip code population in 2022: 1,408 Zip code population in 2010: 1,262 Zip code population in 2000: 965
Houses and condos: 567 Renter-occupied apartments: 77
% of renters here:
14%
State:
38%
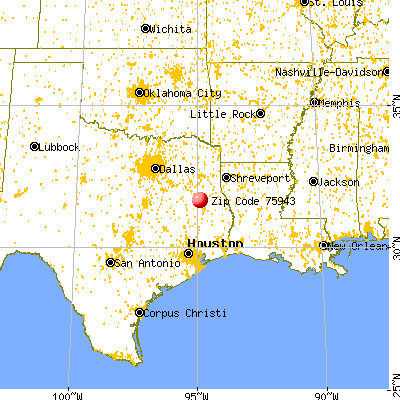
March 2022 cost of living index in zip code 75943: 80.4 (low, U.S. average is 100)
Land area: 64.2 sq. mi. Water area: 1.1 sq. mi.
Population density: 22 people per square mile
(very low).
OSM Map
General Map
Google Map
MSN Map
OSM Map
General Map
Google Map
MSN Map
OSM Map
General Map
Google Map
MSN Map
OSM Map
General Map
Google Map
MSN Map
Please wait while loading the map...
Real estate property taxes paid for housing units in 2022:
This zip code:
0.9% ($1,965)
Texas:
1.5% ($4,050)
Median real estate property taxes paid for housing units with mortgages in 2022: $1,897 (0.8%) Median real estate property taxes paid for housing units with no mortgage in 2022: $2,230 (1.7%)
Business Search- 14 Million verified businesses
Males: 745
(52.9%)
Females: 663
(47.1%)
For population 25 years and over in 75943:
High school or higher: 97.9%
Bachelor's degree or higher: 44.6%
Graduate or professional degree: 20.0%
Unemployed: 0.3%
Mean travel time to work (commute): 42.5 minutes
For population 15 years and over in 75943:
Never married: 23.7%
Now married: 60.3%
Separated: 0.0%
Widowed: 5.9%
Divorced: 10.1%
Zip code 75943 compared to state average:
Unemployed percentage significantly below state average.
Hispanic race population percentage significantly below state average.
Median age above state average.
Foreign-born population percentage significantly below state average.
Renting percentage significantly below state average.
Length of stay since moving in above state average.
Estimated median house/condo value in 2022: $217,890
75943:
$217,890
Texas:
$275,400
According to our research of Texas and other state lists, there were 4 registered sex offenders living in 75943 zip code as of July 04, 2024. The ratio of all residents to sex offenders in zip code 75943 is 379 to 1. The ratio of registered sex offenders to all residents in this zip code is near the state average.
Median resident age:
This zip code:
42.6 years
Texas median age:
35.6 years
Average household size:
This zip code:
2.6 people
Texas:
2.6 people
Averages for the 2020 tax year for zip code 75943, filed in 2021:
Average Adjusted Gross Income (AGI) in 2020: $63,800 (Individual Income Tax Returns)
Here:
$63,800
State:
$77,054
Salary/wage: $54,784 (reported on 78.5% of returns)
Here:
$54,784
State:
$62,766
(% of AGI for various income ranges: 1443.1% for AGIs below $25k, 3596.9% for AGIs $25k-50k, 5740.0% for AGIs $50k-75k, 9052.0% for AGIs $75k-100k, 18348.6% for AGIs $100k-200k)
Taxable interest for individuals: $726 (reported on 29.2% of returns)
This zip code:
$726
Texas:
$2,665
(% of AGI for various income ranges: 8.5% for AGIs below $25k, 26.9% for AGIs $25k-50k, 14.0% for AGIs $75k-100k, 121.4% for AGIs $100k-200k)
Ordinary dividends: $2,491 (reported on 16.9% of returns)
Here:
$2,491
State:
$10,044
(% of AGI for various income ranges: 42.3% for AGIs below $25k, 45.7% for AGIs $50k-75k, 267.1% for AGIs $100k-200k)
Net capital gain/loss in AGI: +$15,936 (reported on 16.9% of returns)
Here:
+$15,936
State:
+$39,590
(% of AGI for various income ranges: 25.4% for AGIs below $25k, 44.3% for AGIs $50k-75k, 2412.9% for AGIs $100k-200k)
Profit/loss from business: +$10,220 (reported on 23.1% of returns)
Here:
+$10,220
State:
+$10,888
(% of AGI for various income ranges: 203.8% for AGIs below $25k, 99.2% for AGIs $25k-50k, 684.3% for AGIs $50k-75k, 942.9% for AGIs $100k-200k)
Taxable individual retirement arrangement distribution: $19,350 (reported on 9.2% of returns)
75943:
$19,350
Texas:
$24,740
(% of AGI for various income ranges: 807.1% for AGIs $50k-75k, 851.4% for AGIs $100k-200k)
Earned income credit: $2,245 (reported on 16.9% of returns)
Here:
$2,245
State:
$2,584
(% of AGI for various income ranges: 111.5% for AGIs below $25k, 78.5% for AGIs $25k-50k)
Percentage of individuals using paid preparers for their 2020 taxes: 92.3%
Here:
92%
State:
92%
(% for various income ranges: 90.5% for AGIs below $25k, 93.8% for AGIs $25k-50k, 88.9% for AGIs $50k-75k, 85.7% for AGIs $75k-100k, 100.0% for AGIs $100k-200k, 100.0% for AGIs over 200k)
Averages for the 2012 tax year for zip code 75943, filed in 2013:
Average Adjusted Gross Income (AGI) in 2012: $46,836 (Individual Income Tax Returns)
Here:
$46,836
State:
$65,384
Salary/wage: $42,485 (reported on 83.6% of returns)
Here:
$42,485
State:
$52,524
(% of AGI for various income ranges: 80.7% for AGIs below $25k, 82.2% for AGIs $25k-50k, 87.8% for AGIs $50k-75k, 78.2% for AGIs $75k-100k, 63.0% for AGIs $100k-200k)
Taxable interest for individuals: $456 (reported on 29.1% of returns)
This zip code:
$456
Texas:
$2,372
(% of AGI for various income ranges: 1.0% for AGIs below $25k, 0.4% for AGIs $25k-50k, 0.1% for AGIs $50k-75k, 0.2% for AGIs $75k-100k, 0.1% for AGIs $100k-200k)
Ordinary dividends: $783 (reported on 10.9% of returns)
Here:
$783
State:
$9,721
Net capital gain/loss in AGI: +$980 (reported on 9.1% of returns)
Here:
+$980
State:
+$35,319
Profit/loss from business: +$13,655 (reported on 20.0% of returns)
Here:
+$13,655
State:
+$13,732
(% of AGI for various income ranges: 6.8% for AGIs below $25k, 9.5% for AGIs $25k-50k, 18.7% for AGIs $75k-100k)
Taxable individual retirement arrangement distribution: $13,967 (reported on 5.5% of returns)
75943:
$13,967
Texas:
$19,511
Total itemized deductions: $22,544 (23% of AGI, reported on 16.4% of returns)
Here:
$22,544
State:
$24,724
Here:
23.2% of AGI
State:
15.9% of AGI
(% of AGI for various income ranges: 16.6% for AGIs $25k-50k, 9.7% for AGIs $75k-100k, 9.1% for AGIs $100k-200k)
Charity contributions: $4,933 (reported on 10.9% of returns)
Here:
$4,933
State:
$6,808
Taxes paid: $3,389 (reported on 16.4% of returns)
75943:
$3,389
State:
$6,921
(% of AGI for various income ranges: 1.6% for AGIs $25k-50k, 1.6% for AGIs $75k-100k, 1.8% for AGIs $100k-200k)
Earned income credit: $2,383 (reported on 21.8% of returns)
Here:
$2,383
State:
$2,570
(% of AGI for various income ranges: 7.3% for AGIs below $25k, 1.4% for AGIs $25k-50k)
Percentage of individuals using paid preparers for their 2012 taxes: 50.9%
Here:
51%
State:
51%
(% for various income ranges: 45.8% for AGIs below $25k, 53.8% for AGIs $25k-50k, 50.0% for AGIs $50k-75k, 60.0% for AGIs $75k-100k, 60.0% for AGIs $100k-200k)
Averages for the 2004 tax year for zip code 75943, filed in 2005:
Average Adjusted Gross Income (AGI) in 2004: $38,381 (Individual Income Tax Returns)
Here:
$38,381
State:
$47,881
Salary/wage: $33,861 (reported on 81.5% of returns)
Here:
$33,861
State:
$41,947
(% of AGI for various income ranges: 128.1% for AGIs below $10k, 83.0% for AGIs $10k-25k, 80.4% for AGIs $25k-50k, 75.8% for AGIs $50k-75k, 72.2% for AGIs $75k-100k, 51.6% for AGIs over 100k)
Taxable interest for individuals: $852 (reported on 37.7% of returns)
This zip code:
$852
Texas:
$2,255
(% of AGI for various income ranges: 6.5% for AGIs below $10k, 1.0% for AGIs $10k-25k, 1.1% for AGIs $25k-50k, 0.6% for AGIs $50k-75k, 0.2% for AGIs $75k-100k, 0.7% for AGIs over 100k)
Taxable dividends: $671 (reported on 16.3% of returns)
Here:
$671
State:
$4,261
(% of AGI for various income ranges: 1.9% for AGIs below $10k, 0.0% for AGIs $10k-25k, 0.3% for AGIs $25k-50k, 0.3% for AGIs $50k-75k, 0.4% for AGIs over 100k)
Net capital gain/loss: +$7,265 (reported on 14.0% of returns)
Here:
+$7,265
State:
+$16,110
(% of AGI for various income ranges: 7.1% for AGIs below $10k, -0.0% for AGIs $25k-50k, 2.1% for AGIs $50k-75k, 8.2% for AGIs over 100k)
Profit/loss from business: +$6,688 (reported on 16.5% of returns)
Here:
+$6,688
State:
+$11,013
(% of AGI for various income ranges: -23.1% for AGIs below $10k, 4.7% for AGIs $10k-25k, 5.8% for AGIs $25k-50k, 0.5% for AGIs $50k-75k, 7.1% for AGIs $75k-100k)
IRA payment deduction: $1,800 (reported on 2.1% of returns)
75943:
$1,800
Texas:
$3,120
Total itemized deductions: $18,088 (22% of AGI, reported on 16.5% of returns)
Here:
$18,088
State:
$19,631
Here:
21.9% of AGI
State:
18.9% of AGI
(% of AGI for various income ranges: 8.5% for AGIs $10k-25k, 7.1% for AGIs $25k-50k, 10.4% for AGIs $50k-75k, 6.5% for AGIs $75k-100k, 7.4% for AGIs over 100k)
Charity contributions deductions: $3,969 (5% of AGI, reported on 13.4% of returns)
Here:
$3,969
State:
$4,753
Here:
5.5% of AGI
State:
4.2% of AGI
Total tax: $5,642 (reported on 70.8% of returns)
75943:
$5,642
State:
$9,058
(% of AGI for various income ranges: 6.5% for AGIs below $10k, 3.8% for AGIs $10k-25k, 6.7% for AGIs $25k-50k, 9.1% for AGIs $50k-75k, 11.0% for AGIs $75k-100k, 17.9% for AGIs over 100k)
Earned income credit: $1,640 (reported on 22.8% of returns)
Here:
$1,640
State:
$2,024
Percentage of individuals using paid preparers for their 2004 taxes: 58.0%
Here:
58%
State:
57%
(% for various income ranges: 57.9% for AGIs below $10k, 59.7% for AGIs $10k-25k, 56.7% for AGIs $25k-50k, 57.9% for AGIs $50k-75k, 48.6% for AGIs $75k-100k, 70.4% for AGIs over 100k)
Household received Food Stamps/SNAP in the past 12 months: 17 Household did not receive Food Stamps/SNAP in the past 12 months: 529
Women who had a birth in the past 12 months: 48 (49 now married, 0 unmarried) Women who did not have a birth in the past 12 months: 274 (133 now married, 140 unmarried)
Housing units in zip code 75943 with a mortgage: 211 Median monthly owner costs for units with a mortgage: $1,640 Median monthly owner costs for units without a mortgage: $428
Residents with income below the poverty level in 2022:
This zip code:
11.5%
Whole state:
14.0%
Residents with income below 50% of the poverty level in 2022:
This zip code:
7.6%
Whole state:
7.4%
Median number of rooms in houses and condos:
Here:
5.8
State:
6.3
Median number of rooms in apartments:
Here:
5.2
State:
4.0
Notable locations in this zip code not listed on our city pages
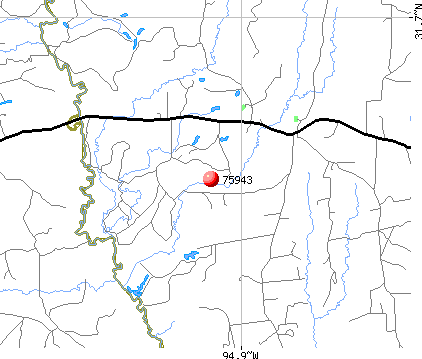
Streams, rivers, and creeks: Bingham Creek (A), Baxter Branch (B), Mill Creek (C), King Creek (D), Caney Creek (E), Monkey Creek (F), Gibbons Creek (G), Legg Creek (H). Display/hide their locations on the map
Size of family households: 200 2-persons, 72 3-persons, 34 4-persons, 32 5-persons, 50 6-persons
Size of nonfamily households: 115 1-person, 39 2-persons, 5 3-persons
311 married couples with children.
44 single-parent households (44 men).
95.8% of residents of 75943 zip code speak English at home.
2.5% of residents speak Spanish at home (100% very well).
0.8% of residents speak other Indo-European language at home (100% well).
0.7% of residents speak Asian or Pacific Island language at home (56% very well, 44% not well).
Foreign born population: 44 (3.1%) (100.0% of them are naturalized citizens)
This zip code:
3.1%
Whole state:
17.2%
32%Malaysia
24%France
22%Thailand
15%Chile
32%American
18%English
10%Irish
5%Italian
4%Scottish
3%French
2%German
Year of entry for the foreign-born population
62010 or later
252000 to 2009
01990 to 1999
20Before 1990
Housing units lacking complete plumbing facilities: 1.8% Housing units lacking complete kitchen facilities: 3.9%
69.6%Electricity
18.4%Utility gas
9.9%Bottled, tank, or LP gas
2.7%No fuel used
Population in 1990: 1,005.
Place of birth for U.S.-born residents:
This state: 1,092
Northeast: 32
Midwest: 117
South: 51
West: 51
58% of the 75943 zip code residents lived in the same house 5 years ago. Out of people who lived in different houses, 57% lived in this county. Out of people who lived in different counties, 50% lived in Texas.
89% of the 75943 zip code residents lived in the same house 1 year ago. Out of people who lived in different houses, 87% moved from this county. Out of people who lived in different houses, 6% moved from different county within same state.
Private vs. public school enrollment:
Students in private schools in grades 1 to 8 (elementary and middle school): 78
Here:
38.3%
Texas:
8.8%
Students in private schools in grades 9 to 12 (high school):
Here:
0.0%
Texas:
8.0%
Students in private undergraduate colleges: 14
Here:
34.4%
Texas:
16.2%
Occupation by median earnings in the past 12 months ($)
69,178Transportation occupations
51,359Education, training, and library occupations
38,469Management occupations
25,368Construction and extraction occupations
24,116Office and administrative support occupations
Top industries in this zip code by the number of employees in 2005:
Accommodation and Food Services: Full-Service Restaurants (5-9 employees: 2 establishments)
Administrative and Support and Waste Management and Remediation Services: Janitorial Services (5-9: 1)
Construction: New Single-Family Housing Construction (except Operative Builders) (1-4: 1)
Mining: Drilling Oil and Gas Wells (1-4: 1)
Utilities: Water Supply and Irrigation Systems (1-4: 1)
People in group quarters in 2000:
6 people in agriculture workers' dormitories on farms
Fatal accident statistics in 2014:
Fatal accident count: 1
Vehicles involved in fatal accidents: 1
Fatal accidents caused by drunken drivers: 0
Fatalities: 1
Persons involved in fatal accidents: 1
Pedestrians involved in fatal accidents: 0
Fatal accident statistics in 2011:
Fatal accident count: 1
Vehicles involved in fatal accidents: 2
Fatal accidents caused by drunken drivers: 0
Fatalities: 1
Persons involved in fatal accidents: 2
Pedestrians involved in fatal accidents: 0
2003 - 2018 National Fire Incident Reporting System (NFIRS) incidents
Based on the data from the years 2003 - 2018 the average number of fire incidents per year is 8. The highest number of reported fire incidents - 32 took place in 2017, and the least - 0 in 2004. The data has a growing trend.
When looking into fire subcategories, the most reports belonged to: Outside Fires (66.2%), and Structure Fires (19.5%).
Fire incident types reported to NFIRS in Zip Code 75943


 Nearest zip codes: 75976, 75925, 75760, 75964, 75788, 75969.


 Based on the data from the years 2003 - 2018 the average number of fire incidents per year is 8. The highest number of reported fire incidents - 32 took place in 2017, and the least - 0 in 2004. The data has a growing trend.
 When looking into fire subcategories, the most reports belonged to: Outside Fires (66.2%), and Structure Fires (19.5%).