Estimated zip code population in 2022: 21,983
Zip code population in 2010: 18,361
Zip code population in 2000: 14,169
Houses and condos: 9,551
Renter-occupied apartments: 1,335
% of renters here:
17%State:
38%
March 2022 cost of living index in zip code 75771: 85.6
(less than average, U.S. average is 100)
Land area: 144.0
sq. mi.
Water area: 2.8
sq. mi.
Population density: 153 people per square mile (very low).
OSM Map
General Map
Google Map
MSN Map
OSM Map
General Map
Google Map
MSN Map
OSM Map
General Map
Google Map
MSN Map
OSM Map
General Map
Google Map
MSN Map
Please wait while loading the map...
Real estate property taxes paid for housing units in 2022:
This zip code:
1.2% ($3,311)Texas:
1.5% ($4,050)
Median real estate property taxes paid for housing units with mortgages in 2022: $3,295 (1.2%)
Median real estate property taxes paid for housing units with no mortgage in 2022: $3,440 (1.2%)
Profiles of local businesses
Business Search - 14 Million verified businesses
Males: 10,502 Females: 11,481
For population 25 years and over in 75771:
High school or higher: 91.4%Bachelor's degree or higher: 27.5%Graduate or professional degree: 9.9%Unemployed: 2.6%Mean travel time to work (commute): 25.6 minutes
For population 15 years and over in 75771:
Never married: 23.9%Now married: 60.8%Separated: 0.6%Widowed: 6.3%Divorced: 8.4%
Zip code 75771 compared to state average:
Black race population percentage below state average. Hispanic race population percentage significantly below state average. Median age above state average. Foreign-born population percentage significantly below state average. Renting percentage below state average. Length of stay since moving in significantly above state average. 17,811 81.0% White 2,176 9.9% Hispanic or Latino 1,262 5.7% Black 371 1.7% Two or more races 274 1.2% Asian 43 0.2% Native Hawaiian and Other 24 0.1% American Indian 19 0.09% Some other race
Data:
Median household income ($)
Median household income (% change since 2000)
Household income diversity
Ratio of average income to average house value (%)
Ratio of average income to average rent
Median household income ($) - White
Median household income ($) - Black or African American
Median household income ($) - Asian
Median household income ($) - Hispanic or Latino
Median household income ($) - American Indian and Alaska Native
Median household income ($) - Multirace
Median household income ($) - Other Race
Median household income for houses/condos with a mortgage ($)
Median household income for apartments without a mortgage ($)
Races - White alone (%)
Races - White alone (% change since 2000)
Races - Black alone (%)
Races - Black alone (% change since 2000)
Races - American Indian alone (%)
Races - American Indian alone (% change since 2000)
Races - Asian alone (%)
Races - Asian alone (% change since 2000)
Races - Hispanic (%)
Races - Hispanic (% change since 2000)
Races - Native Hawaiian and Other Pacific Islander alone (%)
Races - Native Hawaiian and Other Pacific Islander alone (% change since 2000)
Races - Two or more races (%)
Races - Two or more races (% change since 2000)
Races - Other race alone (%)
Races - Other race alone (% change since 2000)
Racial diversity
Unemployment (%)
Unemployment (% change since 2000)
Unemployment (%) - White
Unemployment (%) - Black or African American
Unemployment (%) - Asian
Unemployment (%) - Hispanic or Latino
Unemployment (%) - American Indian and Alaska Native
Unemployment (%) - Multirace
Unemployment (%) - Other Race
Population density (people per square mile)
Population - Males (%)
Population - Females (%)
Population - Males (%) - White
Population - Males (%) - Black or African American
Population - Males (%) - Asian
Population - Males (%) - Hispanic or Latino
Population - Males (%) - American Indian and Alaska Native
Population - Males (%) - Multirace
Population - Males (%) - Other Race
Population - Females (%) - White
Population - Females (%) - Black or African American
Population - Females (%) - Asian
Population - Females (%) - Hispanic or Latino
Population - Females (%) - American Indian and Alaska Native
Population - Females (%) - Multirace
Population - Females (%) - Other Race
Coronavirus confirmed cases (Jul 05, 2024)
Deaths caused by coronavirus (Jul 05, 2024)
Coronavirus confirmed cases (per 100k population) (Jul 05, 2024)
Deaths caused by coronavirus (per 100k population) (Jul 05, 2024)
Daily increase in number of cases (Jul 05, 2024)
Weekly increase in number of cases (Jul 05, 2024)
Cases doubled (in days) (Jul 05, 2024)
Hospitalized patients (Apr 18, 2022)
Negative test results (Apr 18, 2022)
Total test results (Apr 18, 2022)
COVID Vaccine doses distributed (per 100k population) (Sep 19, 2023)
COVID Vaccine doses administered (per 100k population) (Sep 19, 2023)
COVID Vaccine doses distributed (Sep 19, 2023)
COVID Vaccine doses administered (Sep 19, 2023)
Likely homosexual households (%)
Likely homosexual households (% change since 2000)
Likely homosexual households - Lesbian couples (%)
Likely homosexual households - Lesbian couples (% change since 2000)
Likely homosexual households - Gay men (%)
Likely homosexual households - Gay men (% change since 2000)
Cost of living index
Median gross rent ($)
Median contract rent ($)
Median monthly housing costs ($)
Median house or condo value ($)
Median house or condo value ($ change since 2000)
Mean house or condo value by units in structure - 1, detached ($)
Mean house or condo value by units in structure - 1, attached ($)
Mean house or condo value by units in structure - 2 ($)
Mean house or condo value by units in structure by units in structure - 3 or 4 ($)
Mean house or condo value by units in structure - 5 or more ($)
Mean house or condo value by units in structure - Boat, RV, van, etc. ($)
Mean house or condo value by units in structure - Mobile home ($)
Median house or condo value ($) - White
Median house or condo value ($) - Black or African American
Median house or condo value ($) - Asian
Median house or condo value ($) - Hispanic or Latino
Median house or condo value ($) - American Indian and Alaska Native
Median house or condo value ($) - Multirace
Median house or condo value ($) - Other Race
Median resident age
Resident age diversity
Median resident age - Males
Median resident age - Females
Median resident age - White
Median resident age - Black or African American
Median resident age - Asian
Median resident age - Hispanic or Latino
Median resident age - American Indian and Alaska Native
Median resident age - Multirace
Median resident age - Other Race
Median resident age - Males - White
Median resident age - Males - Black or African American
Median resident age - Males - Asian
Median resident age - Males - Hispanic or Latino
Median resident age - Males - American Indian and Alaska Native
Median resident age - Males - Multirace
Median resident age - Males - Other Race
Median resident age - Females - White
Median resident age - Females - Black or African American
Median resident age - Females - Asian
Median resident age - Females - Hispanic or Latino
Median resident age - Females - American Indian and Alaska Native
Median resident age - Females - Multirace
Median resident age - Females - Other Race
Commute - mean travel time to work (minutes)
Travel time to work - Less than 5 minutes (%)
Travel time to work - Less than 5 minutes (% change since 2000)
Travel time to work - 5 to 9 minutes (%)
Travel time to work - 5 to 9 minutes (% change since 2000)
Travel time to work - 10 to 19 minutes (%)
Travel time to work - 10 to 19 minutes (% change since 2000)
Travel time to work - 20 to 29 minutes (%)
Travel time to work - 20 to 29 minutes (% change since 2000)
Travel time to work - 30 to 39 minutes (%)
Travel time to work - 30 to 39 minutes (% change since 2000)
Travel time to work - 40 to 59 minutes (%)
Travel time to work - 40 to 59 minutes (% change since 2000)
Travel time to work - 60 to 89 minutes (%)
Travel time to work - 60 to 89 minutes (% change since 2000)
Travel time to work - 90 or more minutes (%)
Travel time to work - 90 or more minutes (% change since 2000)
Marital status - Never married (%)
Marital status - Now married (%)
Marital status - Separated (%)
Marital status - Widowed (%)
Marital status - Divorced (%)
Median family income ($)
Median family income (% change since 2000)
Median non-family income ($)
Median non-family income (% change since 2000)
Median per capita income ($)
Median per capita income (% change since 2000)
Median family income ($) - White
Median family income ($) - Black or African American
Median family income ($) - Asian
Median family income ($) - Hispanic or Latino
Median family income ($) - American Indian and Alaska Native
Median family income ($) - Multirace
Median family income ($) - Other Race
Median year house/condo built
Median year apartment built
Year house built - Built 2005 or later (%)
Year house built - Built 2000 to 2004 (%)
Year house built - Built 1990 to 1999 (%)
Year house built - Built 1980 to 1989 (%)
Year house built - Built 1970 to 1979 (%)
Year house built - Built 1960 to 1969 (%)
Year house built - Built 1950 to 1959 (%)
Year house built - Built 1940 to 1949 (%)
Year house built - Built 1939 or earlier (%)
Average household size
Household density (households per square mile)
Average household size - White
Average household size - Black or African American
Average household size - Asian
Average household size - Hispanic or Latino
Average household size - American Indian and Alaska Native
Average household size - Multirace
Average household size - Other Race
Occupied housing units (%)
Vacant housing units (%)
Owner occupied housing units (%)
Renter occupied housing units (%)
Vacancy status - For rent (%)
Vacancy status - For sale only (%)
Vacancy status - Rented or sold, not occupied (%)
Vacancy status - For seasonal, recreational, or occasional use (%)
Vacancy status - For migrant workers (%)
Vacancy status - Other vacant (%)
Residents with income below the poverty level (%)
Residents with income below 50% of the poverty level (%)
Children below poverty level (%)
Poor families by family type - Married-couple family (%)
Poor families by family type - Male, no wife present (%)
Poor families by family type - Female, no husband present (%)
Poverty status for native-born residents (%)
Poverty status for foreign-born residents (%)
Poverty among high school graduates not in families (%)
Poverty among people who did not graduate high school not in families (%)
Residents with income below the poverty level (%) - White
Residents with income below the poverty level (%) - Black or African American
Residents with income below the poverty level (%) - Asian
Residents with income below the poverty level (%) - Hispanic or Latino
Residents with income below the poverty level (%) - American Indian and Alaska Native
Residents with income below the poverty level (%) - Multirace
Residents with income below the poverty level (%) - Other Race
Air pollution - Air Quality Index (AQI)
Air pollution - CO
Air pollution - NO2
Air pollution - SO2
Air pollution - Ozone
Air pollution - PM10
Air pollution - PM25
Air pollution - Pb
Crime - Murders per 100,000 population
Crime - Rapes per 100,000 population
Crime - Robberies per 100,000 population
Crime - Assaults per 100,000 population
Crime - Burglaries per 100,000 population
Crime - Thefts per 100,000 population
Crime - Auto thefts per 100,000 population
Crime - Arson per 100,000 population
Crime - City-data.com crime index
Crime - Violent crime index
Crime - Property crime index
Crime - Murders per 100,000 population (5 year average)
Crime - Rapes per 100,000 population (5 year average)
Crime - Robberies per 100,000 population (5 year average)
Crime - Assaults per 100,000 population (5 year average)
Crime - Burglaries per 100,000 population (5 year average)
Crime - Thefts per 100,000 population (5 year average)
Crime - Auto thefts per 100,000 population (5 year average)
Crime - Arson per 100,000 population (5 year average)
Crime - City-data.com crime index (5 year average)
Crime - Violent crime index (5 year average)
Crime - Property crime index (5 year average)
1996 Presidential Elections Results (%) - Democratic Party (Clinton)
1996 Presidential Elections Results (%) - Republican Party (Dole)
1996 Presidential Elections Results (%) - Other
2000 Presidential Elections Results (%) - Democratic Party (Gore)
2000 Presidential Elections Results (%) - Republican Party (Bush)
2000 Presidential Elections Results (%) - Other
2004 Presidential Elections Results (%) - Democratic Party (Kerry)
2004 Presidential Elections Results (%) - Republican Party (Bush)
2004 Presidential Elections Results (%) - Other
2008 Presidential Elections Results (%) - Democratic Party (Obama)
2008 Presidential Elections Results (%) - Republican Party (McCain)
2008 Presidential Elections Results (%) - Other
2012 Presidential Elections Results (%) - Democratic Party (Obama)
2012 Presidential Elections Results (%) - Republican Party (Romney)
2012 Presidential Elections Results (%) - Other
2016 Presidential Elections Results (%) - Democratic Party (Clinton)
2016 Presidential Elections Results (%) - Republican Party (Trump)
2016 Presidential Elections Results (%) - Other
2020 Presidential Elections Results (%) - Democratic Party (Biden)
2020 Presidential Elections Results (%) - Republican Party (Trump)
2020 Presidential Elections Results (%) - Other
Ancestries Reported - Arab (%)
Ancestries Reported - Czech (%)
Ancestries Reported - Danish (%)
Ancestries Reported - Dutch (%)
Ancestries Reported - English (%)
Ancestries Reported - French (%)
Ancestries Reported - French Canadian (%)
Ancestries Reported - German (%)
Ancestries Reported - Greek (%)
Ancestries Reported - Hungarian (%)
Ancestries Reported - Irish (%)
Ancestries Reported - Italian (%)
Ancestries Reported - Lithuanian (%)
Ancestries Reported - Norwegian (%)
Ancestries Reported - Polish (%)
Ancestries Reported - Portuguese (%)
Ancestries Reported - Russian (%)
Ancestries Reported - Scotch-Irish (%)
Ancestries Reported - Scottish (%)
Ancestries Reported - Slovak (%)
Ancestries Reported - Subsaharan African (%)
Ancestries Reported - Swedish (%)
Ancestries Reported - Swiss (%)
Ancestries Reported - Ukrainian (%)
Ancestries Reported - United States (%)
Ancestries Reported - Welsh (%)
Ancestries Reported - West Indian (%)
Ancestries Reported - Other (%)
Educational Attainment - No schooling completed (%)
Educational Attainment - Less than high school (%)
Educational Attainment - High school or equivalent (%)
Educational Attainment - Less than 1 year of college (%)
Educational Attainment - 1 or more years of college (%)
Educational Attainment - Associate degree (%)
Educational Attainment - Bachelor's degree (%)
Educational Attainment - Master's degree (%)
Educational Attainment - Professional school degree (%)
Educational Attainment - Doctorate degree (%)
School Enrollment - Nursery, preschool (%)
School Enrollment - Kindergarten (%)
School Enrollment - Grade 1 to 4 (%)
School Enrollment - Grade 5 to 8 (%)
School Enrollment - Grade 9 to 12 (%)
School Enrollment - College undergrad (%)
School Enrollment - Graduate or professional (%)
School Enrollment - Not enrolled in school (%)
School enrollment - Public schools (%)
School enrollment - Private schools (%)
School enrollment - Not enrolled (%)
Median number of rooms in houses and condos
Median number of rooms in apartments
Housing units lacking complete plumbing facilities (%)
Housing units lacking complete kitchen facilities (%)
Density of houses
Urban houses (%)
Rural houses (%)
Households with people 60 years and over (%)
Households with people 65 years and over (%)
Households with people 75 years and over (%)
Households with one or more nonrelatives (%)
Households with no nonrelatives (%)
Population in households (%)
Family households (%)
Nonfamily households (%)
Population in families (%)
Family households with own children (%)
Median number of bedrooms in owner occupied houses
Mean number of bedrooms in owner occupied houses
Median number of bedrooms in renter occupied houses
Mean number of bedrooms in renter occupied houses
Median number of vehichles in owner occupied houses
Mean number of vehichles in owner occupied houses
Median number of vehichles in renter occupied houses
Mean number of vehichles in renter occupied houses
Mortgage status - with mortgage (%)
Mortgage status - with second mortgage (%)
Mortgage status - with home equity loan (%)
Mortgage status - with both second mortgage and home equity loan (%)
Mortgage status - without a mortgage (%)
Average family size
Average family size - White
Average family size - Black or African American
Average family size - Asian
Average family size - Hispanic or Latino
Average family size - American Indian and Alaska Native
Average family size - Multirace
Average family size - Other Race
Geographical mobility - Same house 1 year ago (%)
Geographical mobility - Moved within same county (%)
Geographical mobility - Moved from different county within same state (%)
Geographical mobility - Moved from different state (%)
Geographical mobility - Moved from abroad (%)
Place of birth - Born in state of residence (%)
Place of birth - Born in other state (%)
Place of birth - Native, outside of US (%)
Place of birth - Foreign born (%)
Housing units in structures - 1, detached (%)
Housing units in structures - 1, attached (%)
Housing units in structures - 2 (%)
Housing units in structures - 3 or 4 (%)
Housing units in structures - 5 to 9 (%)
Housing units in structures - 10 to 19 (%)
Housing units in structures - 20 to 49 (%)
Housing units in structures - 50 or more (%)
Housing units in structures - Mobile home (%)
Housing units in structures - Boat, RV, van, etc. (%)
House/condo owner moved in on average (years ago)
Renter moved in on average (years ago)
Year householder moved into unit - Moved in 1999 to March 2000 (%)
Year householder moved into unit - Moved in 1995 to 1998 (%)
Year householder moved into unit - Moved in 1990 to 1994 (%)
Year householder moved into unit - Moved in 1980 to 1989 (%)
Year householder moved into unit - Moved in 1970 to 1979 (%)
Year householder moved into unit - Moved in 1969 or earlier (%)
Means of transportation to work - Drove car alone (%)
Means of transportation to work - Carpooled (%)
Means of transportation to work - Public transportation (%)
Means of transportation to work - Bus or trolley bus (%)
Means of transportation to work - Streetcar or trolley car (%)
Means of transportation to work - Subway or elevated (%)
Means of transportation to work - Railroad (%)
Means of transportation to work - Ferryboat (%)
Means of transportation to work - Taxicab (%)
Means of transportation to work - Motorcycle (%)
Means of transportation to work - Bicycle (%)
Means of transportation to work - Walked (%)
Means of transportation to work - Other means (%)
Working at home (%)
Industry diversity
Most Common Industries - Agriculture, forestry, fishing and hunting, and mining (%)
Most Common Industries - Agriculture, forestry, fishing and hunting (%)
Most Common Industries - Mining, quarrying, and oil and gas extraction (%)
Most Common Industries - Construction (%)
Most Common Industries - Manufacturing (%)
Most Common Industries - Wholesale trade (%)
Most Common Industries - Retail trade (%)
Most Common Industries - Transportation and warehousing, and utilities (%)
Most Common Industries - Transportation and warehousing (%)
Most Common Industries - Utilities (%)
Most Common Industries - Information (%)
Most Common Industries - Finance and insurance, and real estate and rental and leasing (%)
Most Common Industries - Finance and insurance (%)
Most Common Industries - Real estate and rental and leasing (%)
Most Common Industries - Professional, scientific, and management, and administrative and waste management services (%)
Most Common Industries - Professional, scientific, and technical services (%)
Most Common Industries - Management of companies and enterprises (%)
Most Common Industries - Administrative and support and waste management services (%)
Most Common Industries - Educational services, and health care and social assistance (%)
Most Common Industries - Educational services (%)
Most Common Industries - Health care and social assistance (%)
Most Common Industries - Arts, entertainment, and recreation, and accommodation and food services (%)
Most Common Industries - Arts, entertainment, and recreation (%)
Most Common Industries - Accommodation and food services (%)
Most Common Industries - Other services, except public administration (%)
Most Common Industries - Public administration (%)
Occupation diversity
Most Common Occupations - Management, business, science, and arts occupations (%)
Most Common Occupations - Management, business, and financial occupations (%)
Most Common Occupations - Management occupations (%)
Most Common Occupations - Business and financial operations occupations (%)
Most Common Occupations - Computer, engineering, and science occupations (%)
Most Common Occupations - Computer and mathematical occupations (%)
Most Common Occupations - Architecture and engineering occupations (%)
Most Common Occupations - Life, physical, and social science occupations (%)
Most Common Occupations - Education, legal, community service, arts, and media occupations (%)
Most Common Occupations - Community and social service occupations (%)
Most Common Occupations - Legal occupations (%)
Most Common Occupations - Education, training, and library occupations (%)
Most Common Occupations - Arts, design, entertainment, sports, and media occupations (%)
Most Common Occupations - Healthcare practitioners and technical occupations (%)
Most Common Occupations - Health diagnosing and treating practitioners and other technical occupations (%)
Most Common Occupations - Health technologists and technicians (%)
Most Common Occupations - Service occupations (%)
Most Common Occupations - Healthcare support occupations (%)
Most Common Occupations - Protective service occupations (%)
Most Common Occupations - Fire fighting and prevention, and other protective service workers including supervisors (%)
Most Common Occupations - Law enforcement workers including supervisors (%)
Most Common Occupations - Food preparation and serving related occupations (%)
Most Common Occupations - Building and grounds cleaning and maintenance occupations (%)
Most Common Occupations - Personal care and service occupations (%)
Most Common Occupations - Sales and office occupations (%)
Most Common Occupations - Sales and related occupations (%)
Most Common Occupations - Office and administrative support occupations (%)
Most Common Occupations - Natural resources, construction, and maintenance occupations (%)
Most Common Occupations - Farming, fishing, and forestry occupations (%)
Most Common Occupations - Construction and extraction occupations (%)
Most Common Occupations - Installation, maintenance, and repair occupations (%)
Most Common Occupations - Production, transportation, and material moving occupations (%)
Most Common Occupations - Production occupations (%)
Most Common Occupations - Transportation occupations (%)
Most Common Occupations - Material moving occupations (%)
People in Group quarters - Institutionalized population (%)
People in Group quarters - Correctional institutions (%)
People in Group quarters - Federal prisons and detention centers (%)
People in Group quarters - Halfway houses (%)
People in Group quarters - Local jails and other confinement facilities (including police lockups) (%)
People in Group quarters - Military disciplinary barracks (%)
People in Group quarters - State prisons (%)
People in Group quarters - Other types of correctional institutions (%)
People in Group quarters - Nursing homes (%)
People in Group quarters - Hospitals/wards, hospices, and schools for the handicapped (%)
People in Group quarters - Hospitals/wards and hospices for chronically ill (%)
People in Group quarters - Hospices or homes for chronically ill (%)
People in Group quarters - Military hospitals or wards for chronically ill (%)
People in Group quarters - Other hospitals or wards for chronically ill (%)
People in Group quarters - Hospitals or wards for drug/alcohol abuse (%)
People in Group quarters - Mental (Psychiatric) hospitals or wards (%)
People in Group quarters - Schools, hospitals, or wards for the mentally retarded (%)
People in Group quarters - Schools, hospitals, or wards for the physically handicapped (%)
People in Group quarters - Institutions for the deaf (%)
People in Group quarters - Institutions for the blind (%)
People in Group quarters - Orthopedic wards and institutions for the physically handicapped (%)
People in Group quarters - Wards in general hospitals for patients who have no usual home elsewhere (%)
People in Group quarters - Wards in military hospitals for patients who have no usual home elsewhere (%)
People in Group quarters - Juvenile institutions (%)
People in Group quarters - Long-term care (%)
People in Group quarters - Homes for abused, dependent, and neglected children (%)
People in Group quarters - Residential treatment centers for emotionally disturbed children (%)
People in Group quarters - Training schools for juvenile delinquents (%)
People in Group quarters - Short-term care, detention or diagnostic centers for delinquent children (%)
People in Group quarters - Type of juvenile institution unknown (%)
People in Group quarters - Noninstitutionalized population (%)
People in Group quarters - College dormitories (includes college quarters off campus) (%)
People in Group quarters - Military quarters (%)
People in Group quarters - On base (%)
People in Group quarters - Barracks, unaccompanied personnel housing (UPH), (Enlisted/Officer), ;and similar group living quarters for military personnel (%)
People in Group quarters - Transient quarters for temporary residents (%)
People in Group quarters - Military ships (%)
People in Group quarters - Group homes (%)
People in Group quarters - Homes or halfway houses for drug/alcohol abuse (%)
People in Group quarters - Homes for the mentally ill (%)
People in Group quarters - Homes for the mentally retarded (%)
People in Group quarters - Homes for the physically handicapped (%)
People in Group quarters - Other group homes (%)
People in Group quarters - Religious group quarters (%)
People in Group quarters - Dormitories (%)
People in Group quarters - Agriculture workers' dormitories on farms (%)
People in Group quarters - Job Corps and vocational training facilities (%)
People in Group quarters - Other workers' dormitories (%)
People in Group quarters - Crews of maritime vessels (%)
People in Group quarters - Other nonhousehold living situations (%)
People in Group quarters - Other noninstitutional group quarters (%)
Residents speaking English at home (%)
Residents speaking English at home - Born in the United States (%)
Residents speaking English at home - Native, born elsewhere (%)
Residents speaking English at home - Foreign born (%)
Residents speaking Spanish at home (%)
Residents speaking Spanish at home - Born in the United States (%)
Residents speaking Spanish at home - Native, born elsewhere (%)
Residents speaking Spanish at home - Foreign born (%)
Residents speaking other language at home (%)
Residents speaking other language at home - Born in the United States (%)
Residents speaking other language at home - Native, born elsewhere (%)
Residents speaking other language at home - Foreign born (%)
Class of Workers - Employee of private company (%)
Class of Workers - Self-employed in own incorporated business (%)
Class of Workers - Private not-for-profit wage and salary workers (%)
Class of Workers - Local government workers (%)
Class of Workers - State government workers (%)
Class of Workers - Federal government workers (%)
Class of Workers - Self-employed workers in own not incorporated business and Unpaid family workers (%)
House heating fuel used in houses and condos - Utility gas (%)
House heating fuel used in houses and condos - Bottled, tank, or LP gas (%)
House heating fuel used in houses and condos - Electricity (%)
House heating fuel used in houses and condos - Fuel oil, kerosene, etc. (%)
House heating fuel used in houses and condos - Coal or coke (%)
House heating fuel used in houses and condos - Wood (%)
House heating fuel used in houses and condos - Solar energy (%)
House heating fuel used in houses and condos - Other fuel (%)
House heating fuel used in houses and condos - No fuel used (%)
House heating fuel used in apartments - Utility gas (%)
House heating fuel used in apartments - Bottled, tank, or LP gas (%)
House heating fuel used in apartments - Electricity (%)
House heating fuel used in apartments - Fuel oil, kerosene, etc. (%)
House heating fuel used in apartments - Coal or coke (%)
House heating fuel used in apartments - Wood (%)
House heating fuel used in apartments - Solar energy (%)
House heating fuel used in apartments - Other fuel (%)
House heating fuel used in apartments - No fuel used (%)
Armed forces status - In Armed Forces (%)
Armed forces status - Civilian (%)
Armed forces status - Civilian - Veteran (%)
Armed forces status - Civilian - Nonveteran (%)
Fatal accidents locations in years 2005-2021
Fatal accidents locations in 2005
Fatal accidents locations in 2006
Fatal accidents locations in 2007
Fatal accidents locations in 2008
Fatal accidents locations in 2009
Fatal accidents locations in 2010
Fatal accidents locations in 2011
Fatal accidents locations in 2012
Fatal accidents locations in 2013
Fatal accidents locations in 2014
Fatal accidents locations in 2015
Fatal accidents locations in 2016
Fatal accidents locations in 2017
Fatal accidents locations in 2018
Fatal accidents locations in 2019
Fatal accidents locations in 2020
Fatal accidents locations in 2021
Alcohol use - People drinking some alcohol every month (%)
Alcohol use - People not drinking at all (%)
Alcohol use - Average days/month drinking alcohol
Alcohol use - Average drinks/week
Alcohol use - Average days/year people drink much
Audiometry - Average condition of hearing (%)
Audiometry - People that can hear a whisper from across a quiet room (%)
Audiometry - People that can hear normal voice from across a quiet room (%)
Audiometry - Ears ringing, roaring, buzzing (%)
Audiometry - Had a job exposure to loud noise (%)
Audiometry - Had off-work exposure to loud noise (%)
Blood Pressure & Cholesterol - Has high blood pressure (%)
Blood Pressure & Cholesterol - Checking blood pressure at home (%)
Blood Pressure & Cholesterol - Frequently checking blood cholesterol (%)
Blood Pressure & Cholesterol - Has high cholesterol level (%)
Consumer Behavior - Money monthly spent on food at supermarket/grocery store
Consumer Behavior - Money monthly spent on food at other stores
Consumer Behavior - Money monthly spent on eating out
Consumer Behavior - Money monthly spent on carryout/delivered foods
Consumer Behavior - Income spent on food at supermarket/grocery store (%)
Consumer Behavior - Income spent on food at other stores (%)
Consumer Behavior - Income spent on eating out (%)
Consumer Behavior - Income spent on carryout/delivered foods (%)
Current Health Status - General health condition (%)
Current Health Status - Blood donors (%)
Current Health Status - Has blood ever tested for HIV virus (%)
Current Health Status - Left-handed people (%)
Dermatology - People using sunscreen (%)
Diabetes - Diabetics (%)
Diabetes - Had a blood test for high blood sugar (%)
Diabetes - People taking insulin (%)
Diet Behavior & Nutrition - Diet health (%)
Diet Behavior & Nutrition - Milk product consumption (# of products/month)
Diet Behavior & Nutrition - Meals not home prepared (#/week)
Diet Behavior & Nutrition - Meals from fast food or pizza place (#/week)
Diet Behavior & Nutrition - Ready-to-eat foods (#/month)
Diet Behavior & Nutrition - Frozen meals/pizza (#/month)
Drug Use - People that ever used marijuana or hashish (%)
Drug Use - Ever used hard drugs (%)
Drug Use - Ever used any form of cocaine (%)
Drug Use - Ever used heroin (%)
Drug Use - Ever used methamphetamine (%)
Health Insurance - People covered by health insurance (%)
Kidney Conditions-Urology - Avg. # of times urinating at night
Medical Conditions - People with asthma (%)
Medical Conditions - People with anemia (%)
Medical Conditions - People with psoriasis (%)
Medical Conditions - People with overweight (%)
Medical Conditions - Elderly people having difficulties in thinking or remembering (%)
Medical Conditions - People who ever received blood transfusion (%)
Medical Conditions - People having trouble seeing even with glass/contacts (%)
Medical Conditions - People with arthritis (%)
Medical Conditions - People with gout (%)
Medical Conditions - People with congestive heart failure (%)
Medical Conditions - People with coronary heart disease (%)
Medical Conditions - People with angina pectoris (%)
Medical Conditions - People who ever had heart attack (%)
Medical Conditions - People who ever had stroke (%)
Medical Conditions - People with emphysema (%)
Medical Conditions - People with thyroid problem (%)
Medical Conditions - People with chronic bronchitis (%)
Medical Conditions - People with any liver condition (%)
Medical Conditions - People who ever had cancer or malignancy (%)
Mental Health - People who have little interest in doing things (%)
Mental Health - People feeling down, depressed, or hopeless (%)
Mental Health - People who have trouble sleeping or sleeping too much (%)
Mental Health - People feeling tired or having little energy (%)
Mental Health - People with poor appetite or overeating (%)
Mental Health - People feeling bad about themself (%)
Mental Health - People who have trouble concentrating on things (%)
Mental Health - People moving or speaking slowly or too fast (%)
Mental Health - People having thoughts they would be better off dead (%)
Oral Health - Average years since last visit a dentist
Oral Health - People embarrassed because of mouth (%)
Oral Health - People with gum disease (%)
Oral Health - General health of teeth and gums (%)
Oral Health - Average days a week using dental floss/device
Oral Health - Average days a week using mouthwash for dental problem
Oral Health - Average number of teeth
Pesticide Use - Households using pesticides to control insects (%)
Pesticide Use - Households using pesticides to kill weeds (%)
Physical Activity - People doing vigorous-intensity work activities (%)
Physical Activity - People doing moderate-intensity work activities (%)
Physical Activity - People walking or bicycling (%)
Physical Activity - People doing vigorous-intensity recreational activities (%)
Physical Activity - People doing moderate-intensity recreational activities (%)
Physical Activity - Average hours a day doing sedentary activities
Physical Activity - Average hours a day watching TV or videos
Physical Activity - Average hours a day using computer
Physical Functioning - People having limitations keeping them from working (%)
Physical Functioning - People limited in amount of work they can do (%)
Physical Functioning - People that need special equipment to walk (%)
Physical Functioning - People experiencing confusion/memory problems (%)
Physical Functioning - People requiring special healthcare equipment (%)
Prescription Medications - Average number of prescription medicines taking
Preventive Aspirin Use - Adults 40+ taking low-dose aspirin (%)
Reproductive Health - Vaginal deliveries (%)
Reproductive Health - Cesarean deliveries (%)
Reproductive Health - Deliveries resulted in a live birth (%)
Reproductive Health - Pregnancies resulted in a delivery (%)
Reproductive Health - Women breastfeeding newborns (%)
Reproductive Health - Women that had a hysterectomy (%)
Reproductive Health - Women that had both ovaries removed (%)
Reproductive Health - Women that have ever taken birth control pills (%)
Reproductive Health - Women taking birth control pills (%)
Reproductive Health - Women that have ever used Depo-Provera or injectables (%)
Reproductive Health - Women that have ever used female hormones (%)
Sexual Behavior - People 18+ that ever had sex (vaginal, anal, or oral) (%)
Sexual Behavior - Males 18+ that ever had vaginal sex with a woman (%)
Sexual Behavior - Males 18+ that ever performed oral sex on a woman (%)
Sexual Behavior - Males 18+ that ever had anal sex with a woman (%)
Sexual Behavior - Males 18+ that ever had any sex with a man (%)
Sexual Behavior - Females 18+ that ever had vaginal sex with a man (%)
Sexual Behavior - Females 18+ that ever performed oral sex on a man (%)
Sexual Behavior - Females 18+ that ever had anal sex with a man (%)
Sexual Behavior - Females 18+ that ever had any kind of sex with a woman (%)
Sexual Behavior - Average age people first had sex
Sexual Behavior - Average number of female sex partners in lifetime (males 18+)
Sexual Behavior - Average number of female vaginal sex partners in lifetime (males 18+)
Sexual Behavior - Average age people first performed oral sex on a woman (18+)
Sexual Behavior - Average number of woman performed oral sex on in lifetime (18+)
Sexual Behavior - Average number of male sex partners in lifetime (males 18+)
Sexual Behavior - Average number of male anal sex partners in lifetime (males 18+)
Sexual Behavior - Average age people first performed oral sex on a man (18+)
Sexual Behavior - Average number of male oral sex partners in lifetime (18+)
Sexual Behavior - People using protection when performing oral sex (%)
Sexual Behavior - Average number of times people have vaginal or anal sex a year
Sexual Behavior - People having sex without condom (%)
Sexual Behavior - Average number of male sex partners in lifetime (females 18+)
Sexual Behavior - Average number of male vaginal sex partners in lifetime (females 18+)
Sexual Behavior - Average number of female sex partners in lifetime (females 18+)
Sexual Behavior - Circumcised males 18+ (%)
Sleep Disorders - Average hours sleeping at night
Sleep Disorders - People that has trouble sleeping (%)
Smoking-Cigarette Use - People smoking cigarettes (%)
Taste & Smell - People 40+ having problems with smell (%)
Taste & Smell - People 40+ having problems with taste (%)
Taste & Smell - People 40+ that ever had wisdom teeth removed (%)
Taste & Smell - People 40+ that ever had tonsils teeth removed (%)
Taste & Smell - People 40+ that ever had a loss of consciousness because of a head injury (%)
Taste & Smell - People 40+ that ever had a broken nose or other serious injury to face or skull (%)
Taste & Smell - People 40+ that ever had two or more sinus infections (%)
Weight - Average height (inches)
Weight - Average weight (pounds)
Weight - Average BMI
Weight - People that are obese (%)
Weight - People that ever were obese (%)
Weight - People trying to lose weight (%)
Urban population: 8,890
Rural population: 13,092
Estimated median house/condo value in 2022: $277,483
75771:
$277,483Texas:
$275,400
According to our research of Texas and other state lists, there were 47 registered sex offenders living in 75771 zip code as of July 04, 2024 . The ratio of all residents to sex offenders in zip code 75771 is 448 to 1.The ratio of registered sex offenders to all residents in this zip code is near the state average.
Median resident age: This zip code:
42.2 yearsTexas median age:
35.6 years
Average household size: This zip code:
2.7 peopleTexas:
2.6 people
Averages for the 2020 tax year for zip code 75771, filed in 2021:
Average Adjusted Gross Income (AGI) in 2020: $70,480 (Individual Income Tax Returns) Here:
$70,480State:
$77,054
Salary/wage: $58,336 (reported on 76.2% of returns )Here:
$58,336State:
$62,766
(% of AGI for various income ranges: 1074.8% for AGIs below $25k , 3442.4% for AGIs $25k-50k , 6281.7% for AGIs $50k-75k , 8831.8% for AGIs $75k-100k , 15796.0% for AGIs $100k-200k , 54429.4% for AGIs over 200k ) Taxable interest for individuals: $2,017 (reported on 31.8% of returns )This zip code:
$2,017Texas:
$2,665
(% of AGI for various income ranges: 21.9% for AGIs below $25k , 36.4% for AGIs $25k-50k , 52.1% for AGIs $50k-75k , 87.6% for AGIs $75k-100k , 159.4% for AGIs $100k-200k , 1688.8% for AGIs over 200k ) Ordinary dividends: $8,709 (reported on 18.1% of returns )(% of AGI for various income ranges: 31.5% for AGIs below $25k , 53.6% for AGIs $25k-50k , 110.0% for AGIs $50k-75k , 137.8% for AGIs $75k-100k , 313.0% for AGIs $100k-200k , 5821.2% for AGIs over 200k ) Net capital gain/loss in AGI: +$16,128 (reported on 17.8% of returns )Here:
+$16,128State:
+$39,590
(% of AGI for various income ranges: 13.6% for AGIs below $25k , 35.3% for AGIs $25k-50k , 108.4% for AGIs $50k-75k , 180.1% for AGIs $75k-100k , 546.0% for AGIs $100k-200k , 12978.1% for AGIs over 200k ) Profit/loss from business: +$14,331 (reported on 21.1% of returns )Here:
+$14,331State:
+$10,888
(% of AGI for various income ranges: 186.5% for AGIs below $25k , 255.8% for AGIs $25k-50k , 324.8% for AGIs $50k-75k , 317.4% for AGIs $75k-100k , 796.1% for AGIs $100k-200k , 5511.2% for AGIs over 200k ) Taxable individual retirement arrangement distribution: $22,802 (reported on 12.0% of returns )75771:
$22,802Texas:
$24,740
(% of AGI for various income ranges: 67.7% for AGIs below $25k , 142.8% for AGIs $25k-50k , 352.9% for AGIs $50k-75k , 478.8% for AGIs $75k-100k , 1132.1% for AGIs $100k-200k , 3568.8% for AGIs over 200k ) Self-employed (Keogh) retirement plans: $15,100 (reported on 0.3% of returns )75771:
$15,100Texas:
$29,298
(% of AGI for various income ranges: 45.8% for AGIs $100k-200k ) Total itemized deductions: $36,567 (reported on 6.5% of returns )Here:
$36,567State:
$40,428
(% of AGI for various income ranges: 45.0% for AGIs below $25k , 116.0% for AGIs $25k-50k , 283.7% for AGIs $50k-75k , 295.5% for AGIs $75k-100k , 741.5% for AGIs $100k-200k , 5668.8% for AGIs over 200k ) Charity contributions: $14,870 (reported on 5.5% of returns )Here:
$14,870State:
$18,201
(% of AGI for various income ranges: 4.8% for AGIs below $25k , 20.5% for AGIs $25k-50k , 51.0% for AGIs $50k-75k , 86.9% for AGIs $75k-100k , 252.4% for AGIs $100k-200k , 2721.9% for AGIs over 200k ) Taxes paid: $6,827 (reported on 6.5% of returns )(% of AGI for various income ranges: 6.5% for AGIs below $25k , 15.8% for AGIs $25k-50k , 54.2% for AGIs $50k-75k , 64.9% for AGIs $75k-100k , 159.3% for AGIs $100k-200k , 968.8% for AGIs over 200k ) Earned income credit: $2,336 (reported on 15.8% of returns )(% of AGI for various income ranges: 100.0% for AGIs below $25k , 82.0% for AGIs $25k-50k , 2.4% for AGIs $50k-75k ) Percentage of individuals using paid preparers for their 2020 taxes: 92.1%(% for various income ranges: 91.4% for AGIs below $25k , 92.6% for AGIs $25k-50k , 91.7% for AGIs $50k-75k , 92.7% for AGIs $75k-100k , 92.9% for AGIs $100k-200k , 91.7% for AGIs over 200k )
Averages for the 2012 tax year for zip code 75771, filed in 2013:
Average Adjusted Gross Income (AGI) in 2012: $59,718 (Individual Income Tax Returns) Here:
$59,718State:
$65,384
Salary/wage: $48,125 (reported on 78.2% of returns )Here:
$48,125State:
$52,524
(% of AGI for various income ranges: 70.2% for AGIs below $25k , 73.2% for AGIs $25k-50k , 71.6% for AGIs $50k-75k , 69.0% for AGIs $75k-100k , 68.7% for AGIs $100k-200k , 36.0% for AGIs over 200k ) Taxable interest for individuals: $1,744 (reported on 33.7% of returns )This zip code:
$1,744Texas:
$2,372
(% of AGI for various income ranges: 1.3% for AGIs below $25k , 1.1% for AGIs $25k-50k , 0.8% for AGIs $50k-75k , 0.7% for AGIs $75k-100k , 0.9% for AGIs $100k-200k , 1.2% for AGIs over 200k ) Ordinary dividends: $6,426 (reported on 17.8% of returns )(% of AGI for various income ranges: 2.2% for AGIs below $25k , 1.0% for AGIs $25k-50k , 1.3% for AGIs $50k-75k , 1.1% for AGIs $75k-100k , 1.6% for AGIs $100k-200k , 3.8% for AGIs over 200k ) Net capital gain/loss in AGI: +$17,639 (reported on 15.8% of returns )Here:
+$17,639State:
+$35,319
(% of AGI for various income ranges: 0.6% for AGIs $25k-50k , 0.8% for AGIs $50k-75k , 0.8% for AGIs $75k-100k , 1.8% for AGIs $100k-200k , 18.2% for AGIs over 200k ) Profit/loss from business: +$14,119 (reported on 20.6% of returns )Here:
+$14,119State:
+$13,732
(% of AGI for various income ranges: 10.3% for AGIs below $25k , 4.7% for AGIs $25k-50k , 4.1% for AGIs $50k-75k , 3.6% for AGIs $75k-100k , 6.0% for AGIs $100k-200k , 3.2% for AGIs over 200k ) Taxable individual retirement arrangement distribution: $17,500 (reported on 14.4% of returns )75771:
$17,500Texas:
$19,511
(% of AGI for various income ranges: 4.8% for AGIs below $25k , 3.6% for AGIs $25k-50k , 3.8% for AGIs $50k-75k , 4.9% for AGIs $75k-100k , 5.4% for AGIs $100k-200k , 2.7% for AGIs over 200k ) Self-employment retirement plans: $15,167 (reported on 0.4% of returns )75771:
$15,167Texas:
$23,938
Total itemized deductions: $22,484 (19% of AGI, reported on 27.5% of returns )Here:
$22,484State:
$24,724
Here:
19.4% of AGIState:
15.9% of AGI
(% of AGI for various income ranges: 10.1% for AGIs below $25k , 9.7% for AGIs $25k-50k , 10.3% for AGIs $50k-75k , 11.6% for AGIs $75k-100k , 11.9% for AGIs $100k-200k , 8.0% for AGIs over 200k ) Charity contributions: $7,039 (reported on 22.3% of returns )(% of AGI for various income ranges: 1.4% for AGIs below $25k , 1.8% for AGIs $25k-50k , 2.0% for AGIs $50k-75k , 2.3% for AGIs $75k-100k , 3.3% for AGIs $100k-200k , 3.4% for AGIs over 200k ) Taxes paid: $5,374 (reported on 27.2% of returns )(% of AGI for various income ranges: 1.8% for AGIs below $25k , 1.8% for AGIs $25k-50k , 2.2% for AGIs $50k-75k , 2.8% for AGIs $75k-100k , 3.0% for AGIs $100k-200k , 2.2% for AGIs over 200k ) Earned income credit: $2,294 (reported on 18.3% of returns )(% of AGI for various income ranges: 6.9% for AGIs below $25k , 1.4% for AGIs $25k-50k ) Percentage of individuals using paid preparers for their 2012 taxes: 52.0%(% for various income ranges: 47.2% for AGIs below $25k , 51.1% for AGIs $25k-50k , 52.3% for AGIs $50k-75k , 53.3% for AGIs $75k-100k , 61.8% for AGIs $100k-200k , 76.2% for AGIs over 200k )
Averages for the 2004 tax year for zip code 75771, filed in 2005:
Average Adjusted Gross Income (AGI) in 2004: $44,625 (Individual Income Tax Returns) Here:
$44,625State:
$47,881
Salary/wage: $37,569 (reported on 78.0% of returns )Here:
$37,569State:
$41,947
(% of AGI for various income ranges: 178.1% for AGIs below $10k , 69.1% for AGIs $10k-25k , 74.0% for AGIs $25k-50k , 70.4% for AGIs $50k-75k , 70.0% for AGIs $75k-100k , 51.2% for AGIs over 100k ) Taxable interest for individuals: $2,377 (reported on 42.3% of returns )This zip code:
$2,377Texas:
$2,255
(% of AGI for various income ranges: 16.5% for AGIs below $10k , 2.8% for AGIs $10k-25k , 1.6% for AGIs $25k-50k , 1.7% for AGIs $50k-75k , 1.3% for AGIs $75k-100k , 2.9% for AGIs over 100k ) Taxable dividends: $3,432 (reported on 22.4% of returns )(% of AGI for various income ranges: 9.5% for AGIs below $10k , 2.0% for AGIs $10k-25k , 1.2% for AGIs $25k-50k , 1.2% for AGIs $50k-75k , 1.4% for AGIs $75k-100k , 2.2% for AGIs over 100k ) Net capital gain/loss: +$14,358 (reported on 18.8% of returns )Here:
+$14,358State:
+$16,110
(% of AGI for various income ranges: 7.5% for AGIs below $10k , 0.3% for AGIs $10k-25k , 1.3% for AGIs $25k-50k , 1.6% for AGIs $50k-75k , 1.6% for AGIs $75k-100k , 15.7% for AGIs over 100k ) Profit/loss from business: +$12,029 (reported on 21.3% of returns )Here:
+$12,029State:
+$11,013
(% of AGI for various income ranges: 6.3% for AGIs below $10k , 8.4% for AGIs $10k-25k , 4.3% for AGIs $25k-50k , 4.2% for AGIs $50k-75k , 4.6% for AGIs $75k-100k , 7.3% for AGIs over 100k ) IRA payment deduction: $3,471 (reported on 2.4% of returns )(% of AGI for various income ranges: 0.2% for AGIs $10k-25k , 0.2% for AGIs $25k-50k , 0.2% for AGIs $50k-75k , 0.2% for AGIs $75k-100k , 0.2% for AGIs over 100k ) Self-employed pension: $14,955 (reported on 0.6% of returns )Here:
$14,955Texas:
$16,401
Total itemized deductions: $18,574 (23% of AGI, reported on 28.0% of returns )Here:
$18,574State:
$19,631
Here:
22.9% of AGIState:
18.9% of AGI
(% of AGI for various income ranges: 21.9% for AGIs below $10k , 9.2% for AGIs $10k-25k , 11.2% for AGIs $25k-50k , 12.1% for AGIs $50k-75k , 12.6% for AGIs $75k-100k , 11.6% for AGIs over 100k ) Charity contributions deductions: $5,937 (7% of AGI, reported on 24.1% of returns )Here:
7.0% of AGIState:
4.2% of AGI
(% of AGI for various income ranges: 2.2% for AGIs below $10k , 1.4% for AGIs $10k-25k , 2.3% for AGIs $25k-50k , 2.8% for AGIs $50k-75k , 3.0% for AGIs $75k-100k , 4.6% for AGIs over 100k ) Total tax: $6,611 (reported on 74.8% of returns )(% of AGI for various income ranges: 9.2% for AGIs below $10k , 4.3% for AGIs $10k-25k , 6.3% for AGIs $25k-50k , 8.4% for AGIs $50k-75k , 10.7% for AGIs $75k-100k , 17.8% for AGIs over 100k ) Earned income credit: $1,842 (reported on 17.4% of returns )Percentage of individuals using paid preparers for their 2004 taxes: 58.1%(% for various income ranges: 49.9% for AGIs below $10k , 60.8% for AGIs $10k-25k , 59.6% for AGIs $25k-50k , 57.8% for AGIs $50k-75k , 57.2% for AGIs $75k-100k , 67.3% for AGIs over 100k )
Estimated median household income in 2022: This zip code:
$82,657Texas:
$72,284
Nearest zip codes: 75704 ,
75773 ,
75706 ,
75790 ,
75702 ,
75765 .
Lindale Zip Code Map
Percentage of family households: This zip code:
52.3%Texas:
50.5%
Percentage of households with unmarried partners: This zip code:
2.3%Texas:
48.7%
Likely homosexual households (counted as self-reported same-sex unmarried-partner households)
Lesbian couples: 0.0% of all households Gay men: 0.3% of all households
Household received Food Stamps/SNAP in the past 12 months: 475Household did not receive Food Stamps/SNAP in the past 12 months: 7,489
Women who had a birth in the past 12 months: 124 (74 now married , 48 unmarried) Women who did not have a birth in the past 12 months: 5,021 (2,477 now married , 2,535 unmarried)
Housing units in zip code 75771 with a mortgage: 3,615 (223
second mortgage , 124
home equity loan , 44
both second mortgage and home equity loan )
Houses without a mortgage: 42
Median monthly owner costs for units with a mortgage: $1,525
Median monthly owner costs for units without a mortgage: $648
Residents with income below the poverty level in 2022:
This zip code:
8.6%Whole state:
14.0%
Residents with income below 50% of the poverty level in 2022:
This zip code:
4.5%Whole state:
7.4%
Median number of rooms in houses and condos: Median number of rooms in apartments: Notable locations in this zip code not listed on our city pages
Click to draw/clear zip code borders Notable locations in zip code 75771: (A) , Oakhurst Farm (B) , Dixon Branch Library (C) , Cypress Creek Branch Library (D) , Collier Regional Library (E) , Fifth Ward Branch Library (F) , Fairbanks Branch Library (G) , Lindale Fire Department Station 1 (H) , Lindale Fire Department Station 2 (I) . Display/hide their locations on the map
Churches in zip code 75771 include: (A) , Saint Mary Church (B) , Smith Chapel (C) , Thompson Hills Church (D) , Walnut Springs Church (E) , Clear Spring Church (F) , Union Chapel (G) , Rock Creek Church (H) , Duck Creek Church (I) . Display/hide their locations on the map
Cemeteries: (1) , Flewellen Cemetery (2) , White Cemetery (3) , Sitton Cemetery (4) , Hubbard Cemetery (5) , Dover Cemetery (6) , Galena Cemetery (7) . Display/hide their locations on the map
Lakes and reservoirs: (A) , Tomlin Lake (B) , Stewart Lakes (C) , Lorraine Lake (D) , Lindale Club Lake (E) , Hide-A-Way Lake (F) , Bergfeld Lake (G) , American Legion Lake (H) . Display/hide their locations on the map
Streams, rivers, and creeks: (A) , Saline Creek (B) , Red Springs Branch (C) , Niblack Branch (D) , Old Sabine River Channel (E) , North Prairie Creek (F) , Mill Creek (G) , Lynn Creek (H) , Luckeible Branch (I) . Display/hide their locations on the map
Park in zip code 75771: (1) . Display/hide its location on the map
Year house built (houses)
245 2020 or later2,097 2010 to 20191,761 2000 to 20091,206 1990 to 19991,193 1980 to 19891,347 1970 to 1979697 1960 to 1969309 1950 to 1959354 1940 to 1949160 1939 or earlier
Zip code 75771 household income distribution in 2022 309 Less than $10,000144 $10,000 to $14,999133 $15,000 to $19,999178 $20,000 to $24,999274 $25,000 to $29,999220 $30,000 to $34,999319 $35,000 to $39,999236 $40,000 to $44,999332 $45,000 to $49,999444 $50,000 to $59,9991,069 $60,000 to $74,999950 $75,000 to $99,9991,063 $100,000 to $124,999426 $125,000 to $149,9991,055 $150,000 to $199,999827 $200,000 or moreEstimate of home value of owner-occupied houses/condos in 2022 in zip code 75771 19 $10,000 to $14,99942 $15,000 to $19,99936 $30,000 to $34,99943 $35,000 to $39,999113 $40,000 to $49,99944 $50,000 to $59,99928 $60,000 to $69,99977 $70,000 to $79,999206 $80,000 to $89,99981 $90,000 to $99,999418 $100,000 to $124,999151 $125,000 to $149,999466 $150,000 to $174,999397 $175,000 to $199,999811 $200,000 to $249,999962 $250,000 to $299,9991,166 $300,000 to $399,999608 $400,000 to $499,999670 $500,000 to $749,99952 $750,000 to $999,99936 $1,000,000 to $1,499,99992 $1,500,000 to $1,999,99941 $2,000,000 or moreRent paid by renters in 2022 in zip code 75771 10 $200 to $24946 $400 to $44911 $500 to $54999 $550 to $59921 $700 to $74973 $750 to $799124 $800 to $89962 $900 to $999448 $1,000 to $1,249138 $1,250 to $1,49957 $1,500 to $1,999165 No cash rent
Median gross rent in 2022: $1,317.
Median price asked for vacant for-sale houses and condos in 2022: $302,723.
Estimated median house (or condo) value in 2022 for: White Non-Hispanic householders: $305,784Black or African American householders: $121,337American Indian or Alaska Native householders: $505,519Asian householders: $224,458Some other race householders: $263,494Two or more races householders: $224,458Hispanic or Latino householders: $106,699Estimated median house or condo value in 2022: $277,483
75771:
$277,483Texas:
$275,400
Lower value quartile - upper value quartile: $180,207 - $402,863
Mean price in 2022: Detached houses: $333,116Here:
$333,116State:
$369,058
Townhouses or other attached units: $516,873Here:
$516,873State:
$327,631
Mobile homes: $149,780Here:
$149,780State:
$124,413
Housing units in structures:
One, detached: 7,474One, attached: 234Two: 2013 or 4: 1945 to 9: 14810 to 19: 3420 to 49: 6050 or more: 49Mobile homes: 1,078Unemployment : 2.6%
Means of transportation to work in zip code 75771 67.4% 6,491 Drove a car alone8.2% 790 Carpooled1.3% 124 Bus or trolley bus1.0% 97 Motorcycle3.5% 341 Walked3.0% 285 Other means16.6% 1,598 Worked at homeTravel time to work (commute) in zip code 75771 555 Less than 5 minutes968 5 to 9 minutes974 10 to 14 minutes1,089 15 to 19 minutes862 20 to 24 minutes433 25 to 29 minutes1,585 30 to 34 minutes274 35 to 39 minutes239 40 to 44 minutes505 45 to 59 minutes409 60 to 89 minutes192 90 or more minutes
Percentage of zip code residents living and working in this county: 80.6%
Household type by relationship:
Households: 21,983
Male householders: 4,243 (639 living alone ), Female householders: 3,742 (965 living alone )5,024 spouses (5,024 opposite-sex spouses ), 203 unmarried partners , (203 opposite-sex unmarried partners ), 6,072 children (5,647 natural , 249 adopted , 177 stepchildren ), 905 grandchildren , 125 brothers or sisters , 221 parents , 10 foster children , 437 other relatives , 461 non-relatives In group quarters: 542 (-1 institutionalized population )
Size of family households: 2,856 2-persons , 1,620 3-persons , 910 4-persons , 388 5-persons , 229 6-persons , 203 7-or-more-persons
Size of nonfamily households: 1,603 1-person , 126 2-persons , 40 3-persons
3,244 married couples with children. single-parent households (337 men , 550 women ).
94.0% of residents of 75771 zip code speak English at home. of residents speak Spanish at home (36% very well, 38% well, 15% not well, 11% not at all ).of residents speak other Indo-European language at home (85% very well, 8% well, 7% not well ).of residents speak Asian or Pacific Island language at home (56% very well, 21% well, 23% not well ).
Foreign born population: 1,063 (4.8%)
(57.8%
of them are naturalized citizens )
This zip code:
4.8%Whole state:
17.2%
61% Honduras 5% France 4% Romania 2% Uruguay 2% Bhutan 2% Germany 2% Nepal 30% American 15% English 7% German 6% Irish 2% Scotch-Irish 2% European 1% Norwegian
Year of entry for the foreign-born population
714 2010 or later 230 2000 to 2009 362 1990 to 1999 226 Before 1990
Facilities with environmental interests located in this zip code:
AMERICAN TELEPHONE AND TELEGRAPH COMPANY (2.5 MI NE L432650 in LINDALE, TX)
(Resource Conservation and Recovery Act (tracking hazardous waste)) Alternative names: AMERICAN TEL & TEL CO LONG LINES
Housing units lacking complete plumbing facilities: 11.7%
Housing units lacking complete kitchen facilities: 2.7%
75.1% Electricity 20.0% Utility gas 4.1% Bottled, tank, or LP gas 0.6% Wood
Population in 1990: 9,838. Population change in the 1990s: +4,331 (+44.0%).
Place of birth for U.S.-born residents:
This state: 14,730Northeast: 586Midwest: 1,606South: 1,876West: 1,660
49% of the 75771 zip code residents lived in the same house 5 years ago.
Out of people who lived in different houses, 44% lived in this county.
Out of people who lived in different counties, 50% lived in Texas.
91% of the 75771 zip code residents lived in the same house 1 year ago.
Out of people who lived in different houses, 45% moved from this county.
Out of people who lived in different houses, 41% moved from different county within same state.
Out of people who lived in different houses, 15% moved from different state.
Private vs. public school enrollment:
Students in private schools in grades 1 to 8 (elementary and middle school): 187
Students in private schools in grades 9 to 12 (high school): 55
Students in private undergraduate colleges: 144
Occupation by median earnings in the past 12 months ($)
111,039 Architecture and engineering occupations 76,180 Transportation occupations 75,853 Health diagnosing and treating practitioners and other technical occupations 74,482 Production occupations 73,233 Business and financial operations occupations 69,630 Sales and related occupations
Companies with federal contracts located in this zip code:
PIERCE, JAMES A (14763 CR 424, LOT 410 in LINDALE, TX; small business) in 3 contracts in 2005
$5,475 with U.S. Army Corps of Engineers - civil program financing only for Operation of Government-Owned Facilities -- Recreation Facilities (Non-Building). Taking place in NM. Signed on 2005-06-09. Completion date: 2005-09-30.
with Army for Operation of Government-Owned Facilities -- Recreation Facilities (Non-Building). Taking place in NM. Signed on 2005-06-09. Completion date: 2005-09-30.
, same as above. Signed on 2005-10-17. Completion date: 2005-10-14.
PRAISE MINISTRIES (15762 COUNTY RD 440 in LINDALE, TX; small business)
$3,500 with Army for Chaplain Services. Taking place in KS. Signed on 2004-05-17. Completion date: 2004-05-14.
Top industries in this zip code by the number of employees in 2005:
Accommodation and Food Services: Limited-Service Restaurants (100-249 employees: 1 establishment, 20-49 employees: 3 establishments, 10-19 employees: 5 establishments, 1-4 employees: 1 establishment)Other Services (except Public Administration): Religious Organizations (100-249: 1, 20-49: 2, 10-19: 4, 5-9: 5, 1-4: 7)Health Care and Social Assistance: Nursing Care Facilities (50-99: 4)Health Care and Social Assistance: Emergency and Other Relief Services (100-249: 1)Other Services (except Public Administration): Civic and Social Organizations (100-249: 1)Accommodation and Food Services: Full-Service Restaurants (20-49: 2, 10-19: 1, 5-9: 1, 1-4: 2)Health Care and Social Assistance: Residential Mental Retardation Facilities (50-99: 1, 5-9: 1)Administrative and Support and Waste Management and Remediation Services: Materials Recovery Facilities (50-99: 1)Finance and Insurance: Commercial Banking (10-19: 2, 5-9: 3, 1-4: 3)
People in group quarters in 2010:
110 people in nursing facilities/skilled-nursing facilities
83 people in college/university student housing
36 people in group homes intended for adults
7 people in workers' group living quarters and job corps centers
People in group quarters in 2000:
505 people in college dormitories (includes college quarters off campus)
451 people in job corps and vocational training facilities
133 people in nursing homes
8 people in homes for the mentally retarded
4 people in other group homes
2 people in unknown juvenile institutions
Fatal accident statistics in 2014:
Fatal accident count: 3Vehicles involved in fatal accidents: 4Fatal accidents caused by drunken drivers: 1Fatalities: 3Persons involved in fatal accidents: 5Pedestrians involved in fatal accidents: 0
Fatal accident statistics in 2013:
Fatal accident count: 2Vehicles involved in fatal accidents: 2Fatal accidents caused by drunken drivers: 0Fatalities: 2Persons involved in fatal accidents: 7Pedestrians involved in fatal accidents: 1
Home Mortgage Disclosure Act Aggregated Statistics For Year 2009(Based on 6 partial tracts) A) FHA, FSA/RHS & VA B) Conventional C) Refinancings D) Home Improvement Loans F) Non-occupant Loans on G) Loans On Manufactured Number Average Value Number Average Value Number Average Value Number Average Value Number Average Value Number Average Value
LOANS ORIGINATED 122 $133,598 211 $147,180 344 $140,762 51 $41,694 86 $164,229 16 $63,341 APPLICATIONS APPROVED, NOT ACCEPTED 9 $151,632 32 $110,560 36 $129,859 3 $63,887 3 $91,877 14 $58,539 APPLICATIONS DENIED 17 $107,432 81 $103,597 137 $139,643 26 $34,635 17 $87,338 45 $46,018 APPLICATIONS WITHDRAWN 28 $111,033 36 $118,366 98 $141,161 7 $48,909 13 $102,432 7 $76,220 FILES CLOSED FOR INCOMPLETENESS 0 $0 6 $166,238 10 $135,326 1 $35,370 0 $0 0 $0
Aggregated Statistics For Year 2008(Based on 6 partial tracts) A) FHA, FSA/RHS & VA B) Conventional C) Refinancings D) Home Improvement Loans E) Loans on Dwellings For 5+ Families F) Non-occupant Loans on G) Loans On Manufactured Number Average Value Number Average Value Number Average Value Number Average Value Number Average Value Number Average Value Number Average Value
LOANS ORIGINATED 90 $118,978 292 $135,572 206 $124,449 92 $48,383 4 $258,188 98 $110,647 28 $56,824 APPLICATIONS APPROVED, NOT ACCEPTED 7 $63,494 32 $74,341 34 $150,346 11 $35,340 0 $0 6 $139,915 23 $52,977 APPLICATIONS DENIED 12 $95,006 78 $93,827 115 $121,492 67 $24,202 0 $0 12 $71,250 50 $50,853 APPLICATIONS WITHDRAWN 6 $144,397 29 $131,589 61 $148,390 6 $33,500 0 $0 5 $127,820 3 $62,037 FILES CLOSED FOR INCOMPLETENESS 1 $225,110 9 $152,649 10 $129,714 3 $40,423 0 $0 1 $258,710 0 $0
Aggregated Statistics For Year 2007(Based on 6 partial tracts) A) FHA, FSA/RHS & VA B) Conventional C) Refinancings D) Home Improvement Loans E) Loans on Dwellings For 5+ Families F) Non-occupant Loans on G) Loans On Manufactured Number Average Value Number Average Value Number Average Value Number Average Value Number Average Value Number Average Value Number Average Value
LOANS ORIGINATED 66 $131,285 443 $122,926 257 $124,947 91 $44,384 1 $1,610,060 122 $124,975 45 $59,498 APPLICATIONS APPROVED, NOT ACCEPTED 8 $87,834 80 $85,052 29 $169,165 26 $50,634 0 $0 14 $89,573 33 $54,035 APPLICATIONS DENIED 12 $108,887 111 $91,303 175 $119,712 70 $30,541 0 $0 31 $110,772 65 $53,598 APPLICATIONS WITHDRAWN 6 $110,385 36 $105,608 96 $126,584 4 $45,765 0 $0 7 $120,550 8 $86,000 FILES CLOSED FOR INCOMPLETENESS 0 $0 10 $100,386 34 $157,709 5 $53,608 0 $0 4 $52,928 1 $52,180
Aggregated Statistics For Year 2006(Based on 6 partial tracts) A) FHA, FSA/RHS & VA B) Conventional C) Refinancings D) Home Improvement Loans F) Non-occupant Loans on G) Loans On Manufactured Number Average Value Number Average Value Number Average Value Number Average Value Number Average Value Number Average Value
LOANS ORIGINATED 76 $108,143 659 $111,743 222 $118,522 86 $35,890 137 $107,753 63 $64,186 APPLICATIONS APPROVED, NOT ACCEPTED 7 $125,903 90 $101,095 38 $105,408 17 $43,971 6 $48,452 43 $52,849 APPLICATIONS DENIED 7 $76,676 147 $65,776 165 $120,872 53 $39,602 23 $86,562 81 $45,915 APPLICATIONS WITHDRAWN 4 $136,800 69 $101,821 120 $127,245 9 $36,678 14 $66,193 7 $48,853 FILES CLOSED FOR INCOMPLETENESS 1 $93,920 16 $117,887 22 $116,665 0 $0 4 $73,050 3 $51,183
Aggregated Statistics For Year 2005(Based on 6 partial tracts) A) FHA, FSA/RHS & VA B) Conventional C) Refinancings D) Home Improvement Loans E) Loans on Dwellings For 5+ Families F) Non-occupant Loans on G) Loans On Manufactured Number Average Value Number Average Value Number Average Value Number Average Value Number Average Value Number Average Value Number Average Value
LOANS ORIGINATED 58 $104,694 639 $103,107 301 $111,159 100 $50,616 0 $0 138 $98,708 71 $58,854 APPLICATIONS APPROVED, NOT ACCEPTED 2 $76,865 102 $80,199 51 $97,553 21 $45,450 0 $0 14 $77,545 49 $50,696 APPLICATIONS DENIED 8 $83,370 217 $73,381 239 $99,653 51 $32,075 0 $0 32 $117,314 126 $45,332 APPLICATIONS WITHDRAWN 5 $86,972 93 $96,887 205 $117,314 15 $130,052 1 $1,510,180 14 $110,694 14 $73,576 FILES CLOSED FOR INCOMPLETENESS 1 $129,700 20 $92,409 65 $124,816 1 $290,040 0 $0 5 $115,240 0 $0
Aggregated Statistics For Year 2004(Based on 6 partial tracts) A) FHA, FSA/RHS & VA B) Conventional C) Refinancings D) Home Improvement Loans F) Non-occupant Loans on G) Loans On Manufactured Number Average Value Number Average Value Number Average Value Number Average Value Number Average Value Number Average Value
LOANS ORIGINATED 65 $97,867 517 $94,309 371 $103,074 102 $45,779 129 $84,963 67 $54,894 APPLICATIONS APPROVED, NOT ACCEPTED 1 $46,490 71 $82,086 58 $89,547 19 $34,567 8 $112,831 33 $45,653 APPLICATIONS DENIED 6 $81,750 110 $75,694 263 $88,531 76 $35,351 15 $74,651 77 $43,592 APPLICATIONS WITHDRAWN 10 $104,789 50 $97,229 157 $103,520 15 $66,055 10 $114,601 13 $94,035 FILES CLOSED FOR INCOMPLETENESS 1 $96,900 24 $89,865 78 $105,086 5 $112,354 3 $78,157 3 $54,233
Aggregated Statistics For Year 2003(Based on 6 partial tracts) A) FHA, FSA/RHS & VA B) Conventional C) Refinancings D) Home Improvement Loans F) Non-occupant Loans on Number Average Value Number Average Value Number Average Value Number Average Value Number Average Value
LOANS ORIGINATED 91 $95,347 394 $96,134 679 $93,984 97 $30,711 100 $75,802 APPLICATIONS APPROVED, NOT ACCEPTED 5 $49,472 42 $76,811 58 $97,257 19 $34,881 8 $55,579 APPLICATIONS DENIED 12 $107,418 111 $50,482 254 $84,546 46 $34,813 25 $90,174 APPLICATIONS WITHDRAWN 19 $94,171 43 $98,067 210 $103,647 6 $125,787 15 $95,511 FILES CLOSED FOR INCOMPLETENESS 4 $99,318 14 $98,361 21 $108,421 3 $58,533 3 $71,560
Aggregated Statistics For Year 2002(Based on 4 partial tracts) A) FHA, FSA/RHS & VA B) Conventional C) Refinancings D) Home Improvement Loans E) Loans on Dwellings For 5+ Families F) Non-occupant Loans on Number Average Value Number Average Value Number Average Value Number Average Value Number Average Value Number Average Value
LOANS ORIGINATED 86 $93,845 331 $92,521 421 $92,598 129 $28,144 1 $782,200 83 $66,015 APPLICATIONS APPROVED, NOT ACCEPTED 4 $85,372 42 $77,435 50 $60,489 16 $22,231 1 $155,040 9 $54,890 APPLICATIONS DENIED 5 $73,588 146 $53,627 115 $66,895 39 $21,352 0 $0 11 $96,815 APPLICATIONS WITHDRAWN 10 $85,935 29 $92,586 105 $78,581 4 $33,858 0 $0 5 $93,070 FILES CLOSED FOR INCOMPLETENESS 0 $0 12 $80,619 16 $80,364 0 $0 0 $0 1 $64,100
Aggregated Statistics For Year 2001(Based on 4 partial tracts) A) FHA, FSA/RHS & VA B) Conventional C) Refinancings D) Home Improvement Loans E) Loans on Dwellings For 5+ Families F) Non-occupant Loans on Number Average Value Number Average Value Number Average Value Number Average Value Number Average Value Number Average Value
LOANS ORIGINATED 101 $85,659 387 $86,740 246 $84,678 115 $19,692 3 $100,877 77 $69,287 APPLICATIONS APPROVED, NOT ACCEPTED 3 $98,890 61 $55,364 48 $51,951 13 $51,937 0 $0 9 $47,697 APPLICATIONS DENIED 5 $81,668 231 $48,960 101 $71,018 19 $22,570 1 $1,086,790 29 $44,315 APPLICATIONS WITHDRAWN 8 $95,839 34 $91,041 87 $79,212 13 $10,598 0 $0 6 $71,468 FILES CLOSED FOR INCOMPLETENESS 0 $0 7 $98,550 11 $100,519 1 $17,890 0 $0 0 $0
Aggregated Statistics For Year 2000(Based on 4 partial tracts) A) FHA, FSA/RHS & VA B) Conventional C) Refinancings D) Home Improvement Loans F) Non-occupant Loans on Number Average Value Number Average Value Number Average Value Number Average Value Number Average Value
LOANS ORIGINATED 66 $87,709 359 $70,801 79 $69,322 81 $20,828 48 $54,963 APPLICATIONS APPROVED, NOT ACCEPTED 7 $61,349 71 $56,154 18 $65,263 16 $42,011 4 $30,118 APPLICATIONS DENIED 8 $63,178 289 $39,977 47 $53,599 20 $13,857 5 $32,296 APPLICATIONS WITHDRAWN 13 $82,850 27 $102,970 50 $62,060 4 $20,150 6 $104,938 FILES CLOSED FOR INCOMPLETENESS 1 $131,190 7 $71,049 24 $71,859 0 $0 1 $59,630
Aggregated Statistics For Year 1999(Based on 3 partial tracts) A) FHA, FSA/RHS & VA B) Conventional C) Refinancings D) Home Improvement Loans E) Loans on Dwellings For 5+ Families F) Non-occupant Loans on Number Average Value Number Average Value Number Average Value Number Average Value Number Average Value Number Average Value
LOANS ORIGINATED 38 $81,353 188 $70,069 79 $76,082 40 $20,112 0 $0 23 $61,885 APPLICATIONS APPROVED, NOT ACCEPTED 0 $0 55 $45,589 20 $59,732 6 $7,453 0 $0 3 $51,790 APPLICATIONS DENIED 2 $82,675 213 $45,785 27 $53,737 17 $12,296 1 $80,980 17 $46,239 APPLICATIONS WITHDRAWN 4 $72,662 22 $72,209 31 $75,229 4 $28,298 0 $0 2 $68,830 FILES CLOSED FOR INCOMPLETENESS 0 $0 1 $53,520 10 $61,554 0 $0 0 $0 0 $0
Detailed HMDA statistics for the following Tracts:
0014.01
,
0014.02 ,
0015.00
Private Mortgage Insurance Companies Aggregated Statistics For Year 2009(Based on 6 partial tracts) A) Conventional B) Refinancings C) Non-occupant Loans on Number Average Value Number Average Value Number Average Value
LOANS ORIGINATED 21 $177,441 12 $139,502 1 $56,590 APPLICATIONS APPROVED, NOT ACCEPTED 4 $133,665 6 $236,400 0 $0 APPLICATIONS DENIED 6 $145,927 1 $241,510 0 $0 APPLICATIONS WITHDRAWN 5 $110,778 3 $130,197 0 $0 FILES CLOSED FOR INCOMPLETENESS 0 $0 0 $0 0 $0
Aggregated Statistics For Year 2008(Based on 6 partial tracts) A) Conventional B) Refinancings C) Non-occupant Loans on Number Average Value Number Average Value Number Average Value
LOANS ORIGINATED 68 $154,158 14 $181,593 8 $142,409 APPLICATIONS APPROVED, NOT ACCEPTED 17 $153,173 10 $180,603 1 $123,740 APPLICATIONS DENIED 5 $119,452 0 $0 3 $97,387 APPLICATIONS WITHDRAWN 5 $156,600 1 $477,060 1 $149,570 FILES CLOSED FOR INCOMPLETENESS 1 $142,490 0 $0 1 $142,490
Aggregated Statistics For Year 2007(Based on 6 partial tracts) A) Conventional B) Refinancings C) Non-occupant Loans on D) Loans On Manufactured Number Average Value Number Average Value Number Average Value Number Average Value
LOANS ORIGINATED 109 $136,438 18 $191,705 16 $120,802 1 $89,450 APPLICATIONS APPROVED, NOT ACCEPTED 18 $150,629 8 $176,166 2 $75,160 1 $177,410 APPLICATIONS DENIED 2 $240,525 1 $406,990 0 $0 0 $0 APPLICATIONS WITHDRAWN 2 $135,110 0 $0 0 $0 0 $0 FILES CLOSED FOR INCOMPLETENESS 0 $0 0 $0 0 $0 0 $0
Aggregated Statistics For Year 2006(Based on 6 partial tracts) A) Conventional B) Refinancings C) Non-occupant Loans on D) Loans On Manufactured Number Average Value Number Average Value Number Average Value Number Average Value
LOANS ORIGINATED 90 $112,304 12 $192,355 13 $76,285 5 $81,816 APPLICATIONS APPROVED, NOT ACCEPTED 14 $148,576 5 $245,200 5 $50,890 0 $0 APPLICATIONS DENIED 0 $0 0 $0 0 $0 0 $0 APPLICATIONS WITHDRAWN 1 $287,450 1 $183,930 0 $0 0 $0 FILES CLOSED FOR INCOMPLETENESS 0 $0 0 $0 0 $0 0 $0
Aggregated Statistics For Year 2005(Based on 6 partial tracts) A) Conventional B) Refinancings C) Non-occupant Loans on D) Loans On Manufactured Number Average Value Number Average Value Number Average Value Number Average Value
LOANS ORIGINATED 94 $120,262 16 $158,323 11 $99,725 1 $29,310 APPLICATIONS APPROVED, NOT ACCEPTED 18 $125,948 15 $175,294 5 $115,756 0 $0 APPLICATIONS DENIED 0 $0 0 $0 0 $0 0 $0 APPLICATIONS WITHDRAWN 2 $138,660 0 $0 0 $0 0 $0 FILES CLOSED FOR INCOMPLETENESS 0 $0 0 $0 0 $0 0 $0
Aggregated Statistics For Year 2004(Based on 6 partial tracts) A) Conventional B) Refinancings C) Non-occupant Loans on D) Loans On Manufactured Number Average Value Number Average Value Number Average Value Number Average Value
LOANS ORIGINATED 88 $113,441 28 $164,588 11 $90,329 1 $105,850 APPLICATIONS APPROVED, NOT ACCEPTED 15 $137,981 20 $145,455 4 $127,358 0 $0 APPLICATIONS DENIED 2 $138,450 0 $0 1 $161,700 0 $0 APPLICATIONS WITHDRAWN 1 $186,350 2 $116,220 2 $116,220 0 $0 FILES CLOSED FOR INCOMPLETENESS 3 $89,957 0 $0 1 $147,590 0 $0
Aggregated Statistics For Year 2003(Based on 6 partial tracts) A) Conventional B) Refinancings C) Non-occupant Loans on Number Average Value Number Average Value Number Average Value
LOANS ORIGINATED 87 $114,530 49 $121,674 8 $73,662 APPLICATIONS APPROVED, NOT ACCEPTED 25 $157,045 12 $163,248 3 $68,407 APPLICATIONS DENIED 1 $116,280 1 $358,760 1 $116,280 APPLICATIONS WITHDRAWN 3 $186,847 2 $246,820 0 $0 FILES CLOSED FOR INCOMPLETENESS 0 $0 0 $0 0 $0
Aggregated Statistics For Year 2002(Based on 4 partial tracts) A) Conventional B) Refinancings C) Non-occupant Loans on Number Average Value Number Average Value Number Average Value
LOANS ORIGINATED 64 $114,636 26 $142,205 6 $93,723 APPLICATIONS APPROVED, NOT ACCEPTED 12 $124,307 8 $99,359 0 $0 APPLICATIONS DENIED 0 $0 0 $0 0 $0 APPLICATIONS WITHDRAWN 2 $144,010 3 $111,810 0 $0 FILES CLOSED FOR INCOMPLETENESS 0 $0 0 $0 0 $0
Aggregated Statistics For Year 2001(Based on 4 partial tracts) A) Conventional B) Refinancings C) Non-occupant Loans on Number Average Value Number Average Value Number Average Value
LOANS ORIGINATED 85 $98,710 17 $159,845 10 $65,267 APPLICATIONS APPROVED, NOT ACCEPTED 6 $77,135 10 $203,976 0 $0 APPLICATIONS DENIED 0 $0 0 $0 0 $0 APPLICATIONS WITHDRAWN 0 $0 6 $114,232 0 $0 FILES CLOSED FOR INCOMPLETENESS 1 $84,980 0 $0 1 $84,980
Aggregated Statistics For Year 1999(Based on 3 partial tracts) A) Conventional B) Refinancings C) Non-occupant Loans on Number Average Value Number Average Value Number Average Value
LOANS ORIGINATED 43 $89,338 9 $122,149 4 $81,018 APPLICATIONS APPROVED, NOT ACCEPTED 6 $83,588 3 $97,123 1 $57,190 APPLICATIONS DENIED 3 $72,467 1 $145,230 1 $34,200 APPLICATIONS WITHDRAWN 1 $108,540 1 $43,520 0 $0 FILES CLOSED FOR INCOMPLETENESS 1 $125,800 0 $0 0 $0
Detailed PMIC statistics for the following Tracts:
0014.01
,
0014.02 ,
0015.00
2003 - 2018 National Fire Incident Reporting System (NFIRS) incidents See full 2006 National Fire Incident Reporting System statistics for zip code 75771, Texas
Most common first names in zip code 75771 among deceased individuals Name Count Lived (average)
James 91 73.4 years John 91 74.8 years Mary 82 79.7 years William 76 75.3 years Robert 73 70.4 years Charles 48 71.8 years Willie 35 76.5 years George 33 77.1 years Henry 31 77.9 years Ruby 29 77.0 years
Most common last names in zip code 75771 among deceased individuals Last name Count Lived (average)
Smith 58 77.9 years Johnson 40 78.7 years Williams 35 76.9 years Jones 25 77.0 years Brown 25 75.3 years Morris 22 77.3 years Taylor 21 76.7 years Wells 20 79.7 years Kennedy 20 74.7 years Moore 20 80.2 years
Businesses in zip code 75771
Name Count Name Count
AT&T 1 La Quinta 1 AutoZone 1 Long John Silver's 1 Best Western 1 Lowe's 1 Burger King 1 MasterBrand Cabinets 1 Dairy Queen 1 McDonald's 1 Days Inn 1 Pizza Hut 1 Decora Cabinetry 1 SONIC Drive-In 1 Domino's Pizza 1 Subway 2 FedEx 3 Taco Bell 1 H&R Block 1 U-Haul 2 Hilton 1 UPS 2 Jones New York 1 Walmart 1 KFC 1

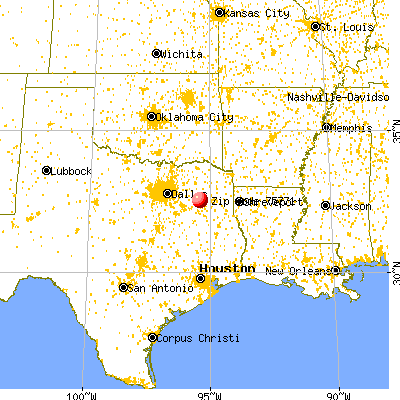


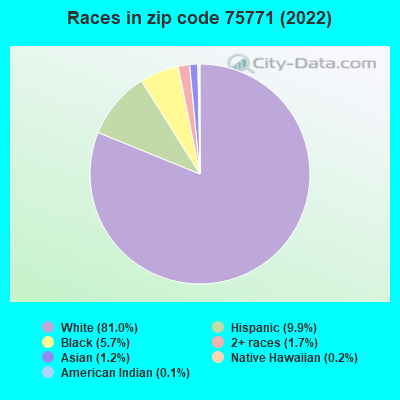


 Nearest zip codes: 75704, 75773, 75706, 75790, 75702, 75765.
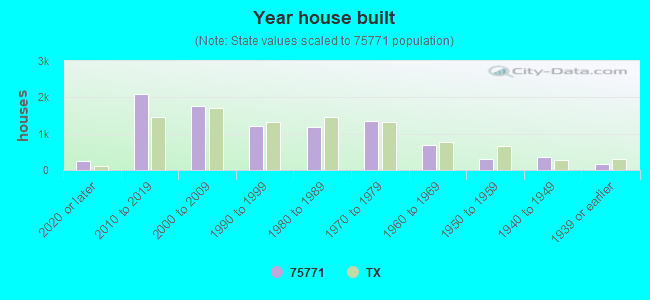


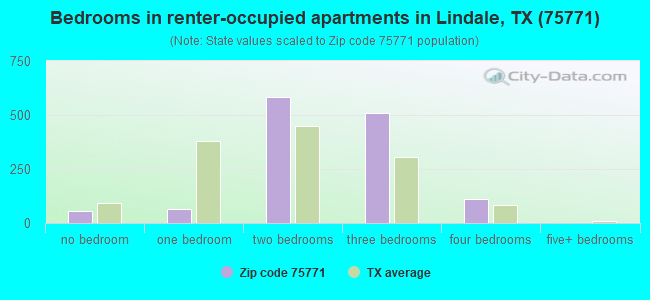
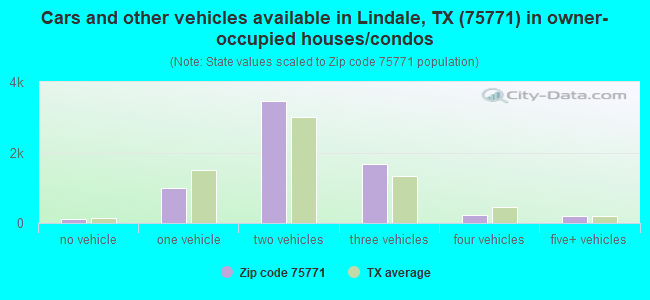
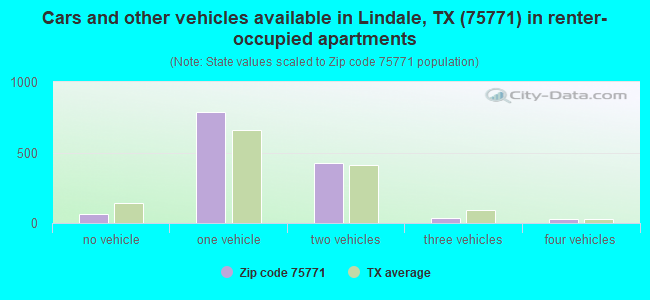


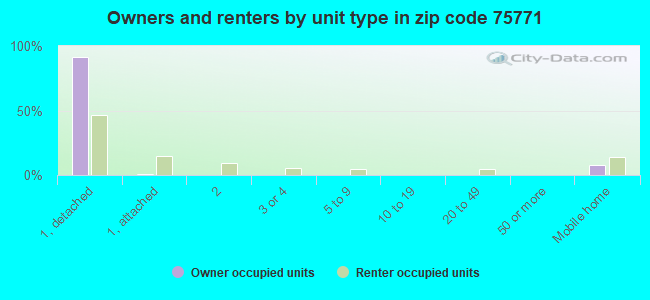


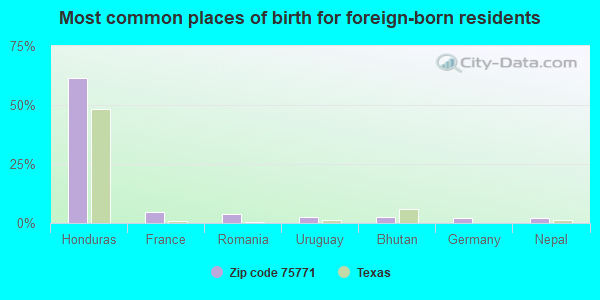
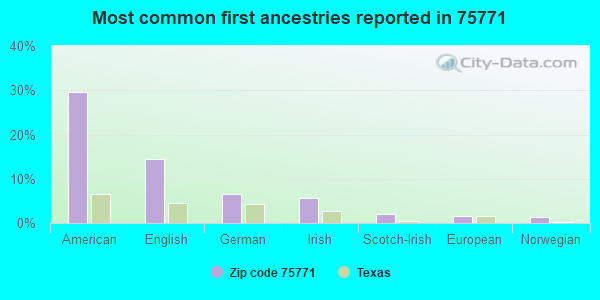
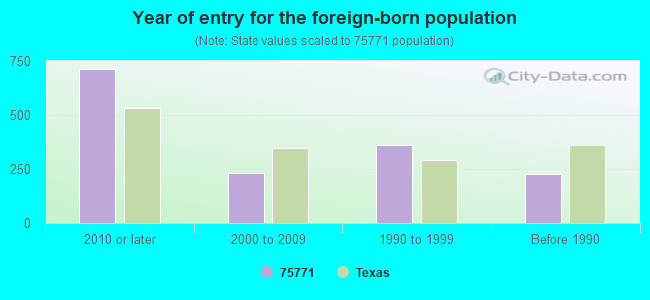


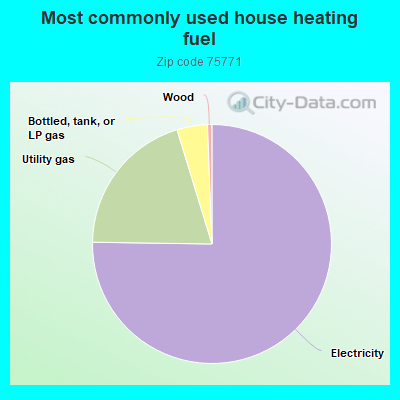
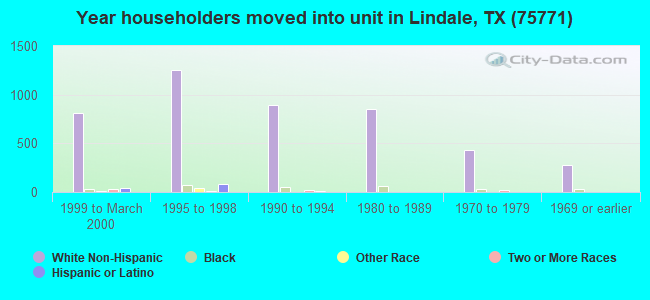
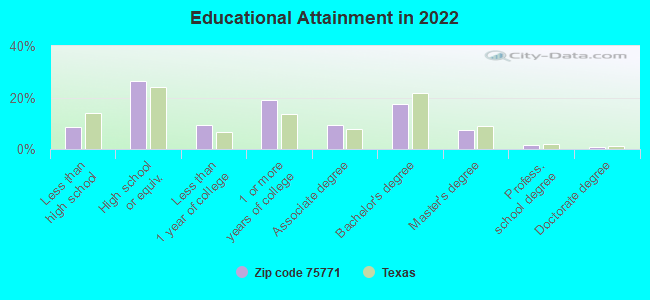
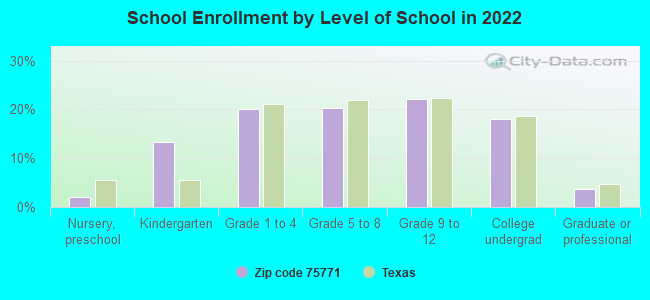
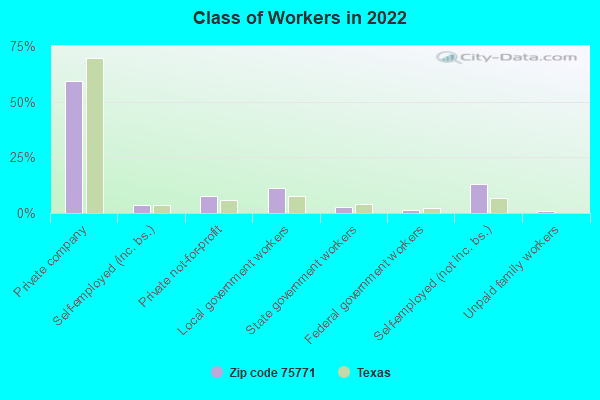

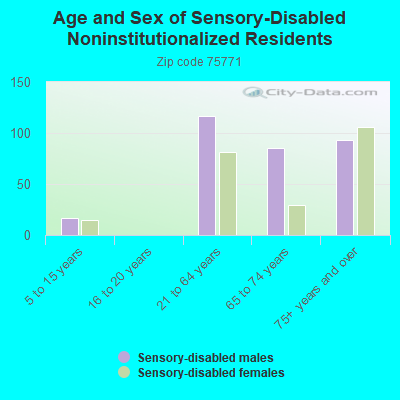
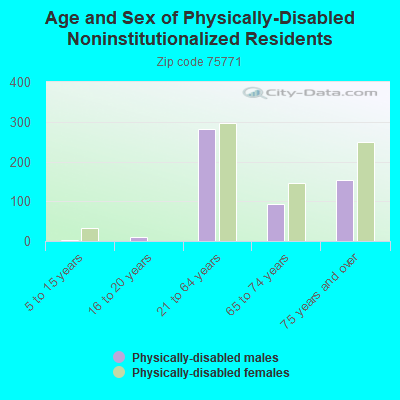
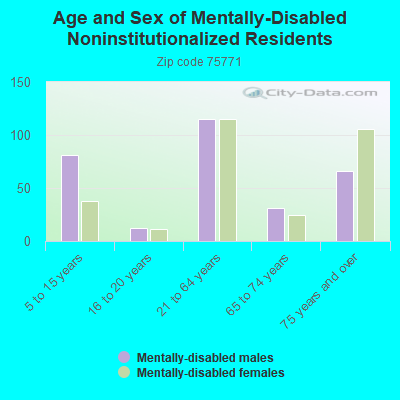
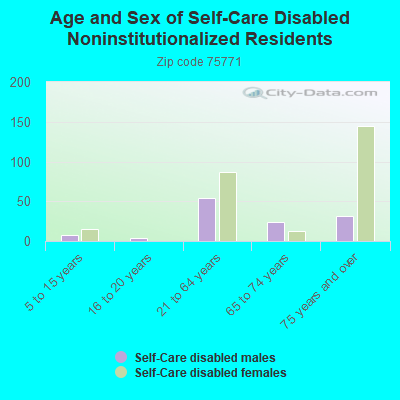
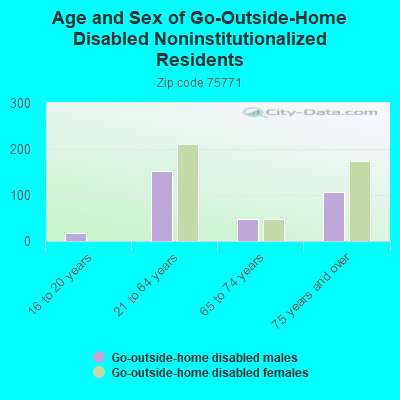
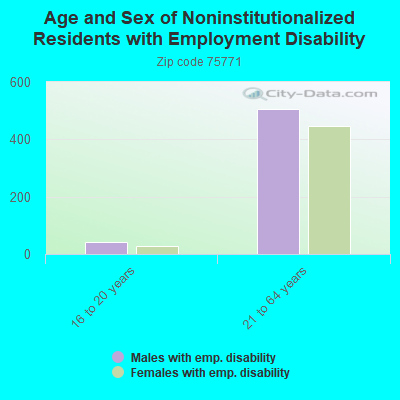
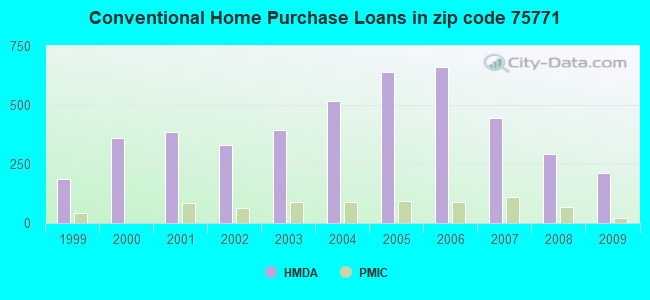
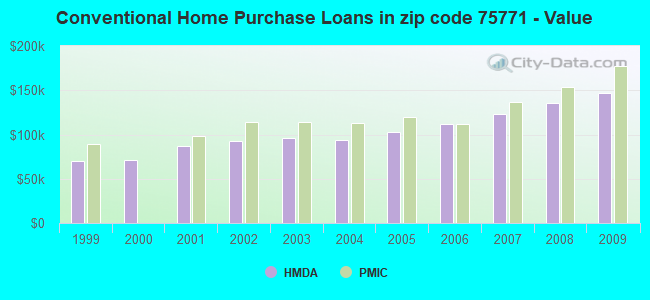
 According to the data from the years 2003 - 2018 the average number of fire incidents per year is 187. The highest number of reported fire incidents - 323 took place in 2005, and the least - 61 in 2003. The data has a rising trend.
 When looking into fire subcategories, the most incidents belonged to: Outside Fires (58.8%), and Structure Fires (25.0%).