Estimated zip code population in 2022: 7,660 Zip code population in 2010: 5,783 Zip code population in 2000: 5,417
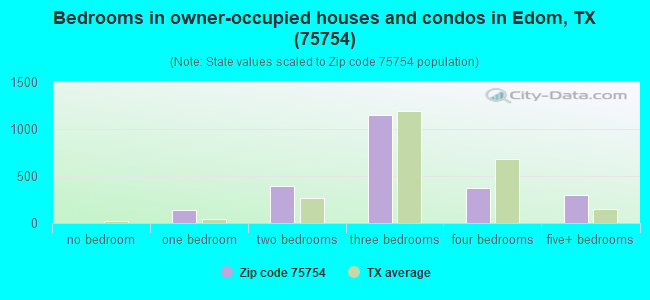
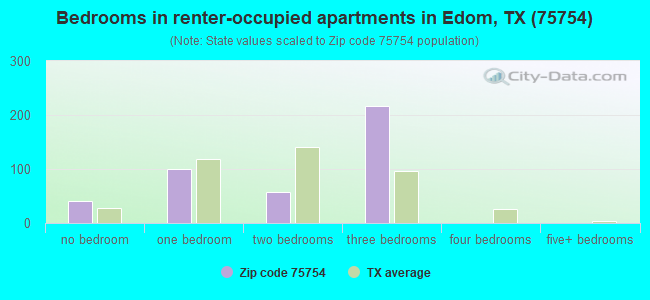
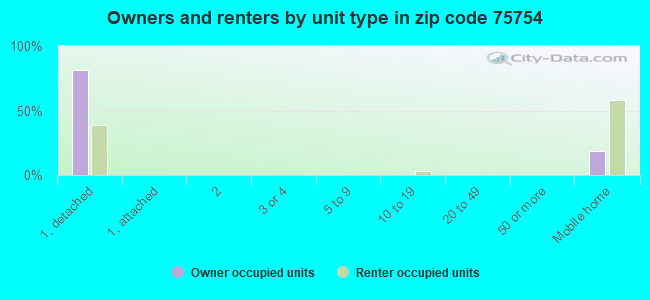
Houses and condos: 3,078 Renter-occupied apartments: 414
% of renters here:
15%
State:
38%
March 2022 cost of living index in zip code 75754: 79.6 (low, U.S. average is 100)
Land area: 124.2 sq. mi. Water area: 2.0 sq. mi.
Population density: 62 people per square mile
(very low).
OSM Map
General Map
Google Map
MSN Map
OSM Map
General Map
Google Map
MSN Map
OSM Map
General Map
Google Map
MSN Map
OSM Map
General Map
Google Map
MSN Map
Please wait while loading the map...
Real estate property taxes paid for housing units in 2022:
This zip code:
1.0% ($2,530)
Texas:
1.5% ($4,050)
Median real estate property taxes paid for housing units with mortgages in 2022: $3,460 (1.0%) Median real estate property taxes paid for housing units with no mortgage in 2022: $1,869 (0.9%)
Averages for the 2020 tax year for zip code 75754, filed in 2021:
Average Adjusted Gross Income (AGI) in 2020: $62,659 (Individual Income Tax Returns)
Here:
$62,659
State:
$77,054
Salary/wage: $48,689 (reported on 79.5% of returns)
Here:
$48,689
State:
$62,766
(% of AGI for various income ranges: 1186.1% for AGIs below $25k, 3504.8% for AGIs $25k-50k, 6343.8% for AGIs $50k-75k, 8612.5% for AGIs $75k-100k, 15207.1% for AGIs $100k-200k)
Taxable interest for individuals: $2,204 (reported on 25.2% of returns)
This zip code:
$2,204
Texas:
$2,665
(% of AGI for various income ranges: 15.9% for AGIs below $25k, 21.6% for AGIs $25k-50k, 83.8% for AGIs $50k-75k, 55.5% for AGIs $75k-100k, 146.7% for AGIs $100k-200k)
Ordinary dividends: $5,169 (reported on 11.5% of returns)
Here:
$5,169
State:
$10,044
(% of AGI for various income ranges: 9.7% for AGIs below $25k, 13.9% for AGIs $25k-50k, 63.1% for AGIs $50k-75k, 98.5% for AGIs $75k-100k, 205.2% for AGIs $100k-200k)
Net capital gain/loss in AGI: +$19,735 (reported on 13.3% of returns)
Here:
+$19,735
State:
+$39,590
(% of AGI for various income ranges: 12.3% for AGIs below $25k, 25.0% for AGIs $25k-50k, 115.8% for AGIs $50k-75k, 198.5% for AGIs $75k-100k, 1167.6% for AGIs $100k-200k)
Profit/loss from business: +$10,073 (reported on 22.3% of returns)
Here:
+$10,073
State:
+$10,888
(% of AGI for various income ranges: 180.0% for AGIs below $25k, 302.3% for AGIs $25k-50k, 293.5% for AGIs $50k-75k, 361.5% for AGIs $75k-100k, 825.7% for AGIs $100k-200k)
Taxable individual retirement arrangement distribution: $17,462 (reported on 8.6% of returns)
75754:
$17,462
Texas:
$24,740
(% of AGI for various income ranges: 54.2% for AGIs below $25k, 113.4% for AGIs $25k-50k, 231.5% for AGIs $50k-75k, 252.5% for AGIs $75k-100k, 975.2% for AGIs $100k-200k)
Total itemized deductions: $40,215 (reported on 4.7% of returns)
Here:
$40,215
State:
$40,428
(% of AGI for various income ranges: 125.5% for AGIs $25k-50k, 343.5% for AGIs $50k-75k, 615.7% for AGIs $100k-200k)
Charity contributions: $16,170 (reported on 3.6% of returns)
Here:
$16,170
State:
$18,201
(% of AGI for various income ranges: 21.2% for AGIs below $25k, 81.5% for AGIs $50k-75k, 217.1% for AGIs $100k-200k)
Taxes paid: $7,145 (reported on 4.0% of returns)
75754:
$7,145
State:
$7,821
(% of AGI for various income ranges: 17.6% for AGIs below $25k, 68.8% for AGIs $50k-75k, 98.1% for AGIs $100k-200k)
Earned income credit: $2,385 (reported on 19.4% of returns)
Here:
$2,385
State:
$2,584
(% of AGI for various income ranges: 111.2% for AGIs below $25k, 83.0% for AGIs $25k-50k)
Percentage of individuals using paid preparers for their 2020 taxes: 93.2%
Here:
93%
State:
92%
(% for various income ranges: 92.2% for AGIs below $25k, 93.1% for AGIs $25k-50k, 94.6% for AGIs $50k-75k, 96.2% for AGIs $75k-100k, 91.2% for AGIs $100k-200k, 100.0% for AGIs over 200k)
Averages for the 2012 tax year for zip code 75754, filed in 2013:
Average Adjusted Gross Income (AGI) in 2012: $52,233 (Individual Income Tax Returns)
Here:
$52,233
State:
$65,384
Salary/wage: $45,319 (reported on 82.0% of returns)
Here:
$45,319
State:
$52,524
(% of AGI for various income ranges: 75.6% for AGIs below $25k, 75.8% for AGIs $25k-50k, 81.3% for AGIs $50k-75k, 85.7% for AGIs $75k-100k, 77.9% for AGIs $100k-200k, 41.7% for AGIs over 200k)
Taxable interest for individuals: $1,790 (reported on 26.2% of returns)
This zip code:
$1,790
Texas:
$2,372
(% of AGI for various income ranges: 1.3% for AGIs below $25k, 1.0% for AGIs $25k-50k, 0.5% for AGIs $50k-75k, 0.5% for AGIs $75k-100k, 0.8% for AGIs $100k-200k, 1.2% for AGIs over 200k)
Ordinary dividends: $2,986 (reported on 12.0% of returns)
Here:
$2,986
State:
$9,721
(% of AGI for various income ranges: 0.9% for AGIs below $25k, 0.7% for AGIs $25k-50k, 0.3% for AGIs $50k-75k, 0.4% for AGIs $75k-100k, 1.9% for AGIs $100k-200k)
Net capital gain/loss in AGI: +$27,046 (reported on 11.2% of returns)
Here:
+$27,046
State:
+$35,319
(% of AGI for various income ranges: 0.1% for AGIs $25k-50k, 0.2% for AGIs $50k-75k, 1.1% for AGIs $75k-100k, 2.4% for AGIs $100k-200k, 23.6% for AGIs over 200k)
Profit/loss from business: +$8,047 (reported on 21.9% of returns)
Here:
+$8,047
State:
+$13,732
(% of AGI for various income ranges: 10.8% for AGIs below $25k, 5.3% for AGIs $25k-50k, 3.0% for AGIs $50k-75k, 3.2% for AGIs $75k-100k, 1.8% for AGIs $100k-200k)
Taxable individual retirement arrangement distribution: $15,276 (reported on 9.0% of returns)
75754:
$15,276
Texas:
$19,511
(% of AGI for various income ranges: 3.0% for AGIs below $25k, 2.4% for AGIs $25k-50k, 3.3% for AGIs $50k-75k, 2.4% for AGIs $75k-100k, 5.3% for AGIs $100k-200k)
Total itemized deductions: $20,349 (18% of AGI, reported on 19.3% of returns)
Here:
$20,349
State:
$24,724
Here:
18.1% of AGI
State:
15.9% of AGI
(% of AGI for various income ranges: 6.0% for AGIs below $25k, 7.9% for AGIs $25k-50k, 8.2% for AGIs $50k-75k, 8.0% for AGIs $75k-100k, 11.3% for AGIs $100k-200k, 3.8% for AGIs over 200k)
Charity contributions: $5,369 (reported on 13.7% of returns)
Here:
$5,369
State:
$6,808
(% of AGI for various income ranges: 0.6% for AGIs below $25k, 1.2% for AGIs $25k-50k, 1.0% for AGIs $50k-75k, 1.4% for AGIs $75k-100k, 2.2% for AGIs $100k-200k, 1.7% for AGIs over 200k)
Taxes paid: $4,047 (reported on 18.5% of returns)
75754:
$4,047
State:
$6,921
(% of AGI for various income ranges: 1.1% for AGIs below $25k, 1.3% for AGIs $25k-50k, 1.3% for AGIs $50k-75k, 1.5% for AGIs $75k-100k, 2.3% for AGIs $100k-200k, 1.0% for AGIs over 200k)
Earned income credit: $2,320 (reported on 23.2% of returns)
Here:
$2,320
State:
$2,570
(% of AGI for various income ranges: 8.0% for AGIs below $25k, 1.2% for AGIs $25k-50k)
Percentage of individuals using paid preparers for their 2012 taxes: 60.9%
Here:
61%
State:
51%
(% for various income ranges: 54.6% for AGIs below $25k, 62.9% for AGIs $25k-50k, 68.8% for AGIs $50k-75k, 57.1% for AGIs $75k-100k, 76.5% for AGIs $100k-200k, 75.0% for AGIs over 200k)
Averages for the 2004 tax year for zip code 75754, filed in 2005:
Average Adjusted Gross Income (AGI) in 2004: $36,018 (Individual Income Tax Returns)
Here:
$36,018
State:
$47,881
Salary/wage: $31,756 (reported on 80.6% of returns)
Here:
$31,756
State:
$41,947
(% of AGI for various income ranges: 80.3% for AGIs below $10k, 75.8% for AGIs $10k-25k, 80.3% for AGIs $25k-50k, 79.6% for AGIs $50k-75k, 74.0% for AGIs $75k-100k, 45.4% for AGIs over 100k)
Taxable interest for individuals: $1,947 (reported on 33.7% of returns)
This zip code:
$1,947
Texas:
$2,255
(% of AGI for various income ranges: 7.6% for AGIs below $10k, 2.5% for AGIs $10k-25k, 1.1% for AGIs $25k-50k, 1.2% for AGIs $50k-75k, 3.2% for AGIs $75k-100k, 1.6% for AGIs over 100k)
Taxable dividends: $1,782 (reported on 14.1% of returns)
Here:
$1,782
State:
$4,261
(% of AGI for various income ranges: 1.6% for AGIs below $10k, 0.7% for AGIs $10k-25k, 0.9% for AGIs $25k-50k, 0.3% for AGIs $50k-75k, 0.1% for AGIs $75k-100k, 1.1% for AGIs over 100k)
Net capital gain/loss: +$6,435 (reported on 13.4% of returns)
Here:
+$6,435
State:
+$16,110
(% of AGI for various income ranges: 3.4% for AGIs below $10k, 0.9% for AGIs $10k-25k, 0.5% for AGIs $25k-50k, 0.9% for AGIs $50k-75k, 4.4% for AGIs $75k-100k, 6.1% for AGIs over 100k)
Profit/loss from business: +$7,000 (reported on 22.0% of returns)
Here:
+$7,000
State:
+$11,013
(% of AGI for various income ranges: 11.1% for AGIs below $10k, 7.6% for AGIs $10k-25k, 4.8% for AGIs $25k-50k, 3.0% for AGIs $50k-75k, 0.4% for AGIs $75k-100k, 4.0% for AGIs over 100k)
IRA payment deduction: $2,156 (reported on 1.5% of returns)
75754:
$2,156
Texas:
$3,120
Total itemized deductions: $16,838 (23% of AGI, reported on 18.5% of returns)
Here:
$16,838
State:
$19,631
Here:
22.6% of AGI
State:
18.9% of AGI
(% of AGI for various income ranges: 14.2% for AGIs below $10k, 5.3% for AGIs $10k-25k, 8.3% for AGIs $25k-50k, 9.6% for AGIs $50k-75k, 13.9% for AGIs $75k-100k, 6.9% for AGIs over 100k)
Charity contributions deductions: $4,276 (5% of AGI, reported on 14.4% of returns)
Here:
$4,276
State:
$4,753
Here:
5.4% of AGI
State:
4.2% of AGI
(% of AGI for various income ranges: 1.1% for AGIs below $10k, 0.5% for AGIs $10k-25k, 1.5% for AGIs $25k-50k, 1.6% for AGIs $50k-75k, 2.8% for AGIs $75k-100k, 2.3% for AGIs over 100k)
Total tax: $4,632 (reported on 68.3% of returns)
75754:
$4,632
State:
$9,058
(% of AGI for various income ranges: 3.6% for AGIs below $10k, 3.9% for AGIs $10k-25k, 6.2% for AGIs $25k-50k, 8.7% for AGIs $50k-75k, 10.2% for AGIs $75k-100k, 14.9% for AGIs over 100k)
Earned income credit: $1,828 (reported on 23.4% of returns)
Here:
$1,828
State:
$2,024
Percentage of individuals using paid preparers for their 2004 taxes: 68.2%
Here:
68%
State:
57%
(% for various income ranges: 62.1% for AGIs below $10k, 71.4% for AGIs $10k-25k, 69.7% for AGIs $25k-50k, 64.1% for AGIs $50k-75k, 74.5% for AGIs $75k-100k, 75.7% for AGIs over 100k)
Household received Food Stamps/SNAP in the past 12 months: 224 Household did not receive Food Stamps/SNAP in the past 12 months: 2,530
Women who had a birth in the past 12 months: 151 (20 now married, 127 unmarried) Women who did not have a birth in the past 12 months: 1,150 (619 now married, 527 unmarried)
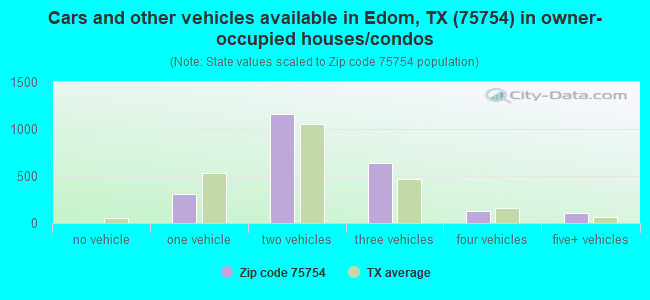
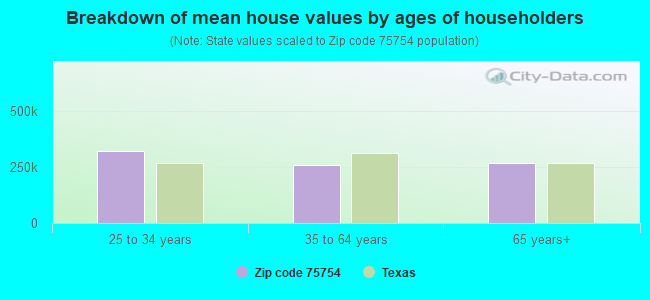
Housing units in zip code 75754 with a mortgage: 1,047 (18 second mortgage, 20 both second mortgage and home equity loan) Median monthly owner costs for units with a mortgage: $1,669 Median monthly owner costs for units without a mortgage: $592
Residents with income below the poverty level in 2022:
This zip code:
5.9%
Whole state:
14.0%
Residents with income below 50% of the poverty level in 2022:
This zip code:
3.8%
Whole state:
7.4%
Median number of rooms in houses and condos:
Here:
6.4
State:
6.3
Median number of rooms in apartments:
Here:
4.4
State:
4.0
Notable locations in this zip code not listed on our city pages
Notable locations in zip code 75754: Bear Creek Branch Library (A), South Van Zandt Volunteer Fire Department Station 2 (B), Van Zandt - Midway Volunteer Fire Department (C), Edom Volunteer Fire Department (D). Display/hide their locations on the map
Churches in zip code 75754 include: Pleasant Hill Church (A), Stanger Springs Church (B), Pleasant Hill Church (C), Bethlehem Church (D), Sexton Chapel (E), Smith Chapel (F), County-Line Church (G), Hobbs Church (H), Watts Church (I). Display/hide their locations on the map
Cemeteries: Jacob Cemetery (1), New Harmony Cemetery (2), Prairie Springs Cemetery (3), Liberty Cemetery (4), Hill Cemetery (5). Display/hide their locations on the map
Reservoirs: Rhine Lake (A), Mitchell Lake (B), Lowrie Lake (C), Hand Lake (D), Smart Lake (E), Payne Ranch Lake (F), Rhines Lake (G), Bass Lake (H). Display/hide their locations on the map
Streams, rivers, and creeks: Browning Creek (A), Bethlehem Branch (B), Turkey Creek (C), Pottawatomie Creek (D), Glade Branch (E), Sour Branch (F), Diffy Creek (G), Prairie Creek (H), Madcat Branch (I). Display/hide their locations on the map
Size of family households: 1,073 2-persons, 299 3-persons, 394 4-persons, 242 5-persons, 40 6-persons, 57 7-or-more-persons
Size of nonfamily households: 528 1-person, 93 2-persons, 23 3-persons
792 married couples with children.
377 single-parent households (14 men, 363 women).
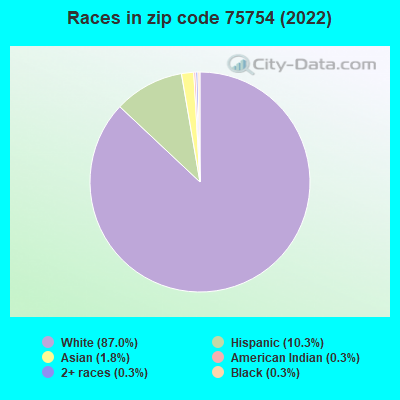
93.9% of residents of 75754 zip code speak English at home.
5.2% of residents speak Spanish at home (66% very well, 2% well, 8% not well, 23% not at all).
1.2% of residents speak other Indo-European language at home (76% very well, 24% not well).
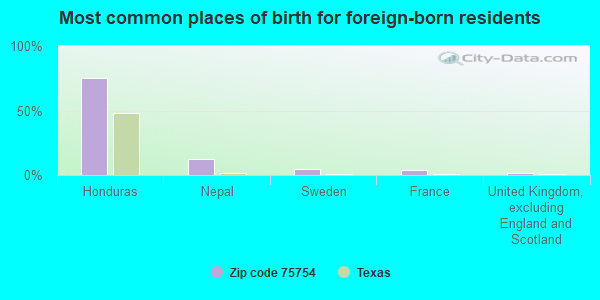
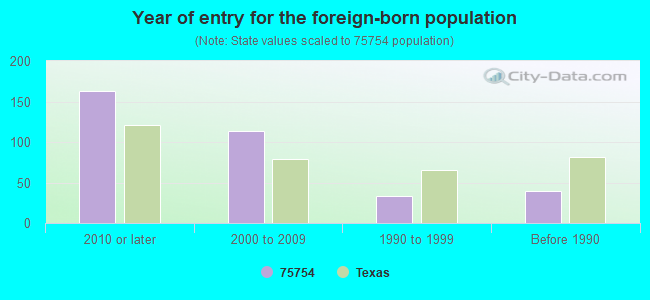
Foreign born population: 318 (4.2%) (33.5% of them are naturalized citizens)
This zip code:
4.2%
Whole state:
17.2%
75%Honduras
12%Nepal
5%Sweden
4%France
2%United Kingdom, excluding England and Scotland
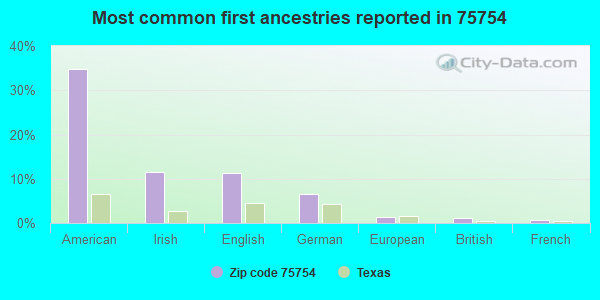
35%American
12%Irish
11%English
7%German
1%European
1%British
1%French
Year of entry for the foreign-born population
1632010 or later
1132000 to 2009
331990 to 1999
39Before 1990
Housing units lacking complete plumbing facilities: 3.8% Housing units lacking complete kitchen facilities: 4.9%
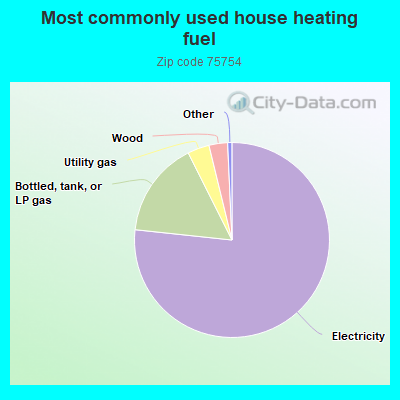
76.7%Electricity
15.9%Bottled, tank, or LP gas
3.6%Utility gas
3.1%Wood
Population in 1990: 3,992. Population change in the 1990s: +1,425 (+35.7%).
Place of birth for U.S.-born residents:
This state: 5,145
Northeast: 196
Midwest: 777
South: 810
West: 367
59% of the 75754 zip code residents lived in the same house 5 years ago. Out of people who lived in different houses, 29% lived in this county. Out of people who lived in different counties, 50% lived in Texas.
94% of the 75754 zip code residents lived in the same house 1 year ago. Out of people who lived in different houses, 22% moved from this county. Out of people who lived in different houses, 83% moved from different county within same state.
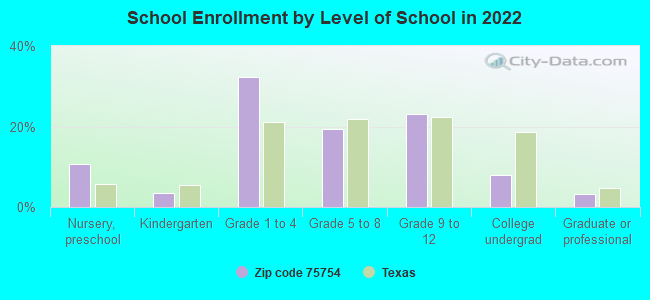
Private vs. public school enrollment:
Students in private schools in grades 1 to 8 (elementary and middle school): 42
Here:
5.3%
Texas:
8.8%
Students in private schools in grades 9 to 12 (high school): 52
Here:
14.5%
Texas:
8.0%
Students in private undergraduate colleges: 13
Here:
10.9%
Texas:
16.2%
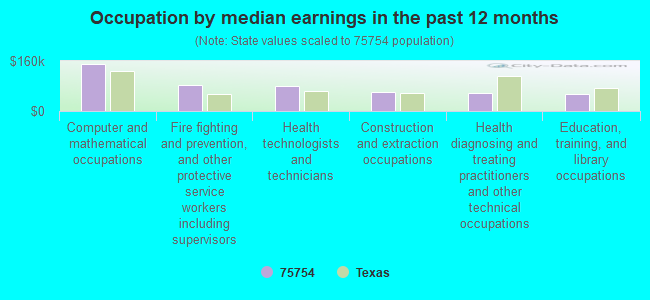
Occupation by median earnings in the past 12 months ($)
149,728Computer and mathematical occupations
83,024Fire fighting and prevention, and other protective service workers including supervisors
80,153Health technologists and technicians
61,849Construction and extraction occupations
58,809Health diagnosing and treating practitioners and other technical occupations
54,872Education, training, and library occupations
Companies with federal contracts located in this zip code:
SHIPLEY, RICHARD E & SHIPLEY, (480 VZ COUNTY ROAD 4509 in BEN WHEELER, TX; small business) : $101,288 in 6 contractsfrom 2003 to 2006
Contracts for Surveillance Services, Operation of Government-Owned Facilities -- Recreation Facilities (Non-Building) by U.S. Army Corps of Engineers - civil program financing only, Army Signed by year:2000: $0; 2001: $0; 2002: $0; 2003: $16,992; 2004: $33,984; 2005: $33,512; 2006: $16,800.
Biggest contracts:
$16,992 with U.S. Army Corps of Engineers - civil program financing only for Surveillance Services. Taking place in TN. Signed on 2004-02-06. Completion date: 2004-01-28.
$16,992 with Army for Surveillance Services. Taking place in TN. Signed on 2004-02-06. Completion date: 2004-01-28.
$16,992 with U.S. Army Corps of Engineers - civil program financing only for Surveillance Services. Taking place in TN. Signed on 2003-03-25. Completion date: 2003-03-25.
$16,800 with Army for Operation of Government-Owned Facilities -- Recreation Facilities (Non-Building). Taking place in TN. Signed on 2006-02-10. Completion date: 2006-09-30.
COLLEEN TRACY (1854 VZ COUNTY ROAD 4909 in BEN WHEELER, TX; small business) : $16,430 in 2 contractsfrom 2004 to 2006
$8,660 with Army for Guard Services. Signed on 2004-02-25. Completion date: 2004-09-30.
$7,770 with Army for Recreation Site Maintenance Services (non-construction). Signed on 2006-03-29. Completion date: 2006-04-01.
Top industries in this zip code by the number of employees in 2005:
Other Services (except Public Administration): Commercial and Industrial Machinery and Equipment (except Automotive and Electronic) Repair and Maintenance (100-249 employees: 1 establishment, 5-9 employees: 1 establishment)
Accommodation and Food Services: Full-Service Restaurants (20-49: 1, 5-9: 1)
Construction: New Single-Family Housing Construction (except Operative Builders) (20-49: 1, 1-4: 2)
Finance and Insurance: Commercial Banking (10-19: 1, 5-9: 1)
Other Services (except Public Administration): Religious Organizations (5-9: 2, 1-4: 2)
Administrative and Support and Waste Management and Remediation Services: Travel Agencies (10-19: 1)
167 people in other nonhousehold living situations
Fatal accident statistics in 2014:
Fatal accident count: 2
Vehicles involved in fatal accidents: 3
Fatal accidents caused by drunken drivers: 0
Fatalities: 2
Persons involved in fatal accidents: 3
Pedestrians involved in fatal accidents: 0
Fatal accident statistics in 2013:
Fatal accident count: 1
Vehicles involved in fatal accidents: 2
Fatal accidents caused by drunken drivers: 1
Fatalities: 2
Persons involved in fatal accidents: 2
Pedestrians involved in fatal accidents: 0
2002 - 2018 National Fire Incident Reporting System (NFIRS) incidents
Based on the data from the years 2002 - 2018 the average number of fires per year is 42. The highest number of reported fire incidents - 100 took place in 2008, and the least - 3 in 2015. The data has an increasing trend.
When looking into fire subcategories, the most incidents belonged to: Outside Fires (74.0%), and Structure Fires (19.5%).
Fire incident types reported to NFIRS in Zip Code 75754

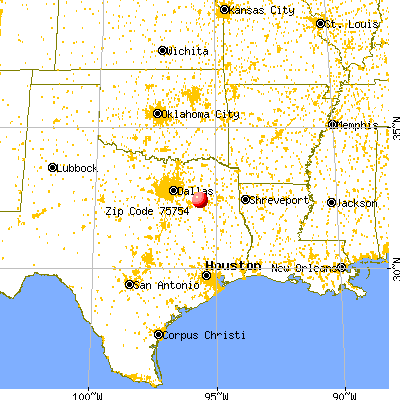


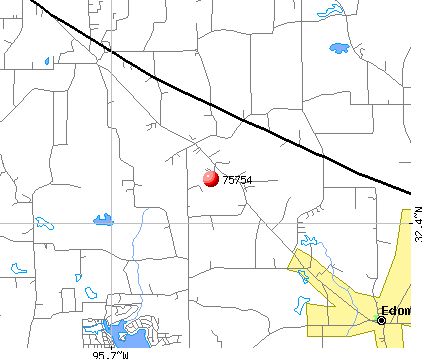 Nearest zip codes: 75790, 75778, 75756, 75758, 75704, 75140.
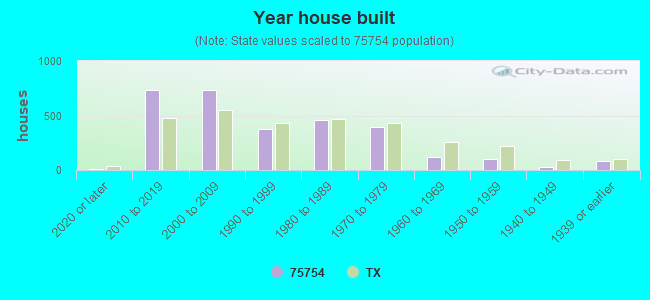


 : $101,288 in 6 contracts from 2003 to 2006
 Based on the data from the years 2002 - 2018 the average number of fires per year is 42. The highest number of reported fire incidents - 100 took place in 2008, and the least - 3 in 2015. The data has an increasing trend.
 When looking into fire subcategories, the most incidents belonged to: Outside Fires (74.0%), and Structure Fires (19.5%).