Estimated zip code population in 2022: 1,364 Zip code population in 2010: 1,021 Zip code population in 2000: 1,171
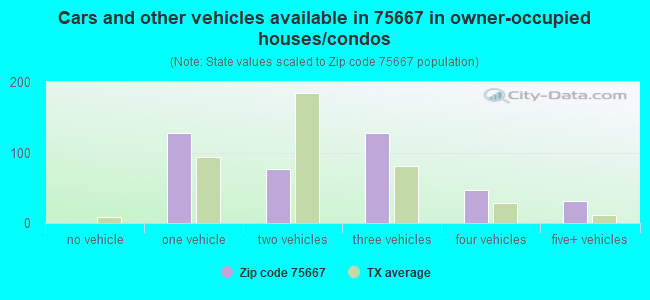
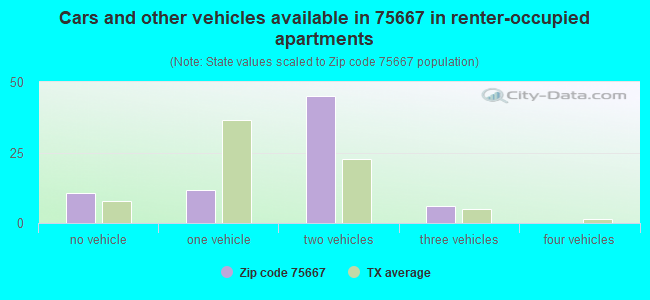
Houses and condos: 547 Renter-occupied apartments: 74
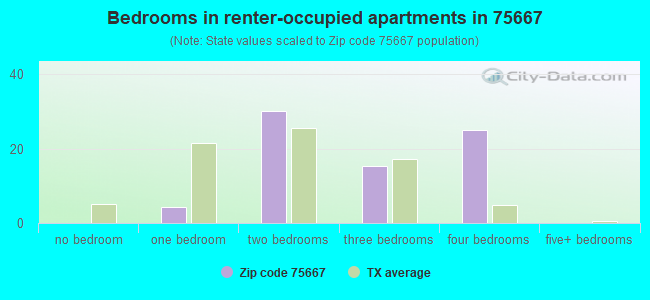
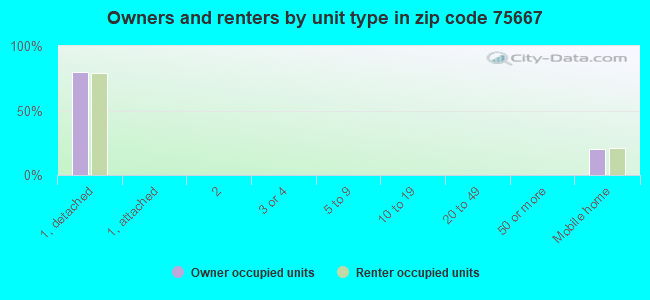
% of renters here:
15%
State:
38%
March 2022 cost of living index in zip code 75667: 78.2 (low, U.S. average is 100)
Land area: 84.5 sq. mi. Water area: 0.3 sq. mi.
Population density: 16 people per square mile
(very low).
OSM Map
General Map
Google Map
MSN Map
OSM Map
General Map
Google Map
MSN Map
OSM Map
General Map
Google Map
MSN Map
OSM Map
General Map
Google Map
MSN Map
Please wait while loading the map...
Real estate property taxes paid for housing units in 2022:
This zip code:
1.3% ($1,343)
Texas:
1.5% ($4,050)
Median real estate property taxes paid for housing units with mortgages in 2022: $1,386 Median real estate property taxes paid for housing units with no mortgage in 2022: $1,317
Business Search- 14 Million verified businesses
Males: 793
(58.2%)
Females: 570
(41.8%)
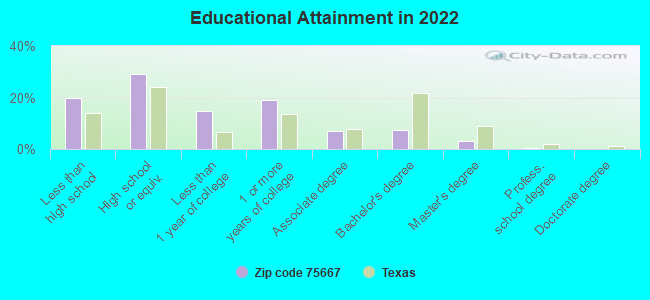
For population 25 years and over in 75667:
High school or higher: 78.5%
Bachelor's degree or higher: 10.5%
Graduate or professional degree: 3.3%
Unemployed: 7.9%
Mean travel time to work (commute): 33.7 minutes
For population 15 years and over in 75667:
Never married: 27.6%
Now married: 55.4%
Separated: 0.6%
Widowed: 5.4%
Divorced: 11.0%
Zip code 75667 compared to state average:
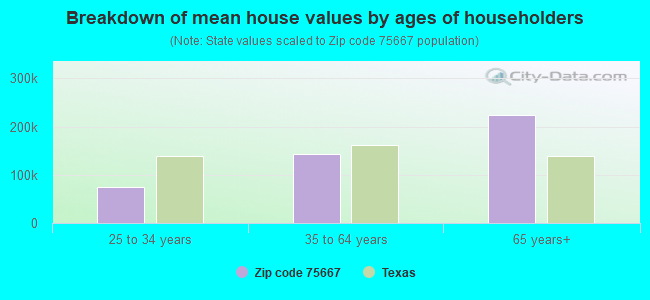
Median house value significantly below state average.
Unemployed percentage above state average.
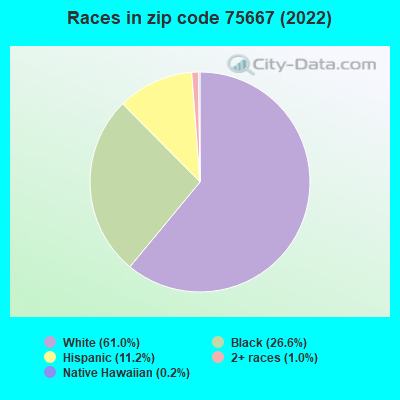
Black race population percentage above state average.
Hispanic race population percentage significantly below state average.
Median age significantly above state average.
Foreign-born population percentage significantly below state average.
Renting percentage significantly below state average.
House age above state average.
Number of college students below state average.
Percentage of population with a bachelor's degree or higher significantly below state average.
Averages for the 2020 tax year for zip code 75667, filed in 2021:
Average Adjusted Gross Income (AGI) in 2020: $47,573 (Individual Income Tax Returns)
Here:
$47,573
State:
$77,054
Salary/wage: $43,167 (reported on 80.8% of returns)
Here:
$43,167
State:
$62,766
(% of AGI for various income ranges: 1282.5% for AGIs below $25k, 3662.5% for AGIs $25k-50k, 6568.0% for AGIs $50k-75k, 7933.3% for AGIs $75k-100k, 15047.5% for AGIs $100k-200k)
Taxable interest for individuals: $555 (reported on 21.2% of returns)
This zip code:
$555
Texas:
$2,665
(% of AGI for various income ranges: 16.9% for AGIs below $25k, 28.0% for AGIs $50k-75k, 50.0% for AGIs $100k-200k)
Ordinary dividends: $1,180 (reported on 9.6% of returns)
Here:
$1,180
State:
$10,044
(% of AGI for various income ranges: 13.8% for AGIs below $25k, 123.3% for AGIs $75k-100k)
Net capital gain/loss in AGI: +$8,217 (reported on 11.5% of returns)
Here:
+$8,217
State:
+$39,590
(% of AGI for various income ranges: 73.3% for AGIs $25k-50k, 1012.5% for AGIs $100k-200k)
Profit/loss from business: +$4,156 (reported on 17.3% of returns)
Here:
+$4,156
State:
+$10,888
(% of AGI for various income ranges: 86.9% for AGIs below $25k, 130.0% for AGIs $25k-50k, 158.0% for AGIs $50k-75k)
Taxable individual retirement arrangement distribution: $13,050 (reported on 7.7% of returns)
75667:
$13,050
Texas:
$24,740
(% of AGI for various income ranges: 435.0% for AGIs $25k-50k)
Earned income credit: $2,725 (reported on 23.1% of returns)
Here:
$2,725
State:
$2,584
(% of AGI for various income ranges: 139.4% for AGIs below $25k, 86.7% for AGIs $25k-50k)
Percentage of individuals using paid preparers for their 2020 taxes: 92.3%
Here:
92%
State:
92%
(% for various income ranges: 90.0% for AGIs below $25k, 93.3% for AGIs $25k-50k, 85.7% for AGIs $50k-75k, 100.0% for AGIs $75k-100k, 100.0% for AGIs $100k-200k)
Averages for the 2012 tax year for zip code 75667, filed in 2013:
Average Adjusted Gross Income (AGI) in 2012: $42,679 (Individual Income Tax Returns)
Here:
$42,679
State:
$65,384
Salary/wage: $38,350 (reported on 80.9% of returns)
Here:
$38,350
State:
$52,524
(% of AGI for various income ranges: 68.8% for AGIs below $25k, 74.9% for AGIs $25k-50k, 77.6% for AGIs $50k-75k, 84.3% for AGIs $75k-100k, 63.7% for AGIs $100k-200k)
Taxable interest for individuals: $625 (reported on 25.5% of returns)
This zip code:
$625
Texas:
$2,372
(% of AGI for various income ranges: 0.4% for AGIs below $25k, 1.0% for AGIs $25k-50k, 0.3% for AGIs $50k-75k, 0.1% for AGIs $100k-200k)
Ordinary dividends: $2,375 (reported on 8.5% of returns)
Here:
$2,375
State:
$9,721
Profit/loss from business: +$11,911 (reported on 19.1% of returns)
Here:
+$11,911
State:
+$13,732
(% of AGI for various income ranges: 9.1% for AGIs below $25k, 8.0% for AGIs $25k-50k, 12.2% for AGIs $50k-75k)
Taxable individual retirement arrangement distribution: $9,275 (reported on 8.5% of returns)
75667:
$9,275
Texas:
$19,511
Total itemized deductions: $18,900 (23% of AGI, reported on 12.8% of returns)
Here:
$18,900
State:
$24,724
Here:
23.1% of AGI
State:
15.9% of AGI
Charity contributions: $6,500 (reported on 8.5% of returns)
Here:
$6,500
State:
$6,808
Taxes paid: $3,160 (reported on 10.6% of returns)
75667:
$3,160
State:
$6,921
Earned income credit: $2,820 (reported on 21.3% of returns)
Here:
$2,820
State:
$2,570
(% of AGI for various income ranges: 8.6% for AGIs below $25k, 1.1% for AGIs $25k-50k)
Percentage of individuals using paid preparers for their 2012 taxes: 61.7%
Here:
62%
State:
51%
(% for various income ranges: 60.0% for AGIs below $25k, 61.5% for AGIs $25k-50k, 50.0% for AGIs $50k-75k, 75.0% for AGIs $75k-100k, 75.0% for AGIs $100k-200k)
Averages for the 2004 tax year for zip code 75667, filed in 2005:
Average Adjusted Gross Income (AGI) in 2004: $28,953 (Individual Income Tax Returns)
Here:
$28,953
State:
$47,881
Salary/wage: $26,221 (reported on 79.3% of returns)
Here:
$26,221
State:
$41,947
(% of AGI for various income ranges: 74.5% for AGIs below $10k, 73.8% for AGIs $10k-25k, 72.1% for AGIs $25k-50k, 78.5% for AGIs $50k-75k, 77.4% for AGIs $75k-100k, 50.5% for AGIs over 100k)
Taxable interest for individuals: $1,290 (reported on 28.9% of returns)
This zip code:
$1,290
Texas:
$2,255
(% of AGI for various income ranges: 3.5% for AGIs below $10k, 3.0% for AGIs $10k-25k, 0.7% for AGIs $25k-50k, 0.9% for AGIs $50k-75k, 1.1% for AGIs $75k-100k)
Taxable dividends: $889 (reported on 10.5% of returns)
Here:
$889
State:
$4,261
Net capital gain/loss: +$884 (reported on 10.0% of returns)
Here:
+$884
State:
+$16,110
Profit/loss from business: +$2,758 (reported on 15.4% of returns)
Here:
+$2,758
State:
+$11,013
(% of AGI for various income ranges: 0.4% for AGIs below $10k, 6.3% for AGIs $10k-25k, -0.4% for AGIs $25k-50k, 1.3% for AGIs $50k-75k)
Total itemized deductions: $15,553 (27% of AGI, reported on 11.0% of returns)
Here:
$15,553
State:
$19,631
Here:
26.8% of AGI
State:
18.9% of AGI
Charity contributions deductions: $3,029 (5% of AGI, reported on 8.2% of returns)
Here:
$3,029
State:
$4,753
Here:
5.3% of AGI
State:
4.2% of AGI
Total tax: $3,491 (reported on 64.1% of returns)
75667:
$3,491
State:
$9,058
(% of AGI for various income ranges: 1.9% for AGIs below $10k, 3.2% for AGIs $10k-25k, 5.9% for AGIs $25k-50k, 9.2% for AGIs $50k-75k, 11.2% for AGIs $75k-100k, 15.2% for AGIs over 100k)
Earned income credit: $1,896 (reported on 29.1% of returns)
Here:
$1,896
State:
$2,024
Percentage of individuals using paid preparers for their 2004 taxes: 68.3%
Here:
68%
State:
57%
(% for various income ranges: 58.8% for AGIs below $10k, 74.2% for AGIs $10k-25k, 70.9% for AGIs $25k-50k, 64.4% for AGIs $50k-75k, 111.8% for AGIs $75k-100k)
Household received Food Stamps/SNAP in the past 12 months: 81 Household did not receive Food Stamps/SNAP in the past 12 months: 404
Women who had a birth in the past 12 months: 7 (7 now married, 0 unmarried) Women who did not have a birth in the past 12 months: 193 (126 now married, 65 unmarried)
Housing units in zip code 75667 with a mortgage: 171 (9 second mortgage, 10 both second mortgage and home equity loan) Median monthly owner costs for units with a mortgage: $1,154 Median monthly owner costs for units without a mortgage: $513
Residents with income below the poverty level in 2022:
This zip code:
11.4%
Whole state:
14.0%
Residents with income below 50% of the poverty level in 2022:
This zip code:
4.5%
Whole state:
7.4%
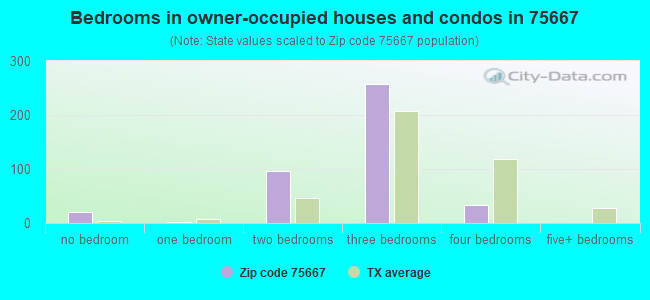
Median number of rooms in houses and condos:
Here:
5.6
State:
6.3
Median number of rooms in apartments:
Here:
6.5
State:
4.0
Notable locations in this zip code not listed on our city pages
Churches in zip code 75667 include: Post Oak Grove Church (A), Union Grove Church (B), Bethel Church (C), Laneville Church (D), Miracle Church (E), Mount Olive Church (F). Display/hide their locations on the map
Cemeteries: Vaughn Cemetery (1), Bagley Cemetery (2), Booker Cemetery (3), Neeley Cemetery (4), Cool Springs Cemetery (5), Gage Cemetery (6), Garrett Cemetery (7). Display/hide their locations on the map
Lakes and reservoirs: Johnson Lake (A), Indian Pond (B), Devereaux Lake (C), Harmon Lake (D), Black Lake (E), Riddle Lakes (F), Cushman Lake (G), Morris Lake (H). Display/hide their locations on the map
Streams, rivers, and creeks: Wheelus Branch (A), Shawnee Creek (B), Scoober Creek (C), Sawmill Branch (D), Sand Branch (E), Prairie Branch (F), Pirtle Branch (G), Parker Branch (H), Mush Creek (I). Display/hide their locations on the map
Size of family households: 153 2-persons, 138 3-persons, 78 4-persons, 30 5-persons
Size of nonfamily households: 74 1-person, 6 2-persons
176 married couples with children.
31 single-parent households (31 women).
94.1% of residents of 75667 zip code speak English at home.
5.4% of residents speak Spanish at home (92% very well, 8% well).
0.2% of residents speak Asian or Pacific Island language at home (100% very well).
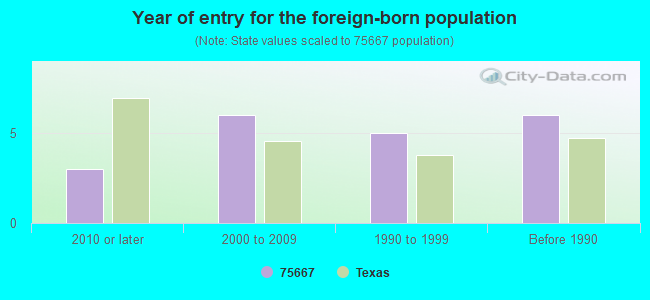
Foreign born population: 17 (1.3%) (37.8% of them are naturalized citizens)
This zip code:
1.3%
Whole state:
17.2%
94%Honduras
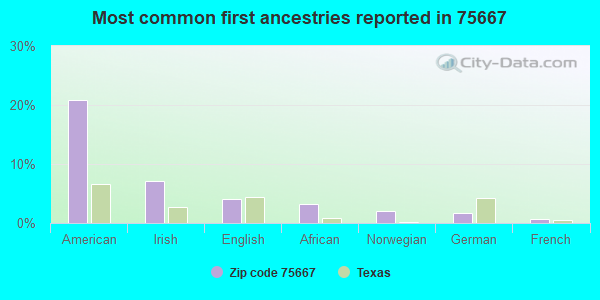
21%American
7%Irish
4%English
3%African
2%Norwegian
2%German
1%French
Year of entry for the foreign-born population
32010 or later
62000 to 2009
51990 to 1999
6Before 1990
Housing units lacking complete plumbing facilities: 4.9% Housing units lacking complete kitchen facilities: 6.0%
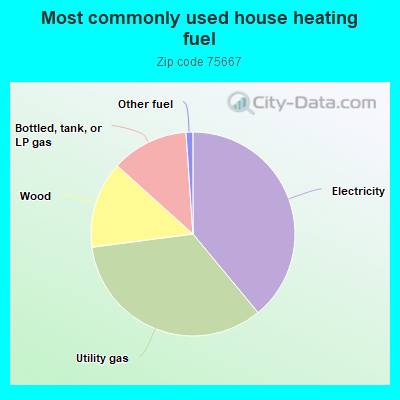
39.2%Electricity
34.1%Utility gas
13.8%Wood
12.3%Bottled, tank, or LP gas
1.1%Other fuel
Population in 1990: 3,032.
Place of birth for U.S.-born residents:
This state: 1,117
Northeast: 44
Midwest: 11
South: 108
West: 48
75% of the 75667 zip code residents lived in the same house 5 years ago. Out of people who lived in different houses, 51% lived in this county. Out of people who lived in different counties, 50% lived in Texas.
91% of the 75667 zip code residents lived in the same house 1 year ago. Out of people who lived in different houses, 6% moved from this county. Out of people who lived in different houses, 85% moved from different county within same state. Out of people who lived in different houses, 13% moved from different state.
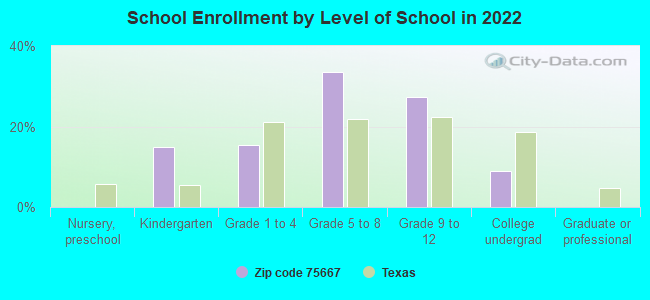
Private vs. public school enrollment:
Students in private schools in grades 1 to 8 (elementary and middle school): 23
Here:
19.6%
Texas:
8.8%
Students in private schools in grades 9 to 12 (high school): 6
Here:
9.5%
Texas:
8.0%
Students in private undergraduate colleges:
Here:
0.0%
Texas:
16.2%
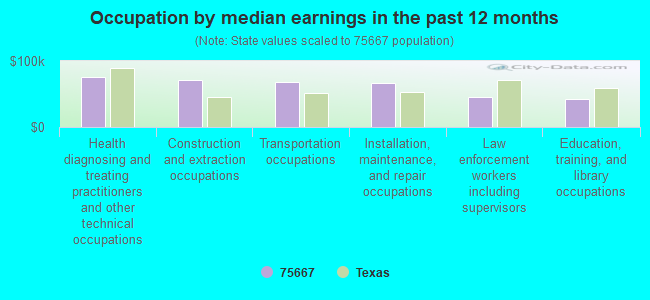
Occupation by median earnings in the past 12 months ($)
76,380Health diagnosing and treating practitioners and other technical occupations
70,589Construction and extraction occupations
68,501Transportation occupations
67,379Installation, maintenance, and repair occupations
45,656Law enforcement workers including supervisors
41,727Education, training, and library occupations
Top industries in this zip code by the number of employees in 2005:
Health Care and Social Assistance: Other Residential Care Facilities (20-49 employees: 1 establishment)
Wholesale Trade: Brick, Stone, and Related Construction Material Merchant Wholesalers (10-19: 1)
Utilities: Water Supply and Irrigation Systems (1-4: 2)
Accommodation and Food Services: Recreational and Vacation Camps (except Campgrounds) (1-4: 1)
Other Services (except Public Administration): Religious Organizations (1-4: 1)
Construction: Site Preparation Contractors (1-4: 1)
Health Care and Social Assistance: Home Health Care Services (1-4: 1)
Wholesale Trade: Wholesale Trade Agents and Brokers (1-4: 1)
People in group quarters in 2000:
27 people in residential treatment centers for emotionally disturbed children
Fatal accident statistics in 2013:
Fatal accident count: 1
Vehicles involved in fatal accidents: 1
Fatal accidents caused by drunken drivers: 0
Fatalities: 1
Persons involved in fatal accidents: 1
Pedestrians involved in fatal accidents: 0
Fatal accident statistics in 2012:
Fatal accident count: 2
Vehicles involved in fatal accidents: 2
Fatal accidents caused by drunken drivers: 1
Fatalities: 2
Persons involved in fatal accidents: 2
Pedestrians involved in fatal accidents: 0
Home Mortgage Disclosure Act Aggregated Statistics For Year 2009 (Based on 2 partial tracts)
A) FHA, FSA/RHS & VA Home Purchase Loans
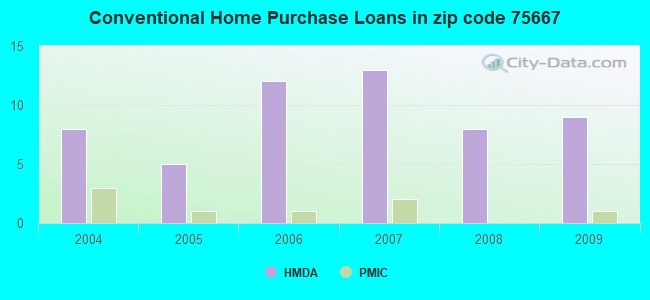
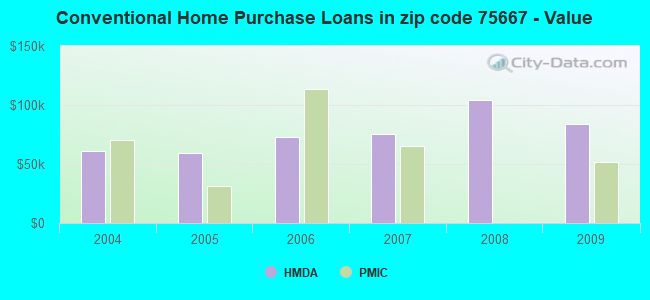
B) Conventional Home Purchase Loans
C) Refinancings
D) Home Improvement Loans
F) Non-occupant Loans on < 5 Family Dwellings (A B C & D)
G) Loans On Manufactured Home Dwelling (A B C & D)
Number
Average Value
Number
Average Value
Number
Average Value
Number
Average Value
Number
Average Value
Number
Average Value
LOANS ORIGINATED
4
$75,288
9
$83,692
5
$122,932
7
$27,049
4
$47,848
1
$114,560
APPLICATIONS APPROVED, NOT ACCEPTED
1
$52,140
0
$0
0
$0
1
$33,610
0
$0
0
$0
APPLICATIONS DENIED
1
$128,970
3
$60,367
2
$41,160
1
$15,780
0
$0
1
$45,280
APPLICATIONS WITHDRAWN
0
$0
1
$92,610
2
$131,370
1
$33,610
0
$0
0
$0
FILES CLOSED FOR INCOMPLETENESS
0
$0
0
$0
0
$0
0
$0
0
$0
0
$0
Aggregated Statistics For Year 2008 (Based on 2 partial tracts)
A) FHA, FSA/RHS & VA Home Purchase Loans
B) Conventional Home Purchase Loans
C) Refinancings
D) Home Improvement Loans
F) Non-occupant Loans on < 5 Family Dwellings (A B C & D)
G) Loans On Manufactured Home Dwelling (A B C & D)
Number
Average Value
Number
Average Value
Number
Average Value
Number
Average Value
Number
Average Value
Number
Average Value
LOANS ORIGINATED
1
$106,330
8
$104,615
1
$89,870
3
$39,560
1
$139,260
2
$43,905
APPLICATIONS APPROVED, NOT ACCEPTED
0
$0
1
$80,260
1
$18,520
0
$0
0
$0
1
$69,290
APPLICATIONS DENIED
1
$58,310
2
$62,770
3
$51,220
3
$36,357
0
$0
3
$55,793
APPLICATIONS WITHDRAWN
0
$0
1
$115,930
1
$46,650
0
$0
1
$115,930
0
$0
FILES CLOSED FOR INCOMPLETENESS
0
$0
1
$55,570
0
$0
0
$0
0
$0
0
$0
Aggregated Statistics For Year 2007 (Based on 2 partial tracts)
A) FHA, FSA/RHS & VA Home Purchase Loans
B) Conventional Home Purchase Loans
C) Refinancings
D) Home Improvement Loans
F) Non-occupant Loans on < 5 Family Dwellings (A B C & D)
G) Loans On Manufactured Home Dwelling (A B C & D)
Number
Average Value
Number
Average Value
Number
Average Value
Number
Average Value
Number
Average Value
Number
Average Value
LOANS ORIGINATED
1
$39,790
13
$75,249
7
$63,309
3
$32,700
2
$107,700
4
$53,680
APPLICATIONS APPROVED, NOT ACCEPTED
0
$0
3
$52,823
1
$85,750
0
$0
0
$0
3
$36,357
APPLICATIONS DENIED
0
$0
4
$66,885
6
$80,833
1
$91,240
1
$40,470
2
$43,220
APPLICATIONS WITHDRAWN
0
$0
0
$0
2
$57,280
0
$0
0
$0
0
$0
FILES CLOSED FOR INCOMPLETENESS
0
$0
1
$259,990
0
$0
0
$0
0
$0
0
$0
Aggregated Statistics For Year 2006 (Based on 2 partial tracts)
A) FHA, FSA/RHS & VA Home Purchase Loans
B) Conventional Home Purchase Loans
C) Refinancings
D) Home Improvement Loans
F) Non-occupant Loans on < 5 Family Dwellings (A B C & D)
G) Loans On Manufactured Home Dwelling (A B C & D)
Number
Average Value
Number
Average Value
Number
Average Value
Number
Average Value
Number
Average Value
Number
Average Value
LOANS ORIGINATED
1
$59,680
12
$73,002
4
$64,140
9
$27,059
1
$37,730
1
$85,750
APPLICATIONS APPROVED, NOT ACCEPTED
0
$0
3
$34,530
1
$11,660
0
$0
0
$0
2
$23,665
APPLICATIONS DENIED
1
$93,980
2
$52,820
5
$55,566
1
$45,280
1
$17,150
1
$52,820
APPLICATIONS WITHDRAWN
0
$0
2
$87,120
3
$62,883
0
$0
1
$52,820
0
$0
FILES CLOSED FOR INCOMPLETENESS
0
$0
0
$0
2
$68,945
1
$5,490
1
$32,930
0
$0
Aggregated Statistics For Year 2005 (Based on 2 partial tracts)
A) FHA, FSA/RHS & VA Home Purchase Loans
B) Conventional Home Purchase Loans
C) Refinancings
D) Home Improvement Loans
F) Non-occupant Loans on < 5 Family Dwellings (A B C & D)
G) Loans On Manufactured Home Dwelling (A B C & D)
Number
Average Value
Number
Average Value
Number
Average Value
Number
Average Value
Number
Average Value
Number
Average Value
LOANS ORIGINATED
1
$42,530
5
$59,408
7
$39,690
7
$11,956
1
$117,990
1
$45,280
APPLICATIONS APPROVED, NOT ACCEPTED
0
$0
3
$60,597
1
$13,030
0
$0
1
$52,820
1
$36,360
APPLICATIONS DENIED
0
$0
3
$32,927
7
$38,121
3
$29,727
2
$18,520
5
$27,166
APPLICATIONS WITHDRAWN
0
$0
3
$54,650
4
$133,428
1
$39,790
0
$0
0
$0
FILES CLOSED FOR INCOMPLETENESS
0
$0
1
$45,960
1
$42,530
0
$0
0
$0
0
$0
Aggregated Statistics For Year 2004 (Based on 2 partial tracts)
B) Conventional Home Purchase Loans
C) Refinancings
D) Home Improvement Loans
F) Non-occupant Loans on < 5 Family Dwellings (A B C & D)
G) Loans On Manufactured Home Dwelling (A B C & D)
Detailed PMIC statistics for the following Tracts:9511.00
2003 - 2018 National Fire Incident Reporting System (NFIRS) incidents
According to the data from the years 2003 - 2018 the average number of fire incidents per year is 29. The highest number of reported fire incidents - 57 took place in 2015, and the least - 2 in 2013. The data has an increasing trend.
When looking into fire subcategories, the most incidents belonged to: Outside Fires (62.2%), and Structure Fires (17.0%).
Fire incident types reported to NFIRS in Zip Code 75667

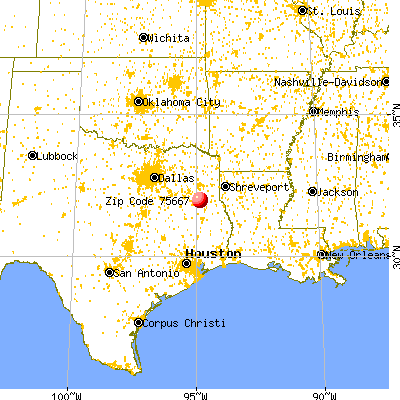


 Nearest zip codes: 75654, 75681, 75784, 75788, 75760, 75780.


 According to the data from the years 2003 - 2018 the average number of fire incidents per year is 29. The highest number of reported fire incidents - 57 took place in 2015, and the least - 2 in 2013. The data has an increasing trend.
 When looking into fire subcategories, the most incidents belonged to: Outside Fires (62.2%), and Structure Fires (17.0%).