Estimated zip code population in 2022: 4,009 Zip code population in 2010: 3,548 Zip code population in 2000: 2,590
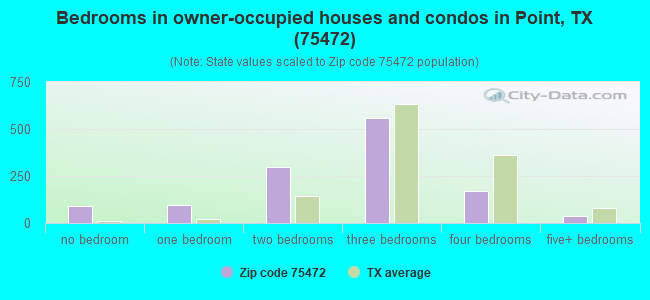
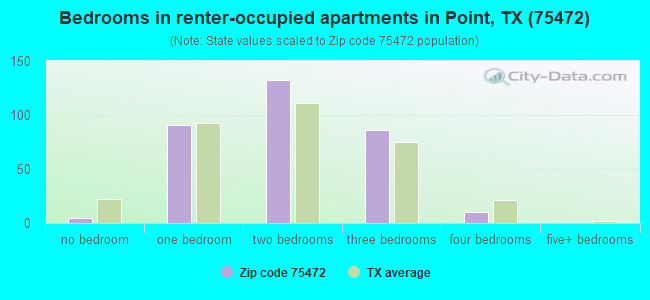
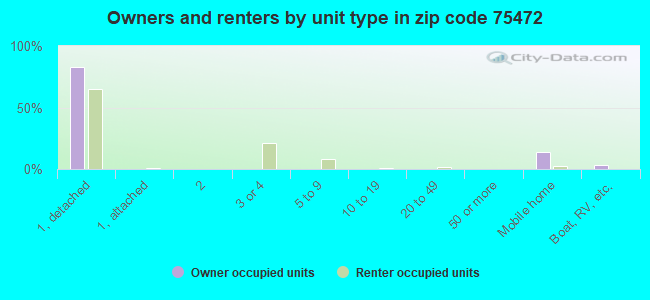
Houses and condos: 2,075 Renter-occupied apartments: 329
% of renters here:
21%
State:
38%
March 2022 cost of living index in zip code 75472: 79.5 (low, U.S. average is 100)
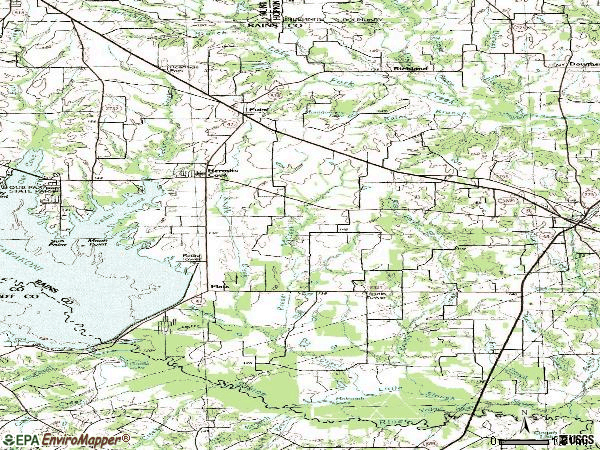
Land area: 63.7 sq. mi. Water area: 18.1 sq. mi.
Population density: 63 people per square mile
(very low).
OSM Map
General Map
Google Map
MSN Map
OSM Map
General Map
Google Map
MSN Map
OSM Map
General Map
Google Map
MSN Map
OSM Map
General Map
Google Map
MSN Map
Please wait while loading the map...
Real estate property taxes paid for housing units in 2022:
This zip code:
0.8% ($1,508)
Texas:
1.5% ($4,050)
Median real estate property taxes paid for housing units with mortgages in 2022: $1,775 (0.8%) Median real estate property taxes paid for housing units with no mortgage in 2022: $1,455 (1.5%)
Business Search- 14 Million verified businesses
Males: 1,938
(48.3%)
Females: 2,071
(51.7%)
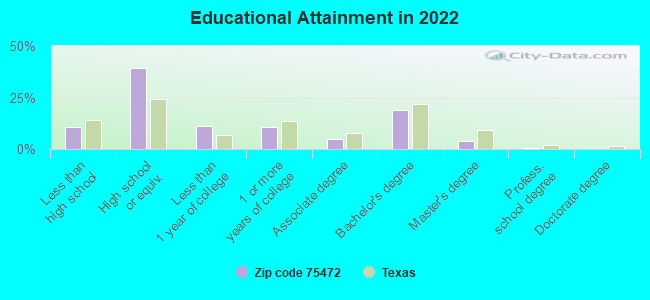
For population 25 years and over in 75472:
High school or higher: 88.8%
Bachelor's degree or higher: 23.3%
Graduate or professional degree: 4.5%
Unemployed: 1.8%
Mean travel time to work (commute): 41.6 minutes
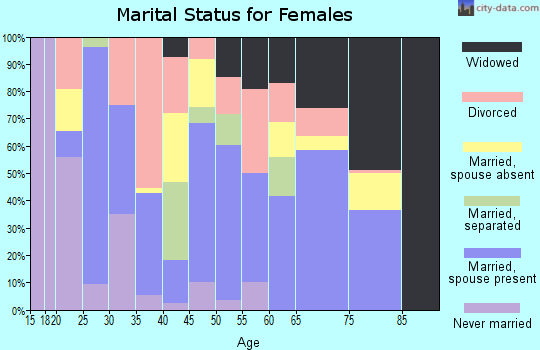
For population 15 years and over in 75472:
Never married: 20.9%
Now married: 49.1%
Separated: 5.6%
Widowed: 10.9%
Divorced: 13.5%
Zip code 75472 compared to state average:
Unemployed percentage below state average.
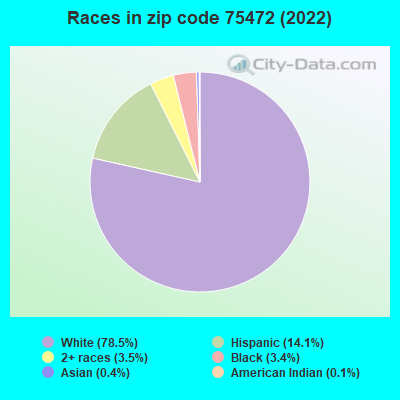
Black race population percentage significantly below state average.
Hispanic race population percentage below state average.
Median age significantly above state average.
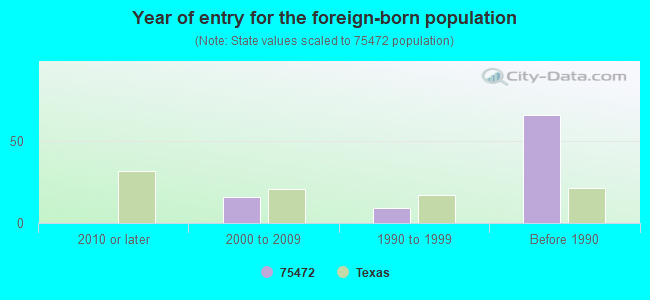
Foreign-born population percentage significantly below state average.
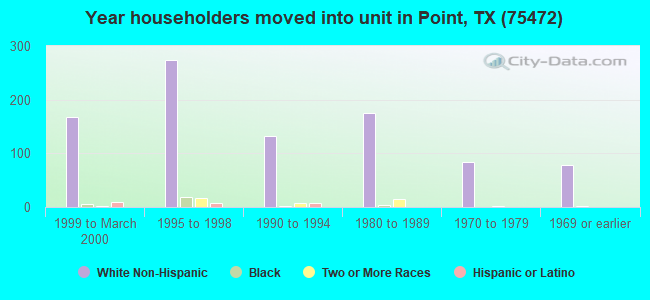
Renting percentage below state average.
Length of stay since moving in significantly above state average.
Number of college students significantly below state average.
Averages for the 2020 tax year for zip code 75472, filed in 2021:
Average Adjusted Gross Income (AGI) in 2020: $53,206 (Individual Income Tax Returns)
Here:
$53,206
State:
$77,054
Salary/wage: $45,258 (reported on 77.8% of returns)
Here:
$45,258
State:
$62,766
(% of AGI for various income ranges: 1022.9% for AGIs below $25k, 3395.6% for AGIs $25k-50k, 6452.9% for AGIs $50k-75k, 8692.0% for AGIs $75k-100k, 13508.5% for AGIs $100k-200k)
Taxable interest for individuals: $1,309 (reported on 20.5% of returns)
This zip code:
$1,309
Texas:
$2,665
(% of AGI for various income ranges: 25.3% for AGIs below $25k, 17.4% for AGIs $25k-50k, 25.7% for AGIs $50k-75k, 42.0% for AGIs $75k-100k, 119.2% for AGIs $100k-200k)
Ordinary dividends: $1,961 (reported on 10.5% of returns)
Here:
$1,961
State:
$10,044
(% of AGI for various income ranges: 6.3% for AGIs below $25k, 11.8% for AGIs $25k-50k, 24.8% for AGIs $50k-75k, 49.0% for AGIs $75k-100k, 138.5% for AGIs $100k-200k)
Net capital gain/loss in AGI: +$32,822 (reported on 10.5% of returns)
Here:
+$32,822
State:
+$39,590
(% of AGI for various income ranges: 27.4% for AGIs $25k-50k, 59.0% for AGIs $50k-75k, 98.0% for AGIs $75k-100k, 4307.7% for AGIs $100k-200k)
Profit/loss from business: +$9,547 (reported on 17.5% of returns)
Here:
+$9,547
State:
+$10,888
(% of AGI for various income ranges: 156.3% for AGIs below $25k, 179.7% for AGIs $25k-50k, 144.8% for AGIs $50k-75k, 374.0% for AGIs $75k-100k, 598.5% for AGIs $100k-200k)
Taxable individual retirement arrangement distribution: $16,460 (reported on 8.8% of returns)
75472:
$16,460
Texas:
$24,740
(% of AGI for various income ranges: 44.9% for AGIs below $25k, 221.8% for AGIs $25k-50k, 459.0% for AGIs $75k-100k, 790.0% for AGIs $100k-200k)
Total itemized deductions: $29,100 (reported on 3.5% of returns)
Here:
$29,100
State:
$40,428
(% of AGI for various income ranges: 518.6% for AGIs $50k-75k, 505.4% for AGIs $100k-200k)
Charity contributions: $8,300 (reported on 2.9% of returns)
Here:
$8,300
State:
$18,201
(% of AGI for various income ranges: 97.1% for AGIs $50k-75k, 162.3% for AGIs $100k-200k)
Taxes paid: $6,520 (reported on 2.9% of returns)
75472:
$6,520
State:
$7,821
(% of AGI for various income ranges: 82.4% for AGIs $50k-75k, 117.7% for AGIs $100k-200k)
Earned income credit: $2,356 (reported on 21.1% of returns)
Here:
$2,356
State:
$2,584
(% of AGI for various income ranges: 109.6% for AGIs below $25k, 85.0% for AGIs $25k-50k)
Percentage of individuals using paid preparers for their 2020 taxes: 94.7%
Here:
95%
State:
92%
(% for various income ranges: 92.3% for AGIs below $25k, 97.6% for AGIs $25k-50k, 96.4% for AGIs $50k-75k, 92.9% for AGIs $75k-100k, 94.7% for AGIs $100k-200k, 100.0% for AGIs over 200k)
Averages for the 2012 tax year for zip code 75472, filed in 2013:
Average Adjusted Gross Income (AGI) in 2012: $40,483 (Individual Income Tax Returns)
Here:
$40,483
State:
$65,384
Salary/wage: $38,369 (reported on 77.0% of returns)
Here:
$38,369
State:
$52,524
(% of AGI for various income ranges: 63.8% for AGIs below $25k, 75.8% for AGIs $25k-50k, 73.0% for AGIs $50k-75k, 79.9% for AGIs $75k-100k, 71.8% for AGIs $100k-200k)
Taxable interest for individuals: $1,748 (reported on 23.0% of returns)
This zip code:
$1,748
Texas:
$2,372
(% of AGI for various income ranges: 1.7% for AGIs below $25k, 1.5% for AGIs $25k-50k, 0.4% for AGIs $50k-75k, 0.3% for AGIs $75k-100k, 1.2% for AGIs $100k-200k)
Ordinary dividends: $1,656 (reported on 11.9% of returns)
Here:
$1,656
State:
$9,721
(% of AGI for various income ranges: 1.0% for AGIs below $25k, 0.4% for AGIs $25k-50k, 0.4% for AGIs $50k-75k, 0.5% for AGIs $100k-200k)
Net capital gain/loss in AGI: +$1,779 (reported on 10.4% of returns)
Here:
+$1,779
State:
+$35,319
(% of AGI for various income ranges: 0.5% for AGIs $50k-75k, 1.5% for AGIs $100k-200k)
Profit/loss from business: +$7,388 (reported on 19.3% of returns)
Here:
+$7,388
State:
+$13,732
(% of AGI for various income ranges: 14.3% for AGIs below $25k, 0.9% for AGIs $25k-50k, 5.8% for AGIs $50k-75k)
Taxable individual retirement arrangement distribution: $11,456 (reported on 11.9% of returns)
75472:
$11,456
Texas:
$19,511
(% of AGI for various income ranges: 3.5% for AGIs below $25k, 2.9% for AGIs $25k-50k, 5.8% for AGIs $50k-75k, 3.2% for AGIs $100k-200k)
Total itemized deductions: $18,436 (27% of AGI, reported on 18.5% of returns)
Here:
$18,436
State:
$24,724
Here:
27.0% of AGI
State:
15.9% of AGI
(% of AGI for various income ranges: 7.6% for AGIs below $25k, 8.2% for AGIs $25k-50k, 8.5% for AGIs $50k-75k, 6.4% for AGIs $75k-100k, 10.2% for AGIs $100k-200k)
Charity contributions: $4,593 (reported on 11.1% of returns)
Here:
$4,593
State:
$6,808
(% of AGI for various income ranges: 1.1% for AGIs $25k-50k, 1.4% for AGIs $50k-75k, 1.0% for AGIs $75k-100k, 2.1% for AGIs $100k-200k)
Taxes paid: $3,804 (reported on 17.0% of returns)
75472:
$3,804
State:
$6,921
(% of AGI for various income ranges: 1.1% for AGIs below $25k, 1.2% for AGIs $25k-50k, 1.5% for AGIs $50k-75k, 1.2% for AGIs $75k-100k, 2.6% for AGIs $100k-200k)
Earned income credit: $2,297 (reported on 25.2% of returns)
Here:
$2,297
State:
$2,570
(% of AGI for various income ranges: 8.2% for AGIs below $25k, 1.4% for AGIs $25k-50k)
Percentage of individuals using paid preparers for their 2012 taxes: 53.3%
Here:
53%
State:
51%
(% for various income ranges: 52.5% for AGIs below $25k, 51.5% for AGIs $25k-50k, 54.5% for AGIs $50k-75k, 55.6% for AGIs $75k-100k, 60.0% for AGIs $100k-200k)
Averages for the 2004 tax year for zip code 75472, filed in 2005:
Average Adjusted Gross Income (AGI) in 2004: $30,650 (Individual Income Tax Returns)
Here:
$30,650
State:
$47,881
Salary/wage: $30,337 (reported on 76.6% of returns)
Here:
$30,337
State:
$41,947
(% of AGI for various income ranges: 166.9% for AGIs below $10k, 70.7% for AGIs $10k-25k, 76.4% for AGIs $25k-50k, 82.6% for AGIs $50k-75k, 76.1% for AGIs $75k-100k, 53.6% for AGIs over 100k)
Taxable interest for individuals: $1,509 (reported on 32.8% of returns)
This zip code:
$1,509
Texas:
$2,255
(% of AGI for various income ranges: 15.0% for AGIs below $10k, 1.4% for AGIs $10k-25k, 1.7% for AGIs $25k-50k, 0.5% for AGIs $50k-75k, 1.9% for AGIs $75k-100k, 1.4% for AGIs over 100k)
Taxable dividends: $1,319 (reported on 11.9% of returns)
Here:
$1,319
State:
$4,261
(% of AGI for various income ranges: 1.9% for AGIs below $10k, 0.7% for AGIs $10k-25k, 0.8% for AGIs $25k-50k, 0.1% for AGIs $50k-75k, 0.0% for AGIs $75k-100k, 0.6% for AGIs over 100k)
Net capital gain/loss: +$2,601 (reported on 12.9% of returns)
Here:
+$2,601
State:
+$16,110
(% of AGI for various income ranges: -1.4% for AGIs below $10k, 0.5% for AGIs $10k-25k, 1.2% for AGIs $25k-50k, 0.3% for AGIs $50k-75k, 2.3% for AGIs $75k-100k, 1.9% for AGIs over 100k)
Profit/loss from business: +$4,266 (reported on 21.3% of returns)
Here:
+$4,266
State:
+$11,013
(% of AGI for various income ranges: 18.2% for AGIs below $10k, 10.6% for AGIs $10k-25k, 2.3% for AGIs $25k-50k, 1.9% for AGIs $50k-75k, -0.5% for AGIs $75k-100k)
IRA payment deduction: $1,667 (reported on 0.9% of returns)
75472:
$1,667
Texas:
$3,120
Total itemized deductions: $16,594 (28% of AGI, reported on 16.7% of returns)
Here:
$16,594
State:
$19,631
Here:
28.3% of AGI
State:
18.9% of AGI
(% of AGI for various income ranges: 7.6% for AGIs $10k-25k, 8.4% for AGIs $25k-50k, 8.4% for AGIs $50k-75k, 9.7% for AGIs $75k-100k, 14.1% for AGIs over 100k)
Charity contributions deductions: $3,376 (6% of AGI, reported on 11.7% of returns)
Here:
$3,376
State:
$4,753
Here:
5.5% of AGI
State:
4.2% of AGI
(% of AGI for various income ranges: 1.2% for AGIs $10k-25k, 0.9% for AGIs $25k-50k, 1.2% for AGIs $50k-75k, 1.0% for AGIs $75k-100k, 3.0% for AGIs over 100k)
Total tax: $3,754 (reported on 68.0% of returns)
75472:
$3,754
State:
$9,058
(% of AGI for various income ranges: 6.8% for AGIs below $10k, 3.8% for AGIs $10k-25k, 5.9% for AGIs $25k-50k, 9.2% for AGIs $50k-75k, 10.4% for AGIs $75k-100k, 16.1% for AGIs over 100k)
Earned income credit: $1,787 (reported on 23.8% of returns)
Here:
$1,787
State:
$2,024
Percentage of individuals using paid preparers for their 2004 taxes: 61.1%
Here:
61%
State:
57%
(% for various income ranges: 54.4% for AGIs below $10k, 64.4% for AGIs $10k-25k, 62.4% for AGIs $25k-50k, 69.1% for AGIs $50k-75k, 51.4% for AGIs $75k-100k, 60.5% for AGIs over 100k)
Likely homosexual households (counted as self-reported same-sex unmarried-partner households)
Lesbian couples: 0.3% of all households
Gay men: 0.0% of all households
Household received Food Stamps/SNAP in the past 12 months: 261 Household did not receive Food Stamps/SNAP in the past 12 months: 1,311
Women who had a birth in the past 12 months: 42 (14 now married, 26 unmarried) Women who did not have a birth in the past 12 months: 680 (325 now married, 354 unmarried)
Housing units in zip code 75472 with a mortgage: 675 (30 second mortgage, 19 both second mortgage and home equity loan) Median monthly owner costs for units with a mortgage: $1,380 Median monthly owner costs for units without a mortgage: $495
Residents with income below the poverty level in 2022:
This zip code:
12.5%
Whole state:
14.0%
Residents with income below 50% of the poverty level in 2022:
This zip code:
6.5%
Whole state:
7.4%
Median number of rooms in houses and condos:
Here:
5.1
State:
6.3
Median number of rooms in apartments:
Here:
4.1
State:
4.0
Notable locations in this zip code not listed on our city pages
Notable locations in zip code 75472: Henderson County Clint W Murchison Memorial Library (A), Point Volunteer Fire Department (B), Southwest Rains Volunteer Fire Department (C). Display/hide their locations on the map
Churches in zip code 75472 include: Prospect Church (A), Richland Baptist Church (B), Woosky Church (C), Clarks Chapel (D), Church of the Living God (E). Display/hide their locations on the map
Cemeteries: Lone Star Cemetery (1), Richland-Benton Hill Cemetery (2), Parks Cemetery (3), Clark Cemetery (4), Prospect Cemetery (5), Trumble Cemetery (6), Lynch Cemetery (7). Display/hide their locations on the map
Streams, rivers, and creeks: Brushy Creek (A), Brickkiln Branch (B), Bee Branch (C), Schoolhouse Branch (D), Woodbury Creek (E), Shuffle Creek (F), Reeder Creek (G), Hooker Creek (H), Dement Branch (I). Display/hide their locations on the map
Size of family households: 644 2-persons, 239 3-persons, 114 4-persons, 58 5-persons, 9 6-persons, 4 7-or-more-persons
Size of nonfamily households: 362 1-person, 149 2-persons
312 married couples with children.
257 single-parent households (27 men, 230 women).
92.8% of residents of 75472 zip code speak English at home.
6.6% of residents speak Spanish at home (69% very well, 11% well, 20% not well).
0.5% of residents speak other Indo-European language at home (100% very well).
0.4% of residents speak Asian or Pacific Island language at home (29% very well, 64% well, 7% not well).
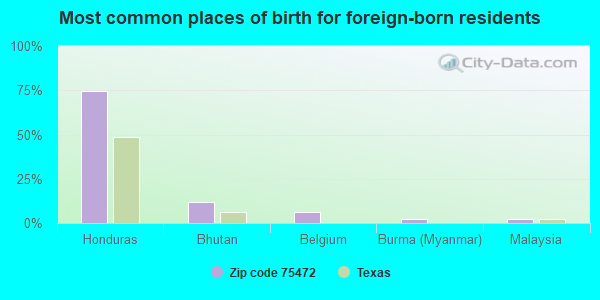
Foreign born population: 98 (2.5%) (85.9% of them are naturalized citizens)
This zip code:
2.5%
Whole state:
17.2%
74%Honduras
12%Bhutan
6%Belgium
2%Burma (Myanmar)
2%Malaysia
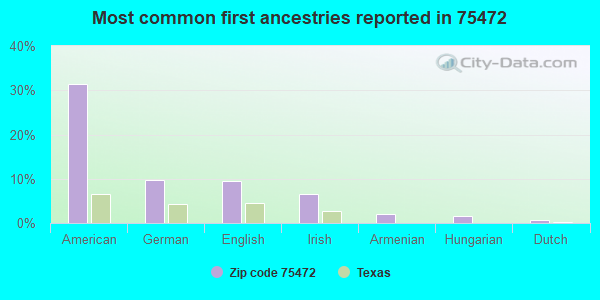
31%American
10%German
9%English
6%Irish
2%Armenian
2%Hungarian
1%Dutch
Year of entry for the foreign-born population
02010 or later
162000 to 2009
91990 to 1999
66Before 1990
Facilities with environmental interests located in this zip code:
AAA WIRE PRODUCTS INC (HIGHWAY 69 SOUTH in POINT, TX)
TSD (Resource Conservation and Recovery Act (tracking hazardous waste)) TRI REPORTER (Tracking of toxic chemicals releasing facilities) Business SIC classification: ELECTROPLATING, PLATING, POLISHING, ANODIZING, AND COLORING; MISCELLANEOUS FABRICATED WIRE PRODUCTS Business NAICS classification: OTHER FABRICATED WIRE PRODUCT MANUFACTURING. Organizations: AAA WIRE PRODUSTS SERVICE (CONTACT/OPERATOR)
Housing units lacking complete plumbing facilities: 5.5% Housing units lacking complete kitchen facilities: 8.3%
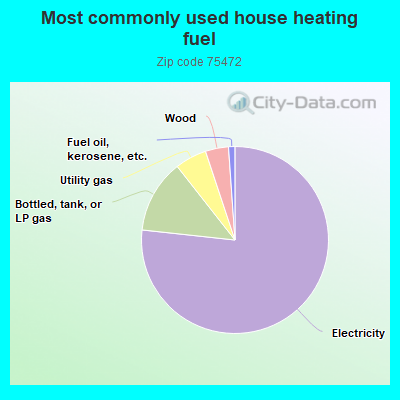
76.8%Electricity
12.7%Bottled, tank, or LP gas
5.5%Utility gas
4.0%Wood
1.1%Fuel oil, kerosene, etc.
Population in 1990: 2,796.
Place of birth for U.S.-born residents:
This state: 3,007
Northeast: 115
Midwest: 257
South: 377
West: 125
52% of the 75472 zip code residents lived in the same house 5 years ago. Out of people who lived in different houses, 28% lived in this county. Out of people who lived in different counties, 50% lived in Texas.
87% of the 75472 zip code residents lived in the same house 1 year ago. Out of people who lived in different houses, 40% moved from this county. Out of people who lived in different houses, 57% moved from different county within same state. Out of people who lived in different houses, 2% moved from different state.
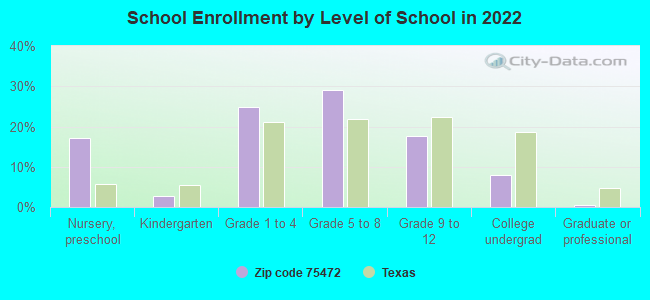
Private vs. public school enrollment:
Students in private schools in grades 1 to 8 (elementary and middle school): 5
Here:
2.0%
Texas:
8.8%
Students in private schools in grades 9 to 12 (high school): 4
Here:
4.5%
Texas:
8.0%
Students in private undergraduate colleges:
Here:
0.0%
Texas:
16.2%
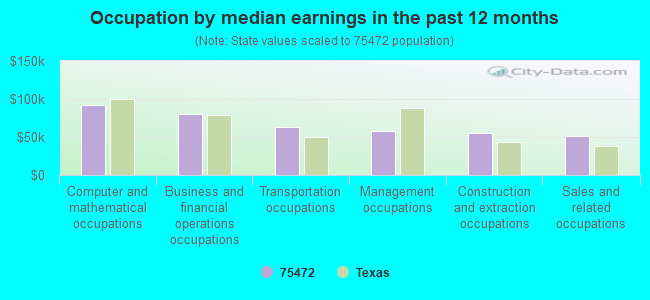
Occupation by median earnings in the past 12 months ($)
92,512Computer and mathematical occupations
79,932Business and financial operations occupations
62,762Transportation occupations
58,403Management occupations
54,715Construction and extraction occupations
51,895Sales and related occupations
Top industries in this zip code by the number of employees in 2005:
Accommodation and Food Services: RV (Recreational Vehicle) Parks and Campgrounds (20-49 employees: 1 establishment)
Construction: Electrical Contractors (10-19: 2)
Other Services (except Public Administration): Religious Organizations (5-9: 1)
Construction: New Housing Operative Builders (5-9: 1)
Accommodation and Food Services: Full-Service Restaurants (1-4: 3)
Wholesale Trade: Wholesale Trade Agents and Brokers (1-4: 1)
Fatal accident statistics in 2014:
Fatal accident count: 1
Vehicles involved in fatal accidents: 1
Fatal accidents caused by drunken drivers: 1
Fatalities: 1
Persons involved in fatal accidents: 1
Pedestrians involved in fatal accidents: 0
Fatal accident statistics in 2010:
Fatal accident count: 1
Vehicles involved in fatal accidents: 1
Fatal accidents caused by drunken drivers: 1
Fatalities: 1
Persons involved in fatal accidents: 2
Pedestrians involved in fatal accidents: 0
2002 - 2018 National Fire Incident Reporting System (NFIRS) incidents
Based on the data from the years 2002 - 2018 the average number of fires per year is 15. The highest number of fires - 56 took place in 2016, and the least - 1 in 2007. The data has a decreasing trend.
When looking into fire subcategories, the most incidents belonged to: Outside Fires (55.5%), and Structure Fires (34.4%).
Fire incident types reported to NFIRS in Zip Code 75472


 Nearest zip codes: 75453, 75440, 75117, 75127, 75169, 75433.


 Based on the data from the years 2002 - 2018 the average number of fires per year is 15. The highest number of fires - 56 took place in 2016, and the least - 1 in 2007. The data has a decreasing trend.
 When looking into fire subcategories, the most incidents belonged to: Outside Fires (55.5%), and Structure Fires (34.4%).