Estimated zip code population in 2022: 28,732 Zip code population in 2010: 25,908 Zip code population in 2000: 16,225
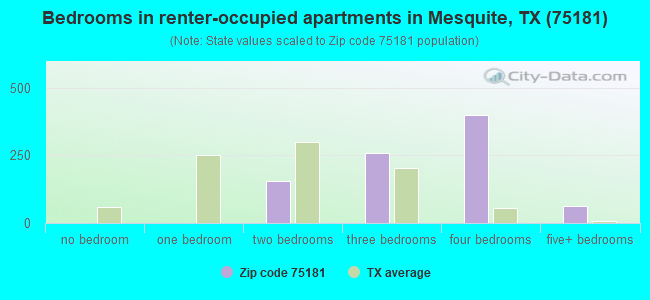
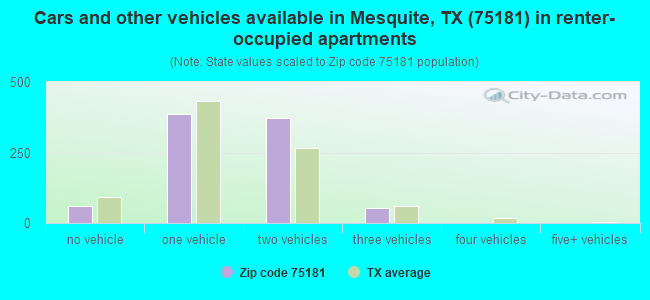
Houses and condos: 8,595 Renter-occupied apartments: 877
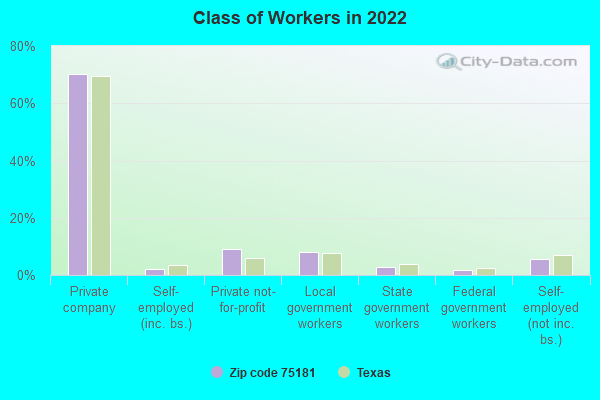
% of renters here:
10%
State:
38%
March 2022 cost of living index in zip code 75181: 94.1 (less than average, U.S. average is 100)
Land area: 17.6 sq. mi. Water area: 0.1 sq. mi.
Population density: 1,633 people per square mile
(low).
OSM Map
General Map
Google Map
MSN Map
OSM Map
General Map
Google Map
MSN Map
OSM Map
General Map
Google Map
MSN Map
OSM Map
General Map
Google Map
MSN Map
Please wait while loading the map...
Real estate property taxes paid for housing units in 2022:
This zip code:
1.6% ($4,820)
Texas:
1.5% ($4,050)
Median real estate property taxes paid for housing units with mortgages in 2022: $4,891 (1.6%) Median real estate property taxes paid for housing units with no mortgage in 2022: $4,695 (1.6%)
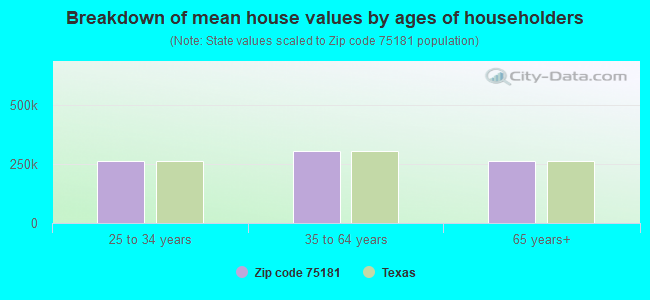
Estimated median house/condo value in 2022: $297,270
75181:
$297,270
Texas:
$275,400
According to our research of Texas and other state lists, there were 36 registered sex offenders living in 75181 zip code as of July 04, 2024. The ratio of all residents to sex offenders in zip code 75181 is 782 to 1. The ratio of registered sex offenders to all residents in this zip code is lower than the state average.
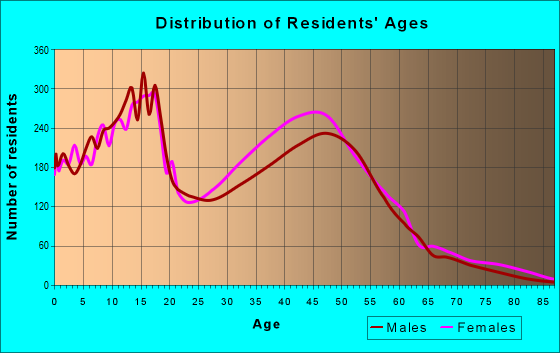
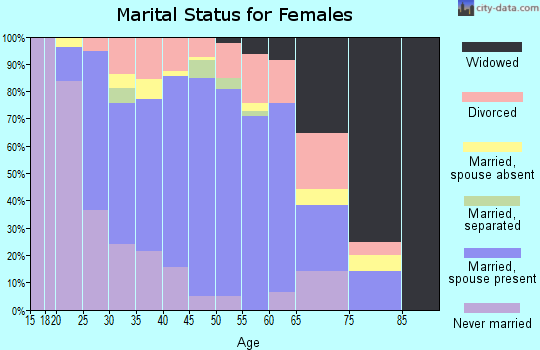
Median resident age:
This zip code:
31.6 years
Texas median age:
35.6 years
Average household size:
This zip code:
3.4 people
Texas:
2.6 people
Averages for the 2020 tax year for zip code 75181, filed in 2021:
Average Adjusted Gross Income (AGI) in 2020: $53,387 (Individual Income Tax Returns)
Here:
$53,387
State:
$77,054
Salary/wage: $50,791 (reported on 87.1% of returns)
Here:
$50,791
State:
$62,766
(% of AGI for various income ranges: 1266.9% for AGIs below $25k, 3795.6% for AGIs $25k-50k, 6830.3% for AGIs $50k-75k, 10112.8% for AGIs $75k-100k, 18321.2% for AGIs $100k-200k, 49165.7% for AGIs over 200k)
Taxable interest for individuals: $781 (reported on 12.9% of returns)
This zip code:
$781
Texas:
$2,665
(% of AGI for various income ranges: 5.0% for AGIs below $25k, 5.9% for AGIs $25k-50k, 17.6% for AGIs $50k-75k, 17.4% for AGIs $75k-100k, 32.4% for AGIs $100k-200k, 290.0% for AGIs over 200k)
Ordinary dividends: $2,073 (reported on 7.1% of returns)
Here:
$2,073
State:
$10,044
(% of AGI for various income ranges: 5.0% for AGIs below $25k, 4.3% for AGIs $25k-50k, 18.4% for AGIs $50k-75k, 31.8% for AGIs $75k-100k, 66.7% for AGIs $100k-200k, 541.4% for AGIs over 200k)
Net capital gain/loss in AGI: +$8,967 (reported on 6.8% of returns)
Here:
+$8,967
State:
+$39,590
(% of AGI for various income ranges: 2.6% for AGIs below $25k, 3.9% for AGIs $25k-50k, 12.6% for AGIs $50k-75k, 33.8% for AGIs $75k-100k, 238.1% for AGIs $100k-200k, 7162.9% for AGIs over 200k)
Profit/loss from business: +$3,511 (reported on 24.9% of returns)
Here:
+$3,511
State:
+$10,888
(% of AGI for various income ranges: 70.8% for AGIs below $25k, 1.8% for AGIs $25k-50k, 120.3% for AGIs $50k-75k, 131.2% for AGIs $75k-100k, 430.1% for AGIs $100k-200k, 2027.1% for AGIs over 200k)
Taxable individual retirement arrangement distribution: $17,596 (reported on 4.1% of returns)
75181:
$17,596
Texas:
$24,740
(% of AGI for various income ranges: 20.5% for AGIs below $25k, 37.6% for AGIs $25k-50k, 99.0% for AGIs $50k-75k, 136.7% for AGIs $75k-100k, 339.0% for AGIs $100k-200k, 2078.6% for AGIs over 200k)
Total itemized deductions: $30,269 (reported on 9.1% of returns)
Here:
$30,269
State:
$40,428
(% of AGI for various income ranges: 35.8% for AGIs below $25k, 179.7% for AGIs $25k-50k, 594.6% for AGIs $50k-75k, 596.2% for AGIs $75k-100k, 1065.1% for AGIs $100k-200k, 5340.0% for AGIs over 200k)
Charity contributions: $10,380 (reported on 7.8% of returns)
Here:
$10,380
State:
$18,201
(% of AGI for various income ranges: 5.8% for AGIs below $25k, 43.2% for AGIs $25k-50k, 145.4% for AGIs $50k-75k, 184.0% for AGIs $75k-100k, 397.7% for AGIs $100k-200k, 1615.7% for AGIs over 200k)
Taxes paid: $6,662 (reported on 9.0% of returns)
75181:
$6,662
State:
$7,821
(% of AGI for various income ranges: 7.4% for AGIs below $25k, 39.9% for AGIs $25k-50k, 135.9% for AGIs $50k-75k, 151.1% for AGIs $75k-100k, 226.2% for AGIs $100k-200k, 721.4% for AGIs over 200k)
Earned income credit: $2,827 (reported on 22.8% of returns)
Here:
$2,827
State:
$2,584
(% of AGI for various income ranges: 154.0% for AGIs below $25k, 99.2% for AGIs $25k-50k, 1.1% for AGIs $50k-75k)
Percentage of individuals using paid preparers for their 2020 taxes: 91.5%
Here:
91%
State:
92%
(% for various income ranges: 91.0% for AGIs below $25k, 92.5% for AGIs $25k-50k, 90.6% for AGIs $50k-75k, 91.5% for AGIs $75k-100k, 92.3% for AGIs $100k-200k, 89.5% for AGIs over 200k)
Averages for the 2012 tax year for zip code 75181, filed in 2013:
Average Adjusted Gross Income (AGI) in 2012: $52,217 (Individual Income Tax Returns)
Here:
$52,217
State:
$65,384
Salary/wage: $49,793 (reported on 90.4% of returns)
Here:
$49,793
State:
$52,524
(% of AGI for various income ranges: 82.3% for AGIs below $25k, 90.2% for AGIs $25k-50k, 89.0% for AGIs $50k-75k, 91.1% for AGIs $75k-100k, 88.2% for AGIs $100k-200k, 51.3% for AGIs over 200k)
Taxable interest for individuals: $706 (reported on 18.6% of returns)
This zip code:
$706
Texas:
$2,372
(% of AGI for various income ranges: 0.6% for AGIs below $25k, 0.2% for AGIs $25k-50k, 0.2% for AGIs $50k-75k, 0.2% for AGIs $75k-100k, 0.2% for AGIs $100k-200k, 0.5% for AGIs over 200k)
Ordinary dividends: $1,884 (reported on 8.5% of returns)
Here:
$1,884
State:
$9,721
(% of AGI for various income ranges: 0.7% for AGIs below $25k, 0.2% for AGIs $25k-50k, 0.3% for AGIs $50k-75k, 0.2% for AGIs $75k-100k, 0.3% for AGIs $100k-200k, 0.5% for AGIs over 200k)
Net capital gain/loss in AGI: +$2,996 (reported on 6.1% of returns)
Here:
+$2,996
State:
+$35,319
(% of AGI for various income ranges: 0.1% for AGIs $100k-200k, 4.4% for AGIs over 200k)
Profit/loss from business: +$4,930 (reported on 20.3% of returns)
Here:
+$4,930
State:
+$13,732
(% of AGI for various income ranges: 8.6% for AGIs below $25k, 2.2% for AGIs $25k-50k, 1.2% for AGIs $50k-75k, 1.2% for AGIs $75k-100k, 1.1% for AGIs $100k-200k, 0.9% for AGIs over 200k)
Taxable individual retirement arrangement distribution: $13,978 (reported on 5.3% of returns)
75181:
$13,978
Texas:
$19,511
(% of AGI for various income ranges: 1.5% for AGIs below $25k, 1.1% for AGIs $25k-50k, 1.2% for AGIs $50k-75k, 1.2% for AGIs $75k-100k, 2.2% for AGIs $100k-200k)
Total itemized deductions: $19,189 (23% of AGI, reported on 36.6% of returns)
Here:
$19,189
State:
$24,724
Here:
23.4% of AGI
State:
15.9% of AGI
(% of AGI for various income ranges: 9.1% for AGIs below $25k, 14.8% for AGIs $25k-50k, 15.9% for AGIs $50k-75k, 14.3% for AGIs $75k-100k, 12.5% for AGIs $100k-200k, 9.9% for AGIs over 200k)
Charity contributions: $4,789 (reported on 30.2% of returns)
Here:
$4,789
State:
$6,808
(% of AGI for various income ranges: 1.1% for AGIs below $25k, 2.3% for AGIs $25k-50k, 2.9% for AGIs $50k-75k, 2.9% for AGIs $75k-100k, 3.2% for AGIs $100k-200k, 3.3% for AGIs over 200k)
Taxes paid: $4,697 (reported on 36.2% of returns)
75181:
$4,697
State:
$6,921
(% of AGI for various income ranges: 1.8% for AGIs below $25k, 3.4% for AGIs $25k-50k, 3.9% for AGIs $50k-75k, 3.5% for AGIs $75k-100k, 3.3% for AGIs $100k-200k, 1.9% for AGIs over 200k)
Earned income credit: $2,520 (reported on 20.6% of returns)
Here:
$2,520
State:
$2,570
(% of AGI for various income ranges: 8.9% for AGIs below $25k, 1.5% for AGIs $25k-50k)
Percentage of individuals using paid preparers for their 2012 taxes: 48.2%
Here:
48%
State:
51%
(% for various income ranges: 48.0% for AGIs below $25k, 49.5% for AGIs $25k-50k, 47.8% for AGIs $50k-75k, 48.0% for AGIs $75k-100k, 45.9% for AGIs $100k-200k, 63.6% for AGIs over 200k)
Averages for the 2004 tax year for zip code 75181, filed in 2005:
Average Adjusted Gross Income (AGI) in 2004: $51,773 (Individual Income Tax Returns)
Here:
$51,773
State:
$47,881
Salary/wage: $51,023 (reported on 92.6% of returns)
Here:
$51,023
State:
$41,947
(% of AGI for various income ranges: 128.9% for AGIs below $10k, 87.2% for AGIs $10k-25k, 92.1% for AGIs $25k-50k, 92.5% for AGIs $50k-75k, 92.8% for AGIs $75k-100k, 87.9% for AGIs over 100k)
Taxable interest for individuals: $635 (reported on 32.6% of returns)
This zip code:
$635
Texas:
$2,255
(% of AGI for various income ranges: 2.0% for AGIs below $10k, 0.8% for AGIs $10k-25k, 0.5% for AGIs $25k-50k, 0.4% for AGIs $50k-75k, 0.3% for AGIs $75k-100k, 0.3% for AGIs over 100k)
Taxable dividends: $838 (reported on 14.2% of returns)
Here:
$838
State:
$4,261
(% of AGI for various income ranges: 1.9% for AGIs below $10k, 0.6% for AGIs $10k-25k, 0.2% for AGIs $25k-50k, 0.2% for AGIs $50k-75k, 0.2% for AGIs $75k-100k, 0.2% for AGIs over 100k)
Net capital gain/loss: +$1,770 (reported on 11.3% of returns)
Here:
+$1,770
State:
+$16,110
(% of AGI for various income ranges: 1.3% for AGIs below $10k, 0.2% for AGIs $10k-25k, 0.1% for AGIs $25k-50k, 0.2% for AGIs $50k-75k, 0.3% for AGIs $75k-100k, 0.8% for AGIs over 100k)
Profit/loss from business: +$5,835 (reported on 19.6% of returns)
Here:
+$5,835
State:
+$11,013
(% of AGI for various income ranges: 4.8% for AGIs below $10k, 3.3% for AGIs $10k-25k, 2.1% for AGIs $25k-50k, 1.8% for AGIs $50k-75k, 1.6% for AGIs $75k-100k, 2.7% for AGIs over 100k)
IRA payment deduction: $2,868 (reported on 2.0% of returns)
75181:
$2,868
Texas:
$3,120
(% of AGI for various income ranges: 0.2% for AGIs $10k-25k, 0.1% for AGIs $25k-50k, 0.2% for AGIs $50k-75k, 0.1% for AGIs $75k-100k, 0.1% for AGIs over 100k)
Self-employed pension: $10,056 (reported on 0.2% of returns)
Here:
$10,056
Texas:
$16,401
Total itemized deductions: $17,319 (23% of AGI, reported on 51.5% of returns)
Here:
$17,319
State:
$19,631
Here:
23.2% of AGI
State:
18.9% of AGI
(% of AGI for various income ranges: 15.1% for AGIs below $10k, 13.7% for AGIs $10k-25k, 19.3% for AGIs $25k-50k, 19.4% for AGIs $50k-75k, 17.8% for AGIs $75k-100k, 14.8% for AGIs over 100k)
Charity contributions deductions: $3,701 (5% of AGI, reported on 43.6% of returns)
Here:
$3,701
State:
$4,753
Here:
4.8% of AGI
State:
4.2% of AGI
(% of AGI for various income ranges: 0.9% for AGIs below $10k, 1.4% for AGIs $10k-25k, 2.9% for AGIs $25k-50k, 3.1% for AGIs $50k-75k, 3.0% for AGIs $75k-100k, 3.7% for AGIs over 100k)
Total tax: $6,400 (reported on 78.0% of returns)
75181:
$6,400
State:
$9,058
(% of AGI for various income ranges: 3.6% for AGIs below $10k, 4.2% for AGIs $10k-25k, 5.5% for AGIs $25k-50k, 7.7% for AGIs $50k-75k, 9.3% for AGIs $75k-100k, 14.9% for AGIs over 100k)
Earned income credit: $1,849 (reported on 13.0% of returns)
Here:
$1,849
State:
$2,024
Percentage of individuals using paid preparers for their 2004 taxes: 49.6%
Here:
50%
State:
57%
(% for various income ranges: 40.9% for AGIs below $10k, 57.7% for AGIs $10k-25k, 54.3% for AGIs $25k-50k, 48.5% for AGIs $50k-75k, 46.6% for AGIs $75k-100k, 45.7% for AGIs over 100k)
Likely homosexual households (counted as self-reported same-sex unmarried-partner households)
Lesbian couples: 0.0% of all households
Gay men: 0.2% of all households
Household received Food Stamps/SNAP in the past 12 months: 712 Household did not receive Food Stamps/SNAP in the past 12 months: 7,676
Women who had a birth in the past 12 months: 529 (360 now married, 168 unmarried) Women who did not have a birth in the past 12 months: 6,292 (3,158 now married, 3,121 unmarried)
Housing units in zip code 75181 with a mortgage: 5,409 (215 second mortgage, 157 both second mortgage and home equity loan) Houses without a mortgage: 18
Median monthly owner costs for units with a mortgage: $2,014 Median monthly owner costs for units without a mortgage: $925
Residents with income below the poverty level in 2022:
This zip code:
7.9%
Whole state:
14.0%
Residents with income below 50% of the poverty level in 2022:
This zip code:
4.9%
Whole state:
7.4%
Median number of rooms in houses and condos:
Here:
7.1
State:
6.3
Median number of rooms in apartments:
Here:
7.2
State:
4.0
Notable locations in this zip code not listed on our city pages
Notable locations in zip code 75181: South Mesquite Creek Wastewater Treatment Plant (A), Mesquite Sewage Disposal (B), Mesquite Fire Department Station 7 (C). Display/hide their locations on the map
Churches in zip code 75181 include: Chapel of Praise Dallas Church (A), Valley View Baptist Church (B), Calvary Temple Assembly of God Church (C), Gethsemane Baptist Church (D), Mesquite Valley Baptist Church (E). Display/hide their locations on the map
In group quarters: 11 (-1 institutionalized population)
Size of family households: 2,151 2-persons, 1,536 3-persons, 1,509 4-persons, 1,145 5-persons, 503 6-persons, 419 7-or-more-persons
Size of nonfamily households: 945 1-person, 94 2-persons
4,856 married couples with children.
2,627 single-parent households (469 men, 2,158 women).
62.3% of residents of 75181 zip code speak English at home.
30.4% of residents speak Spanish at home (68% very well, 14% well, 15% not well, 3% not at all).
1.0% of residents speak other Indo-European language at home (52% very well, 22% well, 26% not well).
4.0% of residents speak Asian or Pacific Island language at home (76% very well, 13% well, 11% not well).
1.7% of residents speak other language at home (83% very well, 8% well, 9% not well).
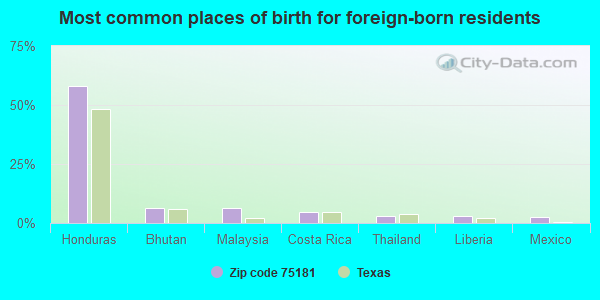
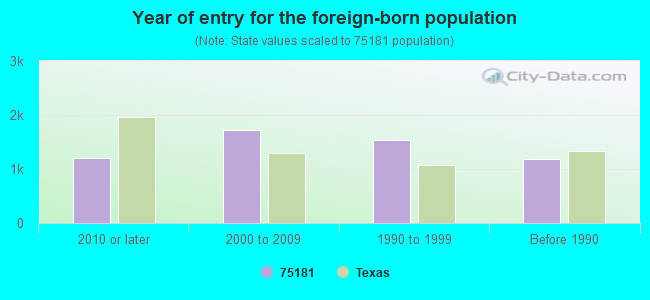
Foreign born population: 5,571 (19.4%) (41.8% of them are naturalized citizens)
Facilities with environmental interests located in this zip code:
A C NEW MIDDLE SCHOOL (3700 S. BELTLINE ROAD in MESQUITE, TX)
(Geographic Names Information System) (National Center for Education Statistics) - STATE ID-057914045 Organizations: MESQUITE ISD (SCHOOL DISTRICT)
Housing units lacking complete plumbing facilities: 1.8% Housing units lacking complete kitchen facilities: 1.4%
51.3%Utility gas
47.6%Electricity
0.6%No fuel used
Population in 1990: 5,005. Population change in the 1990s: +11,220 (+224.2%).
Place of birth for U.S.-born residents:
This state: 17,420
Northeast: 551
Midwest: 1,777
South: 2,249
West: 845
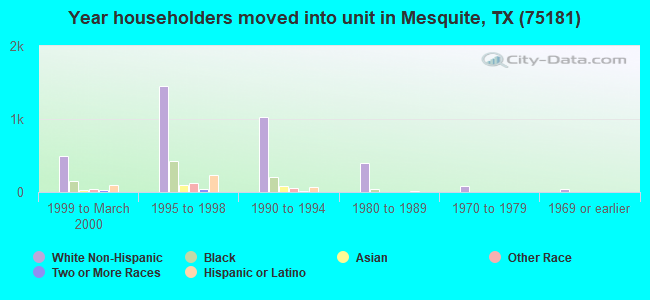
47% of the 75181 zip code residents lived in the same house 5 years ago. Out of people who lived in different houses, 75% lived in this county. Out of people who lived in different counties, 50% lived in Texas.
90% of the 75181 zip code residents lived in the same house 1 year ago. Out of people who lived in different houses, 44% moved from this county. Out of people who lived in different houses, 30% moved from different county within same state. Out of people who lived in different houses, 9% moved from different state. Out of people who lived in different houses, 19% moved from abroad.
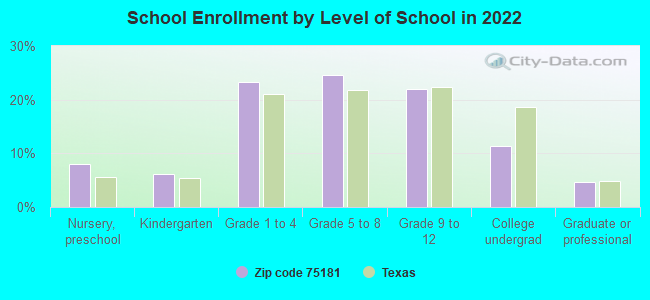
Private vs. public school enrollment:
Students in private schools in grades 1 to 8 (elementary and middle school): 236
Here:
5.5%
Texas:
8.8%
Students in private schools in grades 9 to 12 (high school): 44
Here:
2.3%
Texas:
8.0%
Students in private undergraduate colleges: 109
Here:
10.6%
Texas:
16.2%
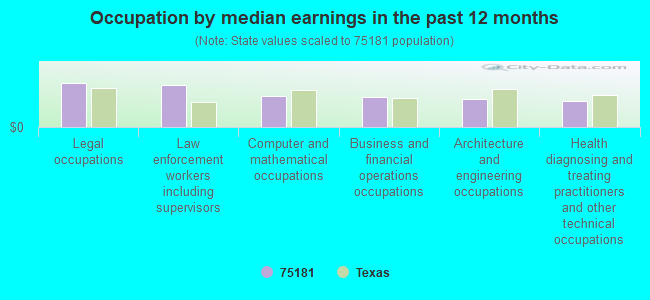
Occupation by median earnings in the past 12 months ($)
125,083Legal occupations
118,823Law enforcement workers including supervisors
88,991Computer and mathematical occupations
84,211Business and financial operations occupations
78,425Architecture and engineering occupations
73,233Health diagnosing and treating practitioners and other technical occupations
Companies with federal contracts located in this zip code:
TEXAS ENG EXTENSION SERVICE (15515 LUBLEY in MESQUITE, TX) : $91,772 in 4 contractsin 2003
$68,068 with Office of the Assistant Secretary for Administration and Management for Other Professional Services. Taking place in DC. Signed on 2003-09-15. Completion date: 2003-09-15.
$50,000 with Occupational Safety and Health Administration for Services -- Basic Research (R&D). Taking place in DC. Signed on 2003-09-15. Completion date: 2003-11-15.
$0 with Occupational Safety and Health Administration for Other Professional Services. Taking place in DC. Signed on 2003-09-15. Completion date: 2003-10-15.
-$26,296, same as above.Signed on 2003-09-15. Completion date: 2003-10-15.
Top industries in this zip code by the number of employees in 2005:
Health Care and Social Assistance: Home Health Care Services (500-999 employees: 1 establishment, 100-249 employees: 1 establishment, 10-19 employees: 1 establishment, 5-9 employees: 3 establishments, 1-4 employees: 3 establishments)
Health Care and Social Assistance: Child Day Care Services (20-49: 2, 10-19: 1, 1-4: 1)
Construction: Water and Sewer Line and Related Structures Construction (50-99: 1, 1-4: 1)
Health Care and Social Assistance: Services for the Elderly and Persons with Disabilities (20-49: 1, 10-19: 1)
Administrative and Support and Waste Management and Remediation Services: Janitorial Services (20-49: 1, 5-9: 1, 1-4: 1)
Administrative and Support and Waste Management and Remediation Services: Security Guards and Patrol Services (20-49: 1, 1-4: 1)
People in group quarters in 2010:
6 people in group homes intended for adults
Fatal accident statistics in 2014:
Fatal accident count: 2
Vehicles involved in fatal accidents: 3
Fatal accidents caused by drunken drivers: 1
Fatalities: 2
Persons involved in fatal accidents: 7
Pedestrians involved in fatal accidents: 0
Fatal accident statistics in 2013:
Fatal accident count: 1
Vehicles involved in fatal accidents: 1
Fatal accidents caused by drunken drivers: 1
Fatalities: 1
Persons involved in fatal accidents: 1
Pedestrians involved in fatal accidents: 0
Home Mortgage Disclosure Act Aggregated Statistics For Year 2009 (Based on 2 full and 10 partial tracts)
A) FHA, FSA/RHS & VA Home Purchase Loans
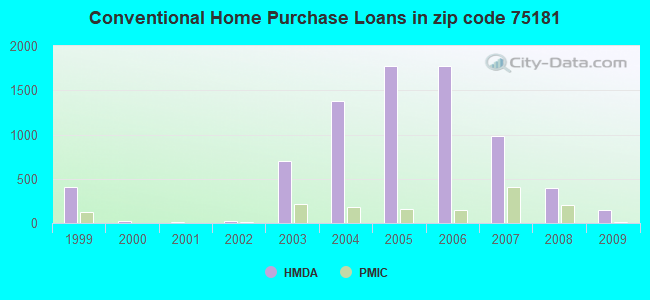
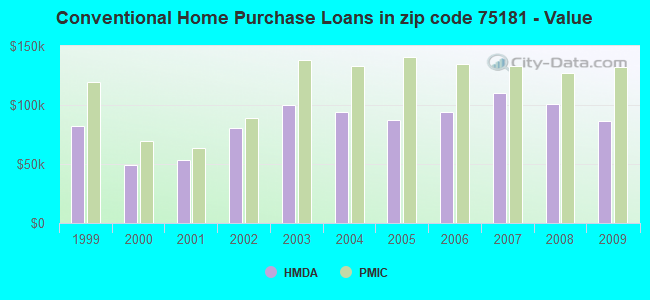
B) Conventional Home Purchase Loans
C) Refinancings
D) Home Improvement Loans
F) Non-occupant Loans on < 5 Family Dwellings (A B C & D)
G) Loans On Manufactured Home Dwelling (A B C & D)
Number
Average Value
Number
Average Value
Number
Average Value
Number
Average Value
Number
Average Value
Number
Average Value
LOANS ORIGINATED
487
$129,860
144
$86,066
583
$126,491
47
$34,235
78
$76,999
13
$28,078
APPLICATIONS APPROVED, NOT ACCEPTED
46
$127,890
22
$84,808
59
$118,924
13
$24,837
13
$87,199
6
$29,558
APPLICATIONS DENIED
137
$130,344
43
$86,986
354
$127,162
54
$32,258
25
$91,642
12
$34,443
APPLICATIONS WITHDRAWN
68
$134,780
22
$75,793
173
$135,380
15
$26,517
13
$95,030
6
$26,392
FILES CLOSED FOR INCOMPLETENESS
16
$123,815
7
$132,561
68
$125,065
13
$67,508
6
$125,455
2
$40,880
Aggregated Statistics For Year 2008 (Based on 2 full and 10 partial tracts)
A) FHA, FSA/RHS & VA Home Purchase Loans
B) Conventional Home Purchase Loans
C) Refinancings
D) Home Improvement Loans
E) Loans on Dwellings For 5+ Families
F) Non-occupant Loans on < 5 Family Dwellings (A B C & D)
G) Loans On Manufactured Home Dwelling (A B C & D)
Number
Average Value
Number
Average Value
Number
Average Value
Number
Average Value
Number
Average Value
Number
Average Value
Number
Average Value
LOANS ORIGINATED
514
$134,918
401
$100,448
451
$126,146
89
$26,305
1
$4,053,810
146
$88,217
28
$23,159
APPLICATIONS APPROVED, NOT ACCEPTED
34
$138,680
32
$136,554
89
$126,834
34
$29,766
0
$0
9
$102,087
4
$54,342
APPLICATIONS DENIED
115
$134,687
123
$118,953
487
$129,223
184
$24,046
0
$0
49
$109,702
15
$63,182
APPLICATIONS WITHDRAWN
92
$140,097
34
$135,986
188
$131,274
15
$39,427
0
$0
17
$90,577
1
$20,450
FILES CLOSED FOR INCOMPLETENESS
12
$116,409
18
$145,569
33
$135,558
7
$73,073
0
$0
3
$66,880
0
$0
Aggregated Statistics For Year 2007 (Based on 2 full and 10 partial tracts)
A) FHA, FSA/RHS & VA Home Purchase Loans
B) Conventional Home Purchase Loans
C) Refinancings
D) Home Improvement Loans
E) Loans on Dwellings For 5+ Families
F) Non-occupant Loans on < 5 Family Dwellings (A B C & D)
G) Loans On Manufactured Home Dwelling (A B C & D)
Number
Average Value
Number
Average Value
Number
Average Value
Number
Average Value
Number
Average Value
Number
Average Value
Number
Average Value
LOANS ORIGINATED
370
$140,372
985
$109,780
455
$114,536
120
$22,786
4
$2,235,922
207
$91,445
5
$56,752
APPLICATIONS APPROVED, NOT ACCEPTED
9
$135,609
142
$106,096
142
$112,525
36
$28,212
0
$0
28
$84,619
8
$65,952
APPLICATIONS DENIED
82
$134,875
378
$110,034
898
$128,379
266
$39,758
0
$0
87
$84,073
12
$22,182
APPLICATIONS WITHDRAWN
46
$142,264
189
$121,673
382
$136,997
22
$54,522
0
$0
47
$87,863
3
$114,397
FILES CLOSED FOR INCOMPLETENESS
5
$147,938
37
$109,626
85
$137,396
7
$11,617
0
$0
7
$114,674
0
$0
Aggregated Statistics For Year 2006 (Based on 2 full and 10 partial tracts)
A) FHA, FSA/RHS & VA Home Purchase Loans
B) Conventional Home Purchase Loans
C) Refinancings
D) Home Improvement Loans
F) Non-occupant Loans on < 5 Family Dwellings (A B C & D)
G) Loans On Manufactured Home Dwelling (A B C & D)
Number
Average Value
Number
Average Value
Number
Average Value
Number
Average Value
Number
Average Value
Number
Average Value
LOANS ORIGINATED
362
$139,560
1,769
$93,970
568
$108,174
145
$25,097
265
$80,773
8
$33,475
APPLICATIONS APPROVED, NOT ACCEPTED
10
$125,758
283
$95,054
151
$112,057
60
$29,264
31
$84,657
2
$65,600
APPLICATIONS DENIED
77
$146,015
573
$102,576
722
$119,457
235
$42,937
105
$80,573
12
$59,340
APPLICATIONS WITHDRAWN
61
$141,381
340
$109,246
456
$128,458
35
$51,963
39
$93,563
2
$183,340
FILES CLOSED FOR INCOMPLETENESS
3
$92,903
72
$112,740
146
$126,366
6
$73,393
20
$88,720
0
$0
Aggregated Statistics For Year 2005 (Based on 2 full and 10 partial tracts)
A) FHA, FSA/RHS & VA Home Purchase Loans
B) Conventional Home Purchase Loans
C) Refinancings
D) Home Improvement Loans
F) Non-occupant Loans on < 5 Family Dwellings (A B C & D)
G) Loans On Manufactured Home Dwelling (A B C & D)
Number
Average Value
Number
Average Value
Number
Average Value
Number
Average Value
Number
Average Value
Number
Average Value
LOANS ORIGINATED
429
$136,957
1,778
$87,528
798
$110,402
122
$51,857
261
$78,356
22
$27,395
APPLICATIONS APPROVED, NOT ACCEPTED
12
$134,642
242
$93,629
148
$105,143
60
$33,524
26
$96,675
8
$30,450
APPLICATIONS DENIED
102
$137,224
539
$86,010
998
$121,024
252
$33,509
82
$76,228
37
$37,235
APPLICATIONS WITHDRAWN
129
$135,244
403
$107,101
558
$138,791
106
$189,565
48
$91,612
7
$88,161
FILES CLOSED FOR INCOMPLETENESS
3
$79,747
64
$94,106
356
$130,358
6
$23,838
14
$100,182
0
$0
Aggregated Statistics For Year 2004 (Based on 2 full and 10 partial tracts)
A) FHA, FSA/RHS & VA Home Purchase Loans
B) Conventional Home Purchase Loans
C) Refinancings
D) Home Improvement Loans
F) Non-occupant Loans on < 5 Family Dwellings (A B C & D)
G) Loans On Manufactured Home Dwelling (A B C & D)
Number
Average Value
Number
Average Value
Number
Average Value
Number
Average Value
Number
Average Value
Number
Average Value
LOANS ORIGINATED
610
$135,951
1,384
$93,883
1,227
$108,134
90
$48,056
184
$87,659
8
$16,082
APPLICATIONS APPROVED, NOT ACCEPTED
5
$117,572
321
$95,692
214
$106,389
12
$29,830
28
$98,295
3
$40,807
APPLICATIONS DENIED
153
$138,528
384
$103,284
1,129
$113,089
154
$37,312
61
$88,483
9
$28,641
APPLICATIONS WITHDRAWN
118
$138,648
287
$113,854
688
$121,517
28
$50,940
33
$107,770
1
$36,950
FILES CLOSED FOR INCOMPLETENESS
7
$134,939
97
$100,840
319
$126,716
11
$53,031
7
$101,514
0
$0
Aggregated Statistics For Year 2003 (Based on 2 full and 10 partial tracts)
A) FHA, FSA/RHS & VA Home Purchase Loans
B) Conventional Home Purchase Loans
C) Refinancings
D) Home Improvement Loans
F) Non-occupant Loans on < 5 Family Dwellings (A B C & D)
Number
Average Value
Number
Average Value
Number
Average Value
Number
Average Value
Number
Average Value
LOANS ORIGINATED
455
$132,910
705
$99,940
2,871
$107,308
111
$31,669
113
$80,747
APPLICATIONS APPROVED, NOT ACCEPTED
9
$132,209
143
$102,250
396
$110,042
59
$38,969
30
$88,238
APPLICATIONS DENIED
141
$139,835
252
$99,052
1,338
$125,468
190
$21,021
35
$88,888
APPLICATIONS WITHDRAWN
123
$138,976
139
$105,289
844
$106,603
9
$68,908
22
$88,543
FILES CLOSED FOR INCOMPLETENESS
27
$145,731
73
$116,467
136
$112,749
0
$0
5
$106,552
Aggregated Statistics For Year 2002 (Based on 4 partial tracts)
A) FHA, FSA/RHS & VA Home Purchase Loans
B) Conventional Home Purchase Loans
C) Refinancings
D) Home Improvement Loans
E) Loans on Dwellings For 5+ Families
F) Non-occupant Loans on < 5 Family Dwellings (A B C & D)
Number
Average Value
Number
Average Value
Number
Average Value
Number
Average Value
Number
Average Value
Number
Average Value
LOANS ORIGINATED
31
$94,439
21
$80,578
48
$60,219
4
$17,302
1
$938,390
6
$50,438
APPLICATIONS APPROVED, NOT ACCEPTED
1
$55,480
4
$73,248
8
$52,989
1
$6,180
0
$0
1
$92,790
APPLICATIONS DENIED
6
$111,910
16
$70,322
28
$56,363
4
$6,098
0
$0
2
$50,495
APPLICATIONS WITHDRAWN
7
$111,717
6
$62,505
25
$61,110
0
$0
0
$0
2
$49,185
FILES CLOSED FOR INCOMPLETENESS
1
$105,520
4
$69,052
5
$72,198
0
$0
0
$0
0
$0
Aggregated Statistics For Year 2001 (Based on 4 partial tracts)
A) FHA, FSA/RHS & VA Home Purchase Loans
B) Conventional Home Purchase Loans
C) Refinancings
D) Home Improvement Loans
F) Non-occupant Loans on < 5 Family Dwellings (A B C & D)
Number
Average Value
Number
Average Value
Number
Average Value
Number
Average Value
Number
Average Value
LOANS ORIGINATED
20
$81,997
13
$53,674
35
$56,801
4
$15,545
7
$50,109
APPLICATIONS APPROVED, NOT ACCEPTED
1
$58,340
4
$66,222
6
$47,198
1
$26,310
1
$31,470
APPLICATIONS DENIED
3
$74,380
27
$43,676
21
$52,512
10
$12,904
3
$61,920
APPLICATIONS WITHDRAWN
1
$112,360
1
$91,530
17
$56,784
1
$4,570
1
$39,440
FILES CLOSED FOR INCOMPLETENESS
0
$0
2
$53,190
2
$70,355
0
$0
0
$0
Aggregated Statistics For Year 2000 (Based on 4 partial tracts)
A) FHA, FSA/RHS & VA Home Purchase Loans
B) Conventional Home Purchase Loans
C) Refinancings
D) Home Improvement Loans
F) Non-occupant Loans on < 5 Family Dwellings (A B C & D)
Number
Average Value
Number
Average Value
Number
Average Value
Number
Average Value
Number
Average Value
LOANS ORIGINATED
29
$71,971
19
$49,421
14
$48,132
3
$10,240
5
$48,832
APPLICATIONS APPROVED, NOT ACCEPTED
2
$55,045
6
$48,343
2
$63,005
2
$13,890
1
$30,110
APPLICATIONS DENIED
4
$68,662
24
$43,650
8
$44,538
10
$12,923
1
$9,390
APPLICATIONS WITHDRAWN
2
$87,720
4
$57,380
10
$53,711
0
$0
1
$40,610
FILES CLOSED FOR INCOMPLETENESS
1
$80,280
2
$40,695
4
$61,222
1
$3,550
0
$0
Aggregated Statistics For Year 1999 (Based on 4 partial tracts)
A) FHA, FSA/RHS & VA Home Purchase Loans
B) Conventional Home Purchase Loans
C) Refinancings
D) Home Improvement Loans
F) Non-occupant Loans on < 5 Family Dwellings (A B C & D)
2002 - 2018 National Fire Incident Reporting System (NFIRS) incidents
According to the data from the years 2002 - 2018 the average number of fires per year is 69. The highest number of reported fires - 99 took place in 2003, and the least - 46 in 2002. The data has a rising trend.
When looking into fire subcategories, the most reports belonged to: Outside Fires (44.0%), and Structure Fires (36.2%).
Fire incident types reported to NFIRS in Zip Code 75181


 Nearest zip codes: 75180, 75253, 75149, 75182, 75126, 75150.


 According to the data from the years 2002 - 2018 the average number of fires per year is 69. The highest number of reported fires - 99 took place in 2003, and the least - 46 in 2002. The data has a rising trend.
 When looking into fire subcategories, the most reports belonged to: Outside Fires (44.0%), and Structure Fires (36.2%).