Estimated zip code population in 2022: 552 Zip code population in 2010: 710 Zip code population in 2000: 599
Houses and condos: 326 Renter-occupied apartments: 43
% of renters here:
14%
State:
35%
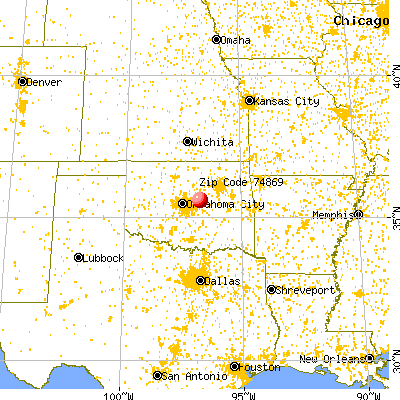
March 2022 cost of living index in zip code 74869: 77.9 (low, U.S. average is 100)
Land area: 53.1 sq. mi. Water area: 1.8 sq. mi.
Population density: 10 people per square mile
(very low).
OSM Map
General Map
Google Map
MSN Map
OSM Map
General Map
Google Map
MSN Map
OSM Map
General Map
Google Map
MSN Map
OSM Map
General Map
Google Map
MSN Map
Please wait while loading the map...
Real estate property taxes paid for housing units in 2022:
This zip code:
0.5% ($595)
Oklahoma:
0.8% ($1,501)
Median real estate property taxes paid for housing units with mortgages in 2022: $626 (0.5%) Median real estate property taxes paid for housing units with no mortgage in 2022: $542 (0.6%)
Business Search- 14 Million verified businesses
Males: 286
(51.8%)
Females: 266
(48.2%)
For population 25 years and over in 74869:
High school or higher: 88.0%
Bachelor's degree or higher: 16.5%
Graduate or professional degree: 2.1%
Unemployed: 1.2%
Mean travel time to work (commute): 30.8 minutes
For population 15 years and over in 74869:
Never married: 14.9%
Now married: 58.9%
Separated: 2.2%
Widowed: 7.0%
Divorced: 17.0%
Zip code 74869 compared to state average:
Median house value below state average.
Unemployed percentage significantly below state average.
Black race population percentage significantly below state average.
Median age significantly above state average.
Renting percentage significantly below state average.
Length of stay since moving in significantly above state average.
Averages for the 2020 tax year for zip code 74869, filed in 2021:
Average Adjusted Gross Income (AGI) in 2020: $45,897 (Individual Income Tax Returns)
Here:
$45,897
State:
$63,060
Salary/wage: $43,600 (reported on 77.4% of returns)
Here:
$43,600
State:
$52,427
(% of AGI for various income ranges: 1096.7% for AGIs below $25k, 3372.5% for AGIs $25k-50k, 6496.0% for AGIs $50k-75k, 11770.0% for AGIs $100k-200k)
Taxable interest for individuals: $343 (reported on 22.6% of returns)
This zip code:
$343
Oklahoma:
$1,603
(% of AGI for various income ranges: 10.0% for AGIs below $25k, 12.5% for AGIs $25k-50k, 10.0% for AGIs $50k-75k)
Net capital gain/loss in AGI: +$2,000 (reported on 6.5% of returns)
Here:
+$2,000
State:
+$19,855
(% of AGI for various income ranges: 44.4% for AGIs below $25k)
Profit/loss from business: +$8,220 (reported on 16.1% of returns)
Here:
+$8,220
State:
+$9,904
(% of AGI for various income ranges: 270.0% for AGIs below $25k, 210.0% for AGIs $25k-50k)
Earned income credit: $2,883 (reported on 19.4% of returns)
Here:
$2,883
State:
$2,435
(% of AGI for various income ranges: 121.1% for AGIs below $25k, 80.0% for AGIs $25k-50k)
Percentage of individuals using paid preparers for their 2020 taxes: 93.5%
Here:
94%
State:
94%
(% for various income ranges: 91.7% for AGIs below $25k, 100.0% for AGIs $25k-50k, 100.0% for AGIs $50k-75k, 75.0% for AGIs $100k-200k)
Averages for the 2012 tax year for zip code 74869, filed in 2013:
Average Adjusted Gross Income (AGI) in 2012: $40,730 (Individual Income Tax Returns)
Here:
$40,730
State:
$58,581
Salary/wage: $39,348 (reported on 83.3% of returns)
Here:
$39,348
State:
$45,973
(% of AGI for various income ranges: 79.9% for AGIs below $25k, 79.9% for AGIs $25k-50k, 80.6% for AGIs $50k-75k, 208.9% for AGIs $75k-100k)
Taxable interest for individuals: $850 (reported on 26.7% of returns)
This zip code:
$850
Oklahoma:
$1,625
(% of AGI for various income ranges: 0.3% for AGIs $25k-50k, 1.6% for AGIs $50k-75k)
Net capital gain/loss in AGI: +$500 (reported on 10.0% of returns)
Here:
+$500
State:
+$24,023
Profit/loss from business: +$4,125 (reported on 13.3% of returns)
Here:
+$4,125
State:
+$11,913
Total itemized deductions: $17,100 (26% of AGI, reported on 20.0% of returns)
Here:
$17,100
State:
$24,882
Here:
25.7% of AGI
State:
18.8% of AGI
(% of AGI for various income ranges: 20.6% for AGIs below $25k, 20.3% for AGIs $50k-75k)
Charity contributions: $2,200 (reported on 10.0% of returns)
Here:
$2,200
State:
$6,591
Taxes paid: $3,483 (reported on 20.0% of returns)
74869:
$3,483
State:
$7,196
Earned income credit: $1,800 (reported on 26.7% of returns)
Here:
$1,800
State:
$2,354
(% of AGI for various income ranges: 5.8% for AGIs below $25k, 1.9% for AGIs $25k-50k)
Percentage of individuals using paid preparers for their 2012 taxes: 63.3%
Here:
63%
State:
56%
(% for various income ranges: 66.7% for AGIs below $25k, 62.5% for AGIs $25k-50k, 66.7% for AGIs $50k-75k, 100.0% for AGIs $75k-100k)
Averages for the 2004 tax year for zip code 74869, filed in 2005:
Average Adjusted Gross Income (AGI) in 2004: $31,381 (Individual Income Tax Returns)
Here:
$31,381
State:
$41,245
Salary/wage: $30,436 (reported on 80.7% of returns)
Here:
$30,436
State:
$35,318
(% of AGI for various income ranges: 77.6% for AGIs below $10k, 69.2% for AGIs $10k-25k, 78.8% for AGIs $25k-50k, 91.6% for AGIs $50k-75k, 156.5% for AGIs $75k-100k)
Taxable interest for individuals: $878 (reported on 33.3% of returns)
This zip code:
$878
Oklahoma:
$1,745
(% of AGI for various income ranges: 2.0% for AGIs below $10k, 0.6% for AGIs $10k-25k, 2.0% for AGIs $25k-50k, 0.1% for AGIs $50k-75k, 0.5% for AGIs $75k-100k)
Taxable dividends: $208 (reported on 8.9% of returns)
Here:
$208
State:
$2,920
Net capital gain/loss: +$1,640 (reported on 9.3% of returns)
Here:
+$1,640
State:
+$10,653
Profit/loss from business: +$4,222 (reported on 13.3% of returns)
Here:
+$4,222
State:
+$8,532
Total itemized deductions: $13,840 (23% of AGI, reported on 18.5% of returns)
Here:
$13,840
State:
$17,093
Here:
22.8% of AGI
State:
20.5% of AGI
Charity contributions deductions: $2,108 (3% of AGI, reported on 13.7% of returns)
Here:
$2,108
State:
$4,240
Here:
3.4% of AGI
State:
4.8% of AGI
Total tax: $3,346 (reported on 69.6% of returns)
74869:
$3,346
State:
$6,542
(% of AGI for various income ranges: 3.2% for AGIs below $10k, 3.7% for AGIs $10k-25k, 5.0% for AGIs $25k-50k, 8.0% for AGIs $50k-75k, 9.3% for AGIs $75k-100k, 15.5% for AGIs over 100k)
Earned income credit: $1,523 (reported on 24.1% of returns)
Here:
$1,523
State:
$1,830
Percentage of individuals using paid preparers for their 2004 taxes: 67.8%
Here:
68%
State:
63%
(% for various income ranges: 65.7% for AGIs below $10k, 64.9% for AGIs $10k-25k, 74.7% for AGIs $25k-50k, 74.1% for AGIs $50k-75k, 92.3% for AGIs $75k-100k)
Household received Food Stamps/SNAP in the past 12 months: 67 Household did not receive Food Stamps/SNAP in the past 12 months: 240
Women who did not have a birth in the past 12 months: 94 (78 now married, 16 unmarried)
Housing units in zip code 74869 with a mortgage: 95 Median monthly owner costs for units with a mortgage: $1,070 Median monthly owner costs for units without a mortgage: $360
Residents with income below the poverty level in 2022:
This zip code:
10.8%
Whole state:
15.7%
Residents with income below 50% of the poverty level in 2022:
This zip code:
4.2%
Whole state:
8.3%
Median number of rooms in houses and condos:
Here:
5.7
State:
6.1
Median number of rooms in apartments:
Here:
5.0
State:
4.5
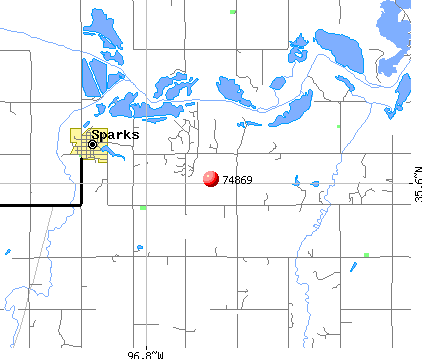
Notable locations in this zip code not listed on our city pages
Lakes and reservoirs: Browns Lake (A), Clark Lake (B), Quapaw Creek Site 3 Reservoir (C), Quapaw Creek Site 2 Reservoir (D), Quapaw Creek Site 1 Reservoir (E), Robinson Creek Site Number 2 Reservoir (F). Display/hide their locations on the map
Size of family households: 137 2-persons, 12 3-persons, 11 4-persons, 7 5-persons, 1 6-persons, 1 7-or-more-persons
Size of nonfamily households: 127 1-person, 4 2-persons
41 married couples with children.
11 single-parent households (11 men).
97.8% of residents of 74869 zip code speak English at home.
2.0% of residents speak Spanish at home (100% very well).
Foreign born population: 25 (4.7%) (69.4% of them are naturalized citizens)
This zip code:
4.7%
Whole state:
6.0%
24%Honduras
4%Hong Kong
25%German
9%English
6%Polish
5%American
4%Irish
4%French
2%Czech
Year of entry for the foreign-born population
22010 or later
52000 to 2009
01990 to 1999
15Before 1990
Housing units lacking complete plumbing facilities: 18.6% Housing units lacking complete kitchen facilities: 12.3%
56.1%Electricity
27.4%Bottled, tank, or LP gas
8.9%Wood
8.6%Utility gas
Population in 1990: 330. Population change in the 1990s: +269 (+81.5%).
Place of birth for U.S.-born residents:
This state: 346
Northeast: 13
Midwest: 32
South: 43
West: 93
63% of the 74869 zip code residents lived in the same house 5 years ago. Out of people who lived in different houses, 36% lived in this county. Out of people who lived in different counties, 50% lived in Oklahoma.
86% of the 74869 zip code residents lived in the same house 1 year ago. Out of people who lived in different houses, 39% moved from this county. Out of people who lived in different houses, 14% moved from different county within same state. Out of people who lived in different houses, 47% moved from different state.
Private vs. public school enrollment:
Students in private schools in grades 1 to 8 (elementary and middle school): 4
Here:
15.0%
Oklahoma:
11.7%
Students in private schools in grades 9 to 12 (high school):
Here:
0.0%
Oklahoma:
11.7%
Students in private undergraduate colleges: 1
Here:
9.1%
Oklahoma:
19.3%
Occupation by median earnings in the past 12 months ($)
43,777Production occupations
40,841Building and grounds cleaning and maintenance occupations
40,556Construction and extraction occupations
39,920Sales and related occupations
38,242Installation, maintenance, and repair occupations
34,618Education, training, and library occupations
Top industries in this zip code by the number of employees in 2005:
Administrative and Support and Waste Management and Remediation Services: Temporary Help Services (1-4 employees: 1 establishment)
Accommodation and Food Services: Full-Service Restaurants (1-4: 1)
Fatal accident statistics in 2014:
Fatal accident count: 1
Vehicles involved in fatal accidents: 1
Fatal accidents caused by drunken drivers: 1
Fatalities: 1
Persons involved in fatal accidents: 2
Pedestrians involved in fatal accidents: 0
Fatal accident statistics in 2013:
Fatal accident count: 1
Vehicles involved in fatal accidents: 1
Fatal accidents caused by drunken drivers: 1
Fatalities: 1
Persons involved in fatal accidents: 1
Pedestrians involved in fatal accidents: 0
Home Mortgage Disclosure Act Aggregated Statistics For Year 2009 (Based on 2 partial tracts)
A) FHA, FSA/RHS & VA Home Purchase Loans
B) Conventional Home Purchase Loans
C) Refinancings
D) Home Improvement Loans
F) Non-occupant Loans on < 5 Family Dwellings (A B C & D)
G) Loans On Manufactured Home Dwelling (A B C & D)
Number
Average Value
Number
Average Value
Number
Average Value
Number
Average Value
Number
Average Value
Number
Average Value
LOANS ORIGINATED
8
$105,431
13
$76,637
37
$77,740
15
$10,733
8
$37,306
5
$50,944
APPLICATIONS APPROVED, NOT ACCEPTED
1
$207,140
2
$86,990
1
$205,700
1
$11,530
0
$0
1
$59,590
APPLICATIONS DENIED
2
$92,755
4
$85,668
10
$120,631
5
$29,124
0
$0
2
$51,185
APPLICATIONS WITHDRAWN
0
$0
0
$0
7
$106,624
0
$0
0
$0
0
$0
FILES CLOSED FOR INCOMPLETENESS
0
$0
0
$0
1
$164,370
0
$0
0
$0
0
$0
Aggregated Statistics For Year 2008 (Based on 2 partial tracts)
A) FHA, FSA/RHS & VA Home Purchase Loans
B) Conventional Home Purchase Loans
C) Refinancings
D) Home Improvement Loans
F) Non-occupant Loans on < 5 Family Dwellings (A B C & D)
G) Loans On Manufactured Home Dwelling (A B C & D)
Number
Average Value
Number
Average Value
Number
Average Value
Number
Average Value
Number
Average Value
Number
Average Value
LOANS ORIGINATED
6
$89,792
21
$86,119
27
$66,234
24
$15,099
14
$51,836
8
$37,548
APPLICATIONS APPROVED, NOT ACCEPTED
0
$0
4
$105,612
2
$81,700
0
$0
1
$55,270
2
$72,330
APPLICATIONS DENIED
1
$151,390
7
$79,161
9
$104,023
4
$27,395
1
$63,440
2
$64,640
APPLICATIONS WITHDRAWN
2
$78,580
2
$128,560
9
$96,868
1
$68,250
1
$70,650
2
$61,275
FILES CLOSED FOR INCOMPLETENESS
0
$0
0
$0
0
$0
0
$0
0
$0
0
$0
Aggregated Statistics For Year 2007 (Based on 2 partial tracts)
A) FHA, FSA/RHS & VA Home Purchase Loans
B) Conventional Home Purchase Loans
C) Refinancings
D) Home Improvement Loans
F) Non-occupant Loans on < 5 Family Dwellings (A B C & D)
G) Loans On Manufactured Home Dwelling (A B C & D)
Number
Average Value
Number
Average Value
Number
Average Value
Number
Average Value
Number
Average Value
Number
Average Value
LOANS ORIGINATED
3
$98,363
34
$84,459
24
$65,141
28
$24,219
10
$39,986
14
$34,912
APPLICATIONS APPROVED, NOT ACCEPTED
0
$0
5
$55,654
3
$104,930
1
$26,430
0
$0
3
$56,070
APPLICATIONS DENIED
1
$170,610
13
$49,317
16
$89,031
5
$43,638
0
$0
10
$39,890
APPLICATIONS WITHDRAWN
0
$0
1
$96,600
4
$103,690
0
$0
0
$0
0
$0
FILES CLOSED FOR INCOMPLETENESS
0
$0
0
$0
1
$183,590
0
$0
0
$0
0
$0
Aggregated Statistics For Year 2006 (Based on 2 partial tracts)
A) FHA, FSA/RHS & VA Home Purchase Loans
B) Conventional Home Purchase Loans
C) Refinancings
D) Home Improvement Loans
F) Non-occupant Loans on < 5 Family Dwellings (A B C & D)
G) Loans On Manufactured Home Dwelling (A B C & D)
Number
Average Value
Number
Average Value
Number
Average Value
Number
Average Value
Number
Average Value
Number
Average Value
LOANS ORIGINATED
6
$79,940
28
$74,081
29
$53,744
25
$23,550
9
$38,716
7
$28,904
APPLICATIONS APPROVED, NOT ACCEPTED
0
$0
11
$88,562
4
$67,285
1
$31,720
1
$83,140
3
$68,727
APPLICATIONS DENIED
1
$73,050
12
$57,112
12
$90,633
4
$55,028
0
$0
4
$58,752
APPLICATIONS WITHDRAWN
0
$0
2
$70,890
13
$103,884
3
$39,570
0
$0
0
$0
FILES CLOSED FOR INCOMPLETENESS
0
$0
0
$0
3
$90,353
0
$0
0
$0
0
$0
Aggregated Statistics For Year 2005 (Based on 2 partial tracts)
A) FHA, FSA/RHS & VA Home Purchase Loans
B) Conventional Home Purchase Loans
C) Refinancings
D) Home Improvement Loans
F) Non-occupant Loans on < 5 Family Dwellings (A B C & D)
G) Loans On Manufactured Home Dwelling (A B C & D)
Number
Average Value
Number
Average Value
Number
Average Value
Number
Average Value
Number
Average Value
Number
Average Value
LOANS ORIGINATED
5
$78,818
30
$67,973
50
$56,788
26
$17,875
11
$45,570
17
$32,624
APPLICATIONS APPROVED, NOT ACCEPTED
0
$0
5
$84,394
2
$55,750
0
$0
0
$0
3
$71,770
APPLICATIONS DENIED
0
$0
9
$63,760
25
$104,232
3
$109,417
1
$138,410
9
$64,934
APPLICATIONS WITHDRAWN
0
$0
6
$92,675
16
$113,331
2
$73,530
0
$0
0
$0
FILES CLOSED FOR INCOMPLETENESS
0
$0
1
$102,850
0
$0
0
$0
0
$0
0
$0
Aggregated Statistics For Year 2004 (Based on 2 partial tracts)
A) FHA, FSA/RHS & VA Home Purchase Loans
B) Conventional Home Purchase Loans
C) Refinancings
D) Home Improvement Loans
F) Non-occupant Loans on < 5 Family Dwellings (A B C & D)
G) Loans On Manufactured Home Dwelling (A B C & D)


 Nearest zip codes: 74026, 74864, 74834, 74855, 74079, 74860.


