Estimated zip code population in 2022: 10,104 Zip code population in 2010: 9,288 Zip code population in 2000: 8,485
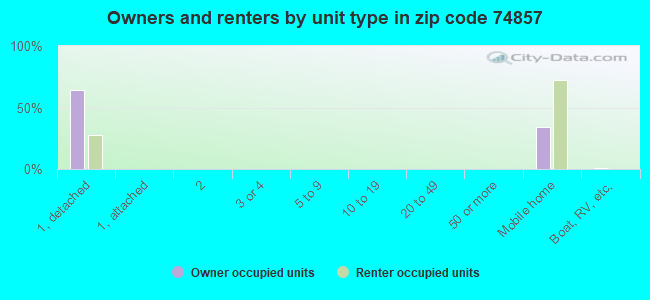
Houses and condos: 4,358 Renter-occupied apartments: 384
% of renters here:
9%
State:
35%
March 2022 cost of living index in zip code 74857: 80.4 (low, U.S. average is 100)
Land area: 60.3 sq. mi. Water area: 0.4 sq. mi.
Population density: 168 people per square mile
(very low).
OSM Map
General Map
Google Map
MSN Map
OSM Map
General Map
Google Map
MSN Map
OSM Map
General Map
Google Map
MSN Map
OSM Map
General Map
Google Map
MSN Map
Please wait while loading the map...
Real estate property taxes paid for housing units in 2022:
This zip code:
0.8% ($1,338)
Oklahoma:
0.8% ($1,501)
Median real estate property taxes paid for housing units with mortgages in 2022: $1,696 (0.7%) Median real estate property taxes paid for housing units with no mortgage in 2022: $963 (0.7%)
Business Search- 14 Million verified businesses
Males: 5,455
(54.0%)
Females: 4,649
(46.0%)
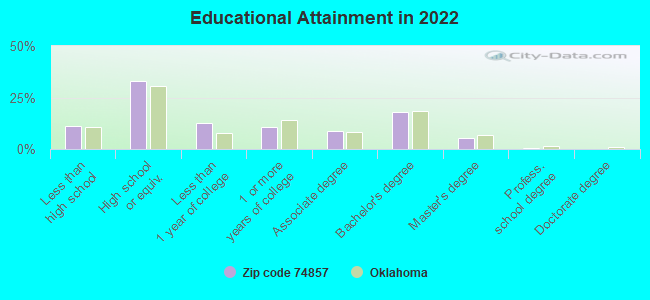
For population 25 years and over in 74857:
High school or higher: 88.9%
Bachelor's degree or higher: 23.6%
Graduate or professional degree: 5.5%
Unemployed: 2.7%
Mean travel time to work (commute): 31.5 minutes
For population 15 years and over in 74857:
Never married: 20.9%
Now married: 60.1%
Separated: 1.3%
Widowed: 6.8%
Divorced: 11.0%
Zip code 74857 compared to state average:
Black race population percentage significantly below state average.
Hispanic race population percentage significantly below state average.
Median age above state average.
Foreign-born population percentage significantly below state average.
Renting percentage significantly below state average.
Length of stay since moving in significantly above state average.
Averages for the 2020 tax year for zip code 74857, filed in 2021:
Average Adjusted Gross Income (AGI) in 2020: $63,288 (Individual Income Tax Returns)
Here:
$63,288
State:
$63,060
Salary/wage: $57,860 (reported on 81.4% of returns)
Here:
$57,860
State:
$52,427
(% of AGI for various income ranges: 1010.4% for AGIs below $25k, 3248.7% for AGIs $25k-50k, 6013.3% for AGIs $50k-75k, 9066.5% for AGIs $75k-100k, 17071.9% for AGIs $100k-200k, 38368.0% for AGIs over 200k)
Taxable interest for individuals: $715 (reported on 32.4% of returns)
This zip code:
$715
Oklahoma:
$1,603
(% of AGI for various income ranges: 10.1% for AGIs below $25k, 12.1% for AGIs $25k-50k, 28.6% for AGIs $50k-75k, 57.0% for AGIs $75k-100k, 58.1% for AGIs $100k-200k, 324.0% for AGIs over 200k)
Ordinary dividends: $2,070 (reported on 10.4% of returns)
Here:
$2,070
State:
$7,001
(% of AGI for various income ranges: 6.1% for AGIs below $25k, 16.2% for AGIs $25k-50k, 15.9% for AGIs $50k-75k, 44.1% for AGIs $75k-100k, 66.0% for AGIs $100k-200k, 358.0% for AGIs over 200k)
Net capital gain/loss in AGI: +$6,620 (reported on 9.3% of returns)
Here:
+$6,620
State:
+$19,855
(% of AGI for various income ranges: 0.8% for AGIs below $25k, 7.9% for AGIs $25k-50k, 49.1% for AGIs $50k-75k, 94.9% for AGIs $75k-100k, 233.5% for AGIs $100k-200k, 1760.0% for AGIs over 200k)
Profit/loss from business: +$7,757 (reported on 15.4% of returns)
Here:
+$7,757
State:
+$9,904
(% of AGI for various income ranges: 110.8% for AGIs below $25k, 166.8% for AGIs $25k-50k, 106.4% for AGIs $50k-75k, 169.7% for AGIs $75k-100k, 311.0% for AGIs $100k-200k)
Taxable individual retirement arrangement distribution: $17,896 (reported on 6.1% of returns)
74857:
$17,896
Oklahoma:
$20,476
(% of AGI for various income ranges: 39.0% for AGIs below $25k, 48.4% for AGIs $25k-50k, 109.8% for AGIs $50k-75k, 227.6% for AGIs $75k-100k, 531.2% for AGIs $100k-200k)
Total itemized deductions: $31,742 (reported on 5.4% of returns)
Here:
$31,742
State:
$39,736
(% of AGI for various income ranges: 86.4% for AGIs below $25k, 127.6% for AGIs $50k-75k, 385.1% for AGIs $75k-100k, 599.2% for AGIs $100k-200k, 3460.0% for AGIs over 200k)
Charity contributions: $11,088 (reported on 3.6% of returns)
Here:
$11,088
State:
$17,288
(% of AGI for various income ranges: 29.0% for AGIs $50k-75k, 85.7% for AGIs $75k-100k, 152.7% for AGIs $100k-200k, 1112.0% for AGIs over 200k)
Taxes paid: $6,254 (reported on 5.4% of returns)
74857:
$6,254
State:
$7,046
(% of AGI for various income ranges: 6.1% for AGIs below $25k, 27.8% for AGIs $50k-75k, 74.9% for AGIs $75k-100k, 147.9% for AGIs $100k-200k, 586.0% for AGIs over 200k)
Earned income credit: $2,294 (reported on 15.9% of returns)
Here:
$2,294
State:
$2,435
(% of AGI for various income ranges: 94.2% for AGIs below $25k, 76.3% for AGIs $25k-50k, 3.3% for AGIs $50k-75k)
Percentage of individuals using paid preparers for their 2020 taxes: 94.3%
Here:
94%
State:
94%
(% for various income ranges: 92.7% for AGIs below $25k, 96.1% for AGIs $25k-50k, 95.9% for AGIs $50k-75k, 94.3% for AGIs $75k-100k, 93.6% for AGIs $100k-200k, 90.9% for AGIs over 200k)
Averages for the 2012 tax year for zip code 74857, filed in 2013:
Average Adjusted Gross Income (AGI) in 2012: $52,859 (Individual Income Tax Returns)
Here:
$52,859
State:
$58,581
Salary/wage: $48,239 (reported on 85.4% of returns)
Here:
$48,239
State:
$45,973
(% of AGI for various income ranges: 73.3% for AGIs below $25k, 79.8% for AGIs $25k-50k, 80.4% for AGIs $50k-75k, 78.3% for AGIs $75k-100k, 81.6% for AGIs $100k-200k, 54.3% for AGIs over 200k)
Taxable interest for individuals: $583 (reported on 31.9% of returns)
This zip code:
$583
Oklahoma:
$1,625
(% of AGI for various income ranges: 0.8% for AGIs below $25k, 0.4% for AGIs $25k-50k, 0.4% for AGIs $50k-75k, 0.3% for AGIs $75k-100k, 0.2% for AGIs $100k-200k, 0.3% for AGIs over 200k)
Ordinary dividends: $1,458 (reported on 10.1% of returns)
Here:
$1,458
State:
$6,374
(% of AGI for various income ranges: 0.2% for AGIs below $25k, 0.5% for AGIs $25k-50k, 0.1% for AGIs $50k-75k, 0.2% for AGIs $75k-100k, 0.4% for AGIs $100k-200k)
Net capital gain/loss in AGI: +$5,257 (reported on 7.5% of returns)
Here:
+$5,257
State:
+$24,023
(% of AGI for various income ranges: 0.1% for AGIs $50k-75k, 0.1% for AGIs $75k-100k, 2.4% for AGIs $100k-200k)
Profit/loss from business: +$6,874 (reported on 14.6% of returns)
Here:
+$6,874
State:
+$11,913
(% of AGI for various income ranges: 7.1% for AGIs below $25k, 2.4% for AGIs $25k-50k, 1.2% for AGIs $50k-75k, 1.3% for AGIs $75k-100k, 1.5% for AGIs $100k-200k)
Taxable individual retirement arrangement distribution: $12,504 (reported on 6.5% of returns)
74857:
$12,504
Oklahoma:
$15,242
(% of AGI for various income ranges: 1.2% for AGIs below $25k, 1.2% for AGIs $25k-50k, 1.6% for AGIs $50k-75k, 1.5% for AGIs $75k-100k, 2.2% for AGIs $100k-200k)
Total itemized deductions: $19,102 (21% of AGI, reported on 28.6% of returns)
Here:
$19,102
State:
$24,882
Here:
20.9% of AGI
State:
18.8% of AGI
(% of AGI for various income ranges: 5.6% for AGIs below $25k, 7.2% for AGIs $25k-50k, 9.6% for AGIs $50k-75k, 12.2% for AGIs $75k-100k, 12.2% for AGIs $100k-200k, 13.1% for AGIs over 200k)
Charity contributions: $3,739 (reported on 20.9% of returns)
Here:
$3,739
State:
$6,591
(% of AGI for various income ranges: 0.6% for AGIs below $25k, 0.8% for AGIs $25k-50k, 1.3% for AGIs $50k-75k, 1.9% for AGIs $75k-100k, 1.9% for AGIs $100k-200k, 1.8% for AGIs over 200k)
Taxes paid: $5,405 (reported on 28.4% of returns)
74857:
$5,405
State:
$7,196
(% of AGI for various income ranges: 0.6% for AGIs below $25k, 1.3% for AGIs $25k-50k, 2.2% for AGIs $50k-75k, 3.1% for AGIs $75k-100k, 4.2% for AGIs $100k-200k, 5.4% for AGIs over 200k)
Earned income credit: $2,210 (reported on 17.8% of returns)
Here:
$2,210
State:
$2,354
(% of AGI for various income ranges: 6.7% for AGIs below $25k, 1.3% for AGIs $25k-50k)
Percentage of individuals using paid preparers for their 2012 taxes: 49.5%
Here:
49%
State:
56%
(% for various income ranges: 43.8% for AGIs below $25k, 51.0% for AGIs $25k-50k, 50.7% for AGIs $50k-75k, 53.2% for AGIs $75k-100k, 55.3% for AGIs $100k-200k, 60.0% for AGIs over 200k)
Averages for the 2004 tax year for zip code 74857, filed in 2005:
Average Adjusted Gross Income (AGI) in 2004: $40,175 (Individual Income Tax Returns)
Here:
$40,175
State:
$41,245
Salary/wage: $38,434 (reported on 88.4% of returns)
Here:
$38,434
State:
$35,318
(% of AGI for various income ranges: 92.8% for AGIs below $10k, 77.5% for AGIs $10k-25k, 84.1% for AGIs $25k-50k, 86.4% for AGIs $50k-75k, 88.6% for AGIs $75k-100k, 81.6% for AGIs over 100k)
Taxable interest for individuals: $587 (reported on 37.2% of returns)
This zip code:
$587
Oklahoma:
$1,745
(% of AGI for various income ranges: 2.1% for AGIs below $10k, 0.7% for AGIs $10k-25k, 0.6% for AGIs $25k-50k, 0.5% for AGIs $50k-75k, 0.6% for AGIs $75k-100k, 0.3% for AGIs over 100k)
Taxable dividends: $739 (reported on 11.5% of returns)
Here:
$739
State:
$2,920
(% of AGI for various income ranges: 1.1% for AGIs below $10k, 0.1% for AGIs $10k-25k, 0.2% for AGIs $25k-50k, 0.1% for AGIs $50k-75k, 0.2% for AGIs $75k-100k, 0.3% for AGIs over 100k)
Net capital gain/loss: +$3,535 (reported on 9.1% of returns)
Here:
+$3,535
State:
+$10,653
(% of AGI for various income ranges: -1.2% for AGIs below $10k, 0.4% for AGIs $10k-25k, 0.2% for AGIs $25k-50k, 0.4% for AGIs $50k-75k, 0.1% for AGIs $75k-100k, 3.4% for AGIs over 100k)
Profit/loss from business: +$4,685 (reported on 17.0% of returns)
Here:
+$4,685
State:
+$8,532
(% of AGI for various income ranges: 8.5% for AGIs below $10k, 6.5% for AGIs $10k-25k, 2.2% for AGIs $25k-50k, 0.6% for AGIs $50k-75k, -0.1% for AGIs $75k-100k, 2.6% for AGIs over 100k)
IRA payment deduction: $3,185 (reported on 1.8% of returns)
74857:
$3,185
Oklahoma:
$3,127
Total itemized deductions: $14,242 (22% of AGI, reported on 35.3% of returns)
Here:
$14,242
State:
$17,093
Here:
21.5% of AGI
State:
20.5% of AGI
(% of AGI for various income ranges: 11.7% for AGIs below $10k, 7.3% for AGIs $10k-25k, 10.7% for AGIs $25k-50k, 13.9% for AGIs $50k-75k, 14.6% for AGIs $75k-100k, 13.7% for AGIs over 100k)
Charity contributions deductions: $2,681 (4% of AGI, reported on 28.3% of returns)
Here:
$2,681
State:
$4,240
Here:
3.9% of AGI
State:
4.8% of AGI
(% of AGI for various income ranges: 0.8% for AGIs below $10k, 0.8% for AGIs $10k-25k, 1.2% for AGIs $25k-50k, 2.1% for AGIs $50k-75k, 2.5% for AGIs $75k-100k, 2.6% for AGIs over 100k)
Total tax: $4,707 (reported on 75.8% of returns)
74857:
$4,707
State:
$6,542
(% of AGI for various income ranges: 3.3% for AGIs below $10k, 4.0% for AGIs $10k-25k, 6.3% for AGIs $25k-50k, 8.3% for AGIs $50k-75k, 10.2% for AGIs $75k-100k, 15.2% for AGIs over 100k)
Earned income credit: $1,870 (reported on 18.2% of returns)
Here:
$1,870
State:
$1,830
Percentage of individuals using paid preparers for their 2004 taxes: 57.5%
Here:
57%
State:
63%
(% for various income ranges: 48.2% for AGIs below $10k, 58.9% for AGIs $10k-25k, 60.0% for AGIs $25k-50k, 61.9% for AGIs $50k-75k, 54.5% for AGIs $75k-100k, 58.1% for AGIs over 100k)
Household received Food Stamps/SNAP in the past 12 months: 322 Household did not receive Food Stamps/SNAP in the past 12 months: 3,703
Women who had a birth in the past 12 months: 66 (68 now married, 0 unmarried) Women who did not have a birth in the past 12 months: 2,013 (1,179 now married, 833 unmarried)
Housing units in zip code 74857 with a mortgage: 2,209 (56 second mortgage, 36 both second mortgage and home equity loan) Houses without a mortgage: 12
Median monthly owner costs for units with a mortgage: $1,447 Median monthly owner costs for units without a mortgage: $447
Residents with income below the poverty level in 2022:
This zip code:
7.9%
Whole state:
15.7%
Residents with income below 50% of the poverty level in 2022:
This zip code:
4.7%
Whole state:
8.3%
Median number of rooms in houses and condos:
Here:
5.8
State:
6.1
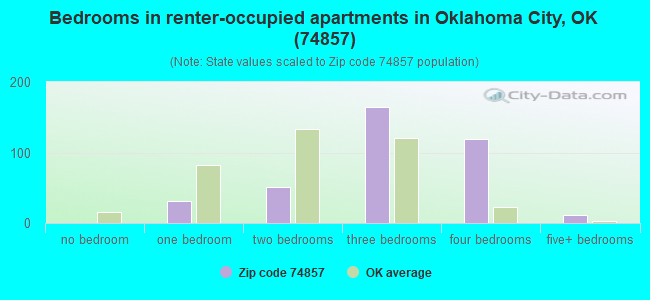
Median number of rooms in apartments:
Here:
5.0
State:
4.5
Notable locations in this zip code not listed on our city pages
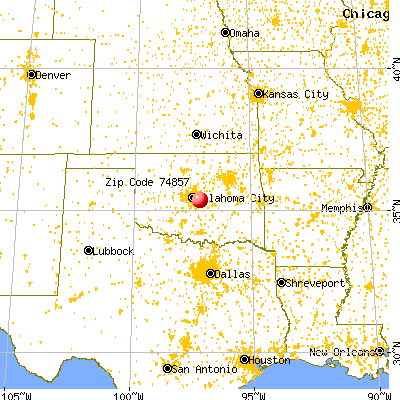
Notable locations in zip code 74857: Newalla Fire Department (A), Oklahoma City Fire Department Station 36 (B), Little Axe Volunteer Fire Department (C). Display/hide their locations on the map
Size of family households: 1,302 2-persons, 683 3-persons, 537 4-persons, 178 5-persons, 96 6-persons, 74 7-or-more-persons
Size of nonfamily households: 862 1-person, 354 2-persons
1,519 married couples with children.
210 single-parent households (133 men, 77 women).
95.4% of residents of 74857 zip code speak English at home.
3.5% of residents speak Spanish at home (71% very well, 15% well, 14% not well).
0.3% of residents speak other Indo-European language at home (11% very well, 39% well, 50% not well).
0.2% of residents speak Asian or Pacific Island language at home (100% very well).
0.3% of residents speak other language at home (100% very well).
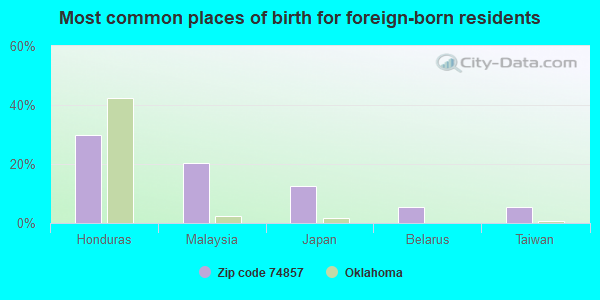
Foreign born population: 128 (1.3%) (93.1% of them are naturalized citizens)
This zip code:
1.3%
Whole state:
6.0%
30%Honduras
20%Malaysia
12%Japan
5%Belarus
5%Taiwan
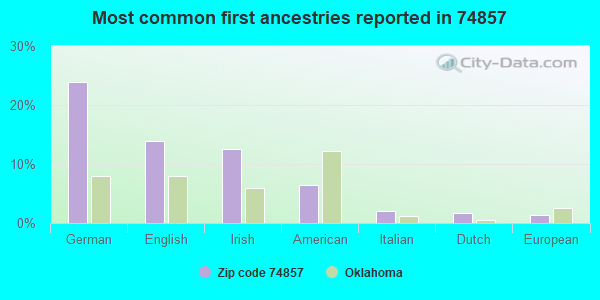
24%German
14%English
13%Irish
6%American
2%Italian
2%Dutch
1%European
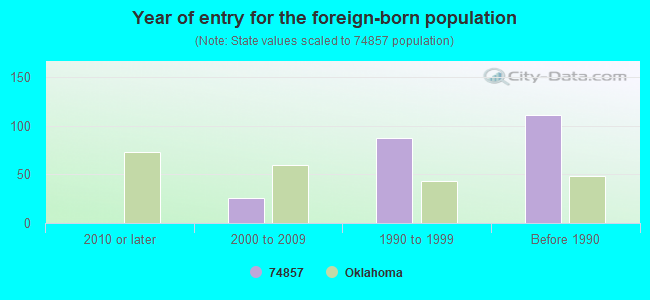
Year of entry for the foreign-born population
02010 or later
262000 to 2009
871990 to 1999
111Before 1990
Housing units lacking complete plumbing facilities: 2.9% Housing units lacking complete kitchen facilities: 1.3%
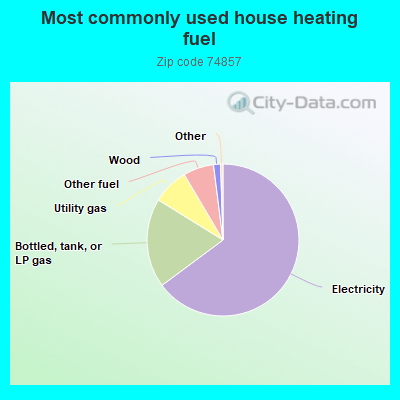
64.9%Electricity
19.0%Bottled, tank, or LP gas
7.7%Utility gas
6.5%Other fuel
1.5%Wood
Population in 1990: 7,768. Population change in the 1990s: +717 (+9.2%).
Place of birth for U.S.-born residents:
This state: 6,368
Northeast: 486
Midwest: 1,350
South: 934
West: 718
61% of the 74857 zip code residents lived in the same house 5 years ago. Out of people who lived in different houses, 40% lived in this county. Out of people who lived in different counties, 50% lived in Oklahoma.
97% of the 74857 zip code residents lived in the same house 1 year ago. Out of people who lived in different houses, 25% moved from this county. Out of people who lived in different houses, 65% moved from different county within same state. Out of people who lived in different houses, 42% moved from different state.
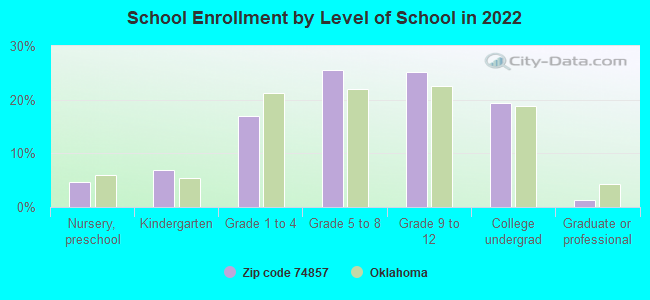
Private vs. public school enrollment:
Students in private schools in grades 1 to 8 (elementary and middle school): 101
Here:
11.0%
Oklahoma:
11.7%
Students in private schools in grades 9 to 12 (high school): 22
Here:
4.1%
Oklahoma:
11.7%
Students in private undergraduate colleges: 47
Here:
11.5%
Oklahoma:
19.3%
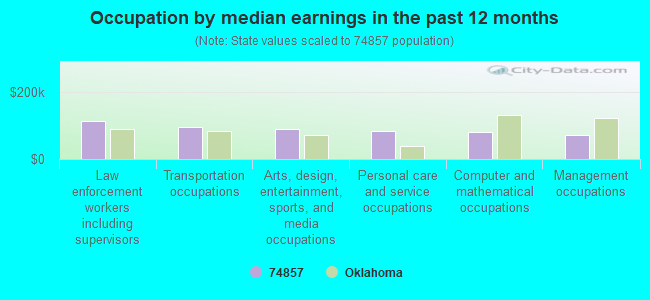
Occupation by median earnings in the past 12 months ($)
113,427Law enforcement workers including supervisors
96,223Transportation occupations
89,441Arts, design, entertainment, sports, and media occupations
84,026Personal care and service occupations
81,711Computer and mathematical occupations
71,018Management occupations
Companies with federal contracts located in this zip code:
SCYRKELS, JANET (17901 MIDNIGHT DRIVE in NEWALLA, OK; small business) : $31,750 in 5 contractsfrom 2004 to 2006
Contracts for Other Administrative Support Services by Army, U.S. Army Corps of Engineers - civil program financing only Signed by year:2000: $0; 2001: $0; 2002: $0; 2003: $0; 2004: $12,700; 2005: $12,700; 2006: $6,350.
Biggest contracts:
$6,350 with Army for Other Administrative Support Services. Signed on 2006-01-24. Completion date: 2004-03-12.
$6,350, same as above.Signed on 2005-02-14. Completion date: 2004-03-12.
$6,350 with U.S. Army Corps of Engineers - civil program financing only for Other Administrative Support Services. Signed on 2005-02-14. Completion date: 2004-03-12.
$6,350 with Army for Other Administrative Support Services. Signed on 2004-03-19. Completion date: 2004-03-12.
ABILEZ DEVELOPMENT, LLC (21205 SE 59TH ST in NEWALLA, OK; small business)
$27,675 with Air Force for Construction of Structures and Facilities -- Other Administrative Facilities and Service Buildings. Signed on 2000-09-22. Completion date: 2000-11-22.
Top industries in this zip code by the number of employees in 2005:
Other Services (except Public Administration): Commercial and Industrial Machinery and Equipment (except Automotive and Electronic) Repair and Maintenance (5-9: 1, 1-4: 1)
Fatal accident statistics in 2013:
Fatal accident count: 2
Vehicles involved in fatal accidents: 3
Fatal accidents caused by drunken drivers: 1
Fatalities: 2
Persons involved in fatal accidents: 4
Pedestrians involved in fatal accidents: 0
Fatal accident statistics in 2011:
Fatal accident count: 3
Vehicles involved in fatal accidents: 6
Fatal accidents caused by drunken drivers: 0
Fatalities: 5
Persons involved in fatal accidents: 15
Pedestrians involved in fatal accidents: 1
Home Mortgage Disclosure Act Aggregated Statistics For Year 2009 (Based on 6 partial tracts)
A) FHA, FSA/RHS & VA Home Purchase Loans
B) Conventional Home Purchase Loans
C) Refinancings
D) Home Improvement Loans
F) Non-occupant Loans on < 5 Family Dwellings (A B C & D)
G) Loans On Manufactured Home Dwelling (A B C & D)
Number
Average Value
Number
Average Value
Number
Average Value
Number
Average Value
Number
Average Value
Number
Average Value
LOANS ORIGINATED
139
$141,333
91
$114,133
370
$131,966
106
$22,471
30
$77,715
114
$60,585
APPLICATIONS APPROVED, NOT ACCEPTED
1
$66,870
12
$145,388
37
$141,289
10
$15,105
0
$0
13
$82,689
APPLICATIONS DENIED
25
$100,965
31
$80,396
162
$128,280
68
$30,769
8
$95,391
54
$69,344
APPLICATIONS WITHDRAWN
18
$150,304
11
$128,087
117
$132,076
13
$57,645
4
$23,135
18
$78,132
FILES CLOSED FOR INCOMPLETENESS
5
$68,494
8
$68,162
27
$136,067
2
$103,130
0
$0
17
$67,353
Aggregated Statistics For Year 2008 (Based on 6 partial tracts)
A) FHA, FSA/RHS & VA Home Purchase Loans
B) Conventional Home Purchase Loans
C) Refinancings
D) Home Improvement Loans
F) Non-occupant Loans on < 5 Family Dwellings (A B C & D)
G) Loans On Manufactured Home Dwelling (A B C & D)
Number
Average Value
Number
Average Value
Number
Average Value
Number
Average Value
Number
Average Value
Number
Average Value
LOANS ORIGINATED
115
$136,690
145
$109,106
227
$109,779
132
$31,710
37
$73,443
131
$61,046
APPLICATIONS APPROVED, NOT ACCEPTED
11
$147,364
25
$79,562
26
$115,397
9
$22,989
6
$40,943
27
$70,670
APPLICATIONS DENIED
25
$107,994
47
$85,744
182
$119,694
83
$37,110
8
$44,250
67
$65,429
APPLICATIONS WITHDRAWN
8
$110,856
25
$82,974
92
$128,130
7
$40,880
4
$95,928
22
$81,799
FILES CLOSED FOR INCOMPLETENESS
0
$0
4
$67,432
11
$107,755
0
$0
0
$0
2
$57,890
Aggregated Statistics For Year 2007 (Based on 6 partial tracts)
A) FHA, FSA/RHS & VA Home Purchase Loans
B) Conventional Home Purchase Loans
C) Refinancings
D) Home Improvement Loans
F) Non-occupant Loans on < 5 Family Dwellings (A B C & D)
G) Loans On Manufactured Home Dwelling (A B C & D)
Number
Average Value
Number
Average Value
Number
Average Value
Number
Average Value
Number
Average Value
Number
Average Value
LOANS ORIGINATED
67
$127,550
220
$113,498
225
$92,997
147
$20,963
30
$54,398
127
$58,251
APPLICATIONS APPROVED, NOT ACCEPTED
12
$88,848
50
$88,596
43
$110,489
19
$30,581
2
$60,275
37
$55,532
APPLICATIONS DENIED
15
$94,223
78
$82,811
219
$108,797
92
$35,946
24
$43,539
78
$64,250
APPLICATIONS WITHDRAWN
6
$90,232
27
$87,810
86
$121,747
13
$49,542
3
$31,200
23
$71,651
FILES CLOSED FOR INCOMPLETENESS
0
$0
1
$220,350
19
$113,251
2
$58,810
0
$0
0
$0
Aggregated Statistics For Year 2006 (Based on 6 partial tracts)
A) FHA, FSA/RHS & VA Home Purchase Loans
B) Conventional Home Purchase Loans
C) Refinancings
D) Home Improvement Loans
F) Non-occupant Loans on < 5 Family Dwellings (A B C & D)
G) Loans On Manufactured Home Dwelling (A B C & D)
Number
Average Value
Number
Average Value
Number
Average Value
Number
Average Value
Number
Average Value
Number
Average Value
LOANS ORIGINATED
109
$118,607
269
$95,990
264
$94,383
171
$27,959
51
$58,665
166
$58,416
APPLICATIONS APPROVED, NOT ACCEPTED
3
$111,840
59
$66,432
43
$112,478
14
$30,274
3
$104,707
41
$54,480
APPLICATIONS DENIED
13
$83,461
124
$75,849
255
$102,103
97
$39,644
15
$88,521
140
$65,384
APPLICATIONS WITHDRAWN
5
$83,358
19
$93,757
139
$114,544
22
$56,690
8
$83,069
21
$66,168
FILES CLOSED FOR INCOMPLETENESS
3
$130,883
5
$99,236
35
$145,734
2
$37,620
0
$0
2
$29,365
Aggregated Statistics For Year 2005 (Based on 6 partial tracts)
A) FHA, FSA/RHS & VA Home Purchase Loans
B) Conventional Home Purchase Loans
C) Refinancings
D) Home Improvement Loans
F) Non-occupant Loans on < 5 Family Dwellings (A B C & D)
G) Loans On Manufactured Home Dwelling (A B C & D)
Number
Average Value
Number
Average Value
Number
Average Value
Number
Average Value
Number
Average Value
Number
Average Value
LOANS ORIGINATED
83
$121,467
241
$92,393
288
$96,659
128
$27,056
42
$58,207
134
$61,481
APPLICATIONS APPROVED, NOT ACCEPTED
10
$100,048
56
$71,472
44
$103,747
7
$23,909
0
$0
44
$61,310
APPLICATIONS DENIED
13
$86,355
98
$57,475
294
$90,135
89
$32,860
19
$56,701
142
$60,887
APPLICATIONS WITHDRAWN
12
$89,067
46
$72,936
190
$106,593
27
$109,887
4
$50,108
28
$54,000
FILES CLOSED FOR INCOMPLETENESS
1
$224,130
5
$82,616
20
$108,249
3
$32,763
0
$0
0
$0
Aggregated Statistics For Year 2004 (Based on 6 partial tracts)
A) FHA, FSA/RHS & VA Home Purchase Loans
B) Conventional Home Purchase Loans
C) Refinancings
D) Home Improvement Loans
F) Non-occupant Loans on < 5 Family Dwellings (A B C & D)
G) Loans On Manufactured Home Dwelling (A B C & D)
Number
Average Value
Number
Average Value
Number
Average Value
Number
Average Value
Number
Average Value
Number
Average Value
LOANS ORIGINATED
111
$106,760
212
$96,073
350
$84,401
117
$24,210
27
$53,249
152
$61,129
APPLICATIONS APPROVED, NOT ACCEPTED
5
$72,490
41
$79,120
75
$100,330
8
$38,621
3
$52,027
22
$59,755
APPLICATIONS DENIED
16
$103,630
107
$59,655
315
$88,673
105
$31,054
9
$49,121
163
$56,863
APPLICATIONS WITHDRAWN
5
$88,238
16
$74,239
166
$96,279
25
$51,200
4
$37,262
27
$82,360
FILES CLOSED FOR INCOMPLETENESS
0
$0
10
$99,331
27
$116,730
3
$39,063
0
$0
2
$78,025
Aggregated Statistics For Year 2003 (Based on 6 partial tracts)
A) FHA, FSA/RHS & VA Home Purchase Loans
B) Conventional Home Purchase Loans
C) Refinancings
D) Home Improvement Loans
F) Non-occupant Loans on < 5 Family Dwellings (A B C & D)
Number
Average Value
Number
Average Value
Number
Average Value
Number
Average Value
Number
Average Value
LOANS ORIGINATED
102
$102,742
204
$87,269
668
$89,767
90
$16,910
33
$48,529
APPLICATIONS APPROVED, NOT ACCEPTED
1
$160,990
50
$77,665
114
$94,415
7
$19,657
3
$120,973
APPLICATIONS DENIED
10
$112,406
104
$53,585
361
$82,619
55
$15,435
10
$44,991
APPLICATIONS WITHDRAWN
5
$126,904
27
$72,181
175
$95,074
8
$21,558
5
$41,174
FILES CLOSED FOR INCOMPLETENESS
2
$89,880
8
$67,268
38
$81,010
1
$25,510
0
$0
Aggregated Statistics For Year 2002 (Based on 4 partial tracts)
A) FHA, FSA/RHS & VA Home Purchase Loans
B) Conventional Home Purchase Loans
C) Refinancings
D) Home Improvement Loans
F) Non-occupant Loans on < 5 Family Dwellings (A B C & D)
Number
Average Value
Number
Average Value
Number
Average Value
Number
Average Value
Number
Average Value
LOANS ORIGINATED
77
$102,433
176
$87,699
403
$84,193
78
$15,751
21
$48,658
APPLICATIONS APPROVED, NOT ACCEPTED
8
$73,875
32
$54,904
82
$97,121
12
$41,286
0
$0
APPLICATIONS DENIED
10
$113,808
65
$55,354
204
$78,347
70
$15,470
10
$28,037
APPLICATIONS WITHDRAWN
0
$0
15
$53,216
102
$82,369
8
$25,008
5
$41,950
FILES CLOSED FOR INCOMPLETENESS
5
$115,782
2
$107,390
47
$98,528
0
$0
0
$0
Aggregated Statistics For Year 2001 (Based on 4 partial tracts)
A) FHA, FSA/RHS & VA Home Purchase Loans
B) Conventional Home Purchase Loans
C) Refinancings
D) Home Improvement Loans
F) Non-occupant Loans on < 5 Family Dwellings (A B C & D)
Number
Average Value
Number
Average Value
Number
Average Value
Number
Average Value
Number
Average Value
LOANS ORIGINATED
89
$94,091
152
$70,619
347
$81,206
70
$14,049
30
$48,790
APPLICATIONS APPROVED, NOT ACCEPTED
3
$55,793
24
$65,440
39
$76,912
7
$14,086
0
$0
APPLICATIONS DENIED
9
$90,637
100
$48,094
188
$69,082
32
$16,943
4
$32,020
APPLICATIONS WITHDRAWN
11
$76,713
16
$75,011
117
$79,774
28
$13,398
3
$75,633
FILES CLOSED FOR INCOMPLETENESS
3
$57,383
4
$53,290
26
$93,143
0
$0
0
$0
Aggregated Statistics For Year 2000 (Based on 4 partial tracts)
A) FHA, FSA/RHS & VA Home Purchase Loans
B) Conventional Home Purchase Loans
C) Refinancings
D) Home Improvement Loans
F) Non-occupant Loans on < 5 Family Dwellings (A B C & D)
Number
Average Value
Number
Average Value
Number
Average Value
Number
Average Value
Number
Average Value
LOANS ORIGINATED
44
$81,309
199
$63,733
165
$64,831
87
$16,150
15
$30,358
APPLICATIONS APPROVED, NOT ACCEPTED
10
$46,593
62
$54,483
49
$69,126
10
$15,664
5
$44,772
APPLICATIONS DENIED
10
$68,160
157
$44,585
138
$67,396
53
$14,140
9
$41,309
APPLICATIONS WITHDRAWN
8
$54,001
12
$70,532
67
$61,111
9
$58,216
3
$57,610
FILES CLOSED FOR INCOMPLETENESS
1
$88,140
0
$0
22
$69,961
3
$20,203
0
$0
Aggregated Statistics For Year 1999 (Based on 3 partial tracts)
A) FHA, FSA/RHS & VA Home Purchase Loans
B) Conventional Home Purchase Loans
C) Refinancings
D) Home Improvement Loans
F) Non-occupant Loans on < 5 Family Dwellings (A B C & D)
2002 - 2018 National Fire Incident Reporting System (NFIRS) incidents
According to the data from the years 2002 - 2018 the average number of fire incidents per year is 75. The highest number of fire incidents - 116 took place in 2008, and the least - 49 in 2007. The data has an increasing trend.
When looking into fire subcategories, the most reports belonged to: Outside Fires (64.3%), and Structure Fires (19.6%).
Fire incident types reported to NFIRS in Zip Code 74857


 Nearest zip codes: 73026, 73020, 74851, 73150, 73165, 73045.


 : $31,750 in 5 contracts from 2004 to 2006


 According to the data from the years 2002 - 2018 the average number of fire incidents per year is 75. The highest number of fire incidents - 116 took place in 2008, and the least - 49 in 2007. The data has an increasing trend.
 When looking into fire subcategories, the most reports belonged to: Outside Fires (64.3%), and Structure Fires (19.6%).