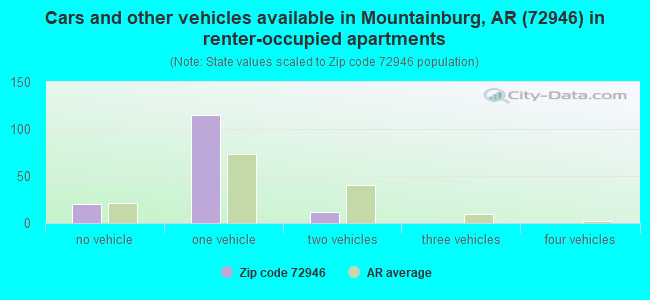
Estimated zip code population in 2022: 3,572 Zip code population in 2010: 3,654 Zip code population in 2000: 3,819
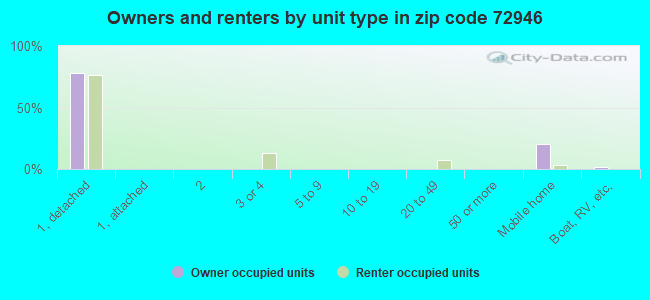
Houses and condos: 1,602 Renter-occupied apartments: 142
% of renters here:
11%
State:
34%
March 2022 cost of living index in zip code 72946: 79.8 (low, U.S. average is 100)
Land area: 96.1 sq. mi. Water area: 1.2 sq. mi.
Population density: 37 people per square mile
(very low).
OSM Map
General Map
Google Map
MSN Map
OSM Map
General Map
Google Map
MSN Map
OSM Map
General Map
Google Map
MSN Map
OSM Map
General Map
Google Map
MSN Map
Please wait while loading the map...
Real estate property taxes paid for housing units in 2022:
This zip code:
0.6% ($806)
Arkansas:
0.5% ($977)
Median real estate property taxes paid for housing units with mortgages in 2022: $1,028 (0.5%) Median real estate property taxes paid for housing units with no mortgage in 2022: $562 (0.6%)
Averages for the 2020 tax year for zip code 72946, filed in 2021:
Average Adjusted Gross Income (AGI) in 2020: $49,361 (Individual Income Tax Returns)
Here:
$49,361
State:
$64,872
Salary/wage: $44,593 (reported on 80.0% of returns)
Here:
$44,593
State:
$50,644
(% of AGI for various income ranges: 1075.4% for AGIs below $25k, 3660.4% for AGIs $25k-50k, 6474.7% for AGIs $50k-75k, 9513.3% for AGIs $75k-100k, 23107.1% for AGIs $100k-200k)
Taxable interest for individuals: $916 (reported on 23.7% of returns)
This zip code:
$916
Arkansas:
$1,857
(% of AGI for various income ranges: 16.9% for AGIs below $25k, 23.8% for AGIs $25k-50k, 5.3% for AGIs $50k-75k, 58.9% for AGIs $75k-100k, 148.6% for AGIs $100k-200k)
Ordinary dividends: $3,335 (reported on 12.6% of returns)
Here:
$3,335
State:
$21,681
(% of AGI for various income ranges: 9.5% for AGIs below $25k, 101.5% for AGIs $25k-50k, 26.0% for AGIs $50k-75k, 82.2% for AGIs $75k-100k, 218.6% for AGIs $100k-200k)
Net capital gain/loss in AGI: +$2,994 (reported on 11.9% of returns)
Here:
+$2,994
State:
+$22,815
(% of AGI for various income ranges: 5.4% for AGIs below $25k, 25.8% for AGIs $25k-50k, 94.0% for AGIs $50k-75k, 357.1% for AGIs $100k-200k)
Profit/loss from business: +$5,683 (reported on 17.0% of returns)
Here:
+$5,683
State:
+$9,743
(% of AGI for various income ranges: 154.4% for AGIs below $25k, 142.7% for AGIs $25k-50k, 172.7% for AGIs $50k-75k, 107.1% for AGIs $100k-200k)
Taxable individual retirement arrangement distribution: $12,345 (reported on 8.1% of returns)
72946:
$12,345
Arkansas:
$18,502
(% of AGI for various income ranges: 69.5% for AGIs below $25k, 177.3% for AGIs $25k-50k, 695.6% for AGIs $75k-100k)
Total itemized deductions: $29,400 (reported on 3.0% of returns)
Here:
$29,400
State:
$52,840
(% of AGI for various income ranges: 1680.0% for AGIs $100k-200k)
Charity contributions: $11,900 (reported on 1.5% of returns)
Here:
$11,900
State:
$35,735
(% of AGI for various income ranges: 158.7% for AGIs $50k-75k)
Taxes paid: $5,475 (reported on 3.0% of returns)
72946:
$5,475
State:
$7,196
(% of AGI for various income ranges: 312.9% for AGIs $100k-200k)
Earned income credit: $2,452 (reported on 23.0% of returns)
Here:
$2,452
State:
$2,546
(% of AGI for various income ranges: 135.4% for AGIs below $25k, 89.2% for AGIs $25k-50k)
Percentage of individuals using paid preparers for their 2020 taxes: 94.1%
Here:
94%
State:
94%
(% for various income ranges: 94.4% for AGIs below $25k, 94.3% for AGIs $25k-50k, 95.0% for AGIs $50k-75k, 92.3% for AGIs $75k-100k, 92.3% for AGIs $100k-200k)
Averages for the 2012 tax year for zip code 72946, filed in 2013:
Average Adjusted Gross Income (AGI) in 2012: $38,888 (Individual Income Tax Returns)
Here:
$38,888
State:
$52,148
Salary/wage: $35,750 (reported on 82.3% of returns)
Here:
$35,750
State:
$41,669
(% of AGI for various income ranges: 72.3% for AGIs below $25k, 78.7% for AGIs $25k-50k, 81.3% for AGIs $50k-75k, 83.4% for AGIs $75k-100k, 62.5% for AGIs $100k-200k)
Taxable interest for individuals: $1,203 (reported on 23.1% of returns)
This zip code:
$1,203
Arkansas:
$1,648
(% of AGI for various income ranges: 0.9% for AGIs below $25k, 1.0% for AGIs $25k-50k, 0.3% for AGIs $50k-75k, 0.7% for AGIs $75k-100k, 0.6% for AGIs $100k-200k)
Ordinary dividends: $1,620 (reported on 11.5% of returns)
Here:
$1,620
State:
$20,675
(% of AGI for various income ranges: 0.8% for AGIs below $25k, 0.2% for AGIs $25k-50k, 0.6% for AGIs $50k-75k, 0.8% for AGIs $100k-200k)
Net capital gain/loss in AGI: +$4,854 (reported on 10.0% of returns)
Here:
+$4,854
State:
+$15,222
(% of AGI for various income ranges: 0.2% for AGIs below $25k, 0.5% for AGIs $25k-50k, 1.1% for AGIs $50k-75k, 3.9% for AGIs $100k-200k)
Profit/loss from business: +$4,214 (reported on 16.9% of returns)
Here:
+$4,214
State:
+$9,665
(% of AGI for various income ranges: 8.9% for AGIs below $25k, 0.2% for AGIs $25k-50k, 0.8% for AGIs $50k-75k, 2.0% for AGIs $75k-100k)
Taxable individual retirement arrangement distribution: $8,273 (reported on 8.5% of returns)
72946:
$8,273
Arkansas:
$13,644
(% of AGI for various income ranges: 1.5% for AGIs below $25k, 2.6% for AGIs $25k-50k, 4.3% for AGIs $50k-75k)
Total itemized deductions: $18,612 (24% of AGI, reported on 18.5% of returns)
Here:
$18,612
State:
$23,276
Here:
23.6% of AGI
State:
19.1% of AGI
(% of AGI for various income ranges: 4.2% for AGIs below $25k, 7.0% for AGIs $25k-50k, 9.0% for AGIs $50k-75k, 11.8% for AGIs $75k-100k, 11.5% for AGIs $100k-200k)
Charity contributions: $3,617 (reported on 13.8% of returns)
Here:
$3,617
State:
$5,996
(% of AGI for various income ranges: 1.2% for AGIs $25k-50k, 1.3% for AGIs $50k-75k, 1.6% for AGIs $75k-100k, 2.0% for AGIs $100k-200k)
Taxes paid: $5,033 (reported on 18.5% of returns)
72946:
$5,033
State:
$7,941
(% of AGI for various income ranges: 0.5% for AGIs below $25k, 1.1% for AGIs $25k-50k, 2.1% for AGIs $50k-75k, 3.2% for AGIs $75k-100k, 4.9% for AGIs $100k-200k)
Earned income credit: $2,309 (reported on 26.2% of returns)
Here:
$2,309
State:
$2,455
(% of AGI for various income ranges: 8.4% for AGIs below $25k, 1.4% for AGIs $25k-50k)
Percentage of individuals using paid preparers for their 2012 taxes: 65.4%
Here:
65%
State:
61%
(% for various income ranges: 60.3% for AGIs below $25k, 63.9% for AGIs $25k-50k, 77.8% for AGIs $50k-75k, 70.0% for AGIs $75k-100k, 75.0% for AGIs $100k-200k)
Averages for the 2004 tax year for zip code 72946, filed in 2005:
Average Adjusted Gross Income (AGI) in 2004: $31,049 (Individual Income Tax Returns)
Here:
$31,049
State:
$39,270
Salary/wage: $29,456 (reported on 83.1% of returns)
Here:
$29,456
State:
$34,079
(% of AGI for various income ranges: 116.4% for AGIs below $10k, 74.1% for AGIs $10k-25k, 85.1% for AGIs $25k-50k, 84.5% for AGIs $50k-75k, 84.1% for AGIs $75k-100k, 48.8% for AGIs over 100k)
Taxable interest for individuals: $1,771 (reported on 29.4% of returns)
This zip code:
$1,771
Arkansas:
$1,904
(% of AGI for various income ranges: 11.5% for AGIs below $10k, 2.6% for AGIs $10k-25k, 1.5% for AGIs $25k-50k, 1.1% for AGIs $50k-75k, 0.2% for AGIs $75k-100k, 1.3% for AGIs over 100k)
Taxable dividends: $1,163 (reported on 13.3% of returns)
Here:
$1,163
State:
$5,995
(% of AGI for various income ranges: 3.6% for AGIs below $10k, 0.4% for AGIs $10k-25k, 0.4% for AGIs $25k-50k, 0.4% for AGIs $50k-75k, 0.1% for AGIs $75k-100k, 0.7% for AGIs over 100k)
Net capital gain/loss: +$3,024 (reported on 12.3% of returns)
Here:
+$3,024
State:
+$10,430
(% of AGI for various income ranges: 0.5% for AGIs below $10k, 0.4% for AGIs $10k-25k, 0.9% for AGIs $25k-50k, 0.3% for AGIs $50k-75k, 5.6% for AGIs over 100k)
Profit/loss from business: +$4,144 (reported on 17.6% of returns)
Here:
+$4,144
State:
+$7,823
(% of AGI for various income ranges: 19.5% for AGIs below $10k, 6.2% for AGIs $10k-25k, 0.5% for AGIs $25k-50k, 2.4% for AGIs $50k-75k, 0.7% for AGIs over 100k)
IRA payment deduction: $3,778 (reported on 2.0% of returns)
72946:
$3,778
Arkansas:
$3,204
Total itemized deductions: $16,314 (27% of AGI, reported on 18.1% of returns)
Here:
$16,314
State:
$18,389
Here:
27.4% of AGI
State:
21.0% of AGI
(% of AGI for various income ranges: 16.7% for AGIs below $10k, 6.1% for AGIs $10k-25k, 7.2% for AGIs $25k-50k, 9.8% for AGIs $50k-75k, 12.7% for AGIs $75k-100k, 15.1% for AGIs over 100k)
Charity contributions deductions: $3,211 (5% of AGI, reported on 13.8% of returns)
Here:
$3,211
State:
$4,725
Here:
5.3% of AGI
State:
5.1% of AGI
(% of AGI for various income ranges: 1.7% for AGIs below $10k, 0.8% for AGIs $10k-25k, 1.1% for AGIs $25k-50k, 1.8% for AGIs $50k-75k, 1.8% for AGIs $75k-100k, 2.0% for AGIs over 100k)
Total tax: $3,714 (reported on 68.3% of returns)
72946:
$3,714
State:
$6,047
(% of AGI for various income ranges: 6.9% for AGIs below $10k, 3.8% for AGIs $10k-25k, 5.8% for AGIs $25k-50k, 8.6% for AGIs $50k-75k, 10.8% for AGIs $75k-100k, 16.9% for AGIs over 100k)
Earned income credit: $1,939 (reported on 23.2% of returns)
Here:
$1,939
State:
$1,909
Percentage of individuals using paid preparers for their 2004 taxes: 70.3%
Here:
70%
State:
67%
(% for various income ranges: 63.8% for AGIs below $10k, 71.1% for AGIs $10k-25k, 72.0% for AGIs $25k-50k, 70.5% for AGIs $50k-75k, 80.4% for AGIs $75k-100k, 88.6% for AGIs over 100k)
Household received Food Stamps/SNAP in the past 12 months: 159 Household did not receive Food Stamps/SNAP in the past 12 months: 1,159
Women who had a birth in the past 12 months: 101 (103 now married, 0 unmarried) Women who did not have a birth in the past 12 months: 690 (324 now married, 366 unmarried)
Housing units in zip code 72946 with a mortgage: 645 (6 second mortgage) Median monthly owner costs for units with a mortgage: $1,142 Median monthly owner costs for units without a mortgage: $308
Residents with income below the poverty level in 2022:
This zip code:
26.2%
Whole state:
16.8%
Residents with income below 50% of the poverty level in 2022:
This zip code:
3.6%
Whole state:
8.5%
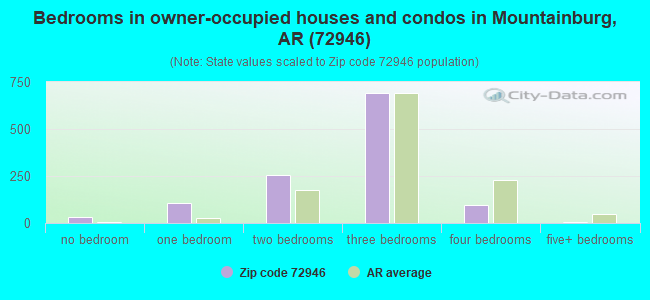
Median number of rooms in houses and condos:
Here:
5.6
State:
6.1
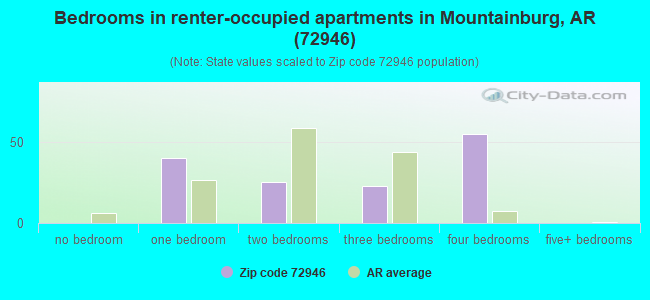
Median number of rooms in apartments:
Here:
4.6
State:
4.3
Notable locations in this zip code not listed on our city pages
Notable locations in zip code 72946: Fort Smith Filtration Plant (A), Mountainburg Shelter (B), Rural District 3 Graphic (C), Rural District 3 Locke (D), Rural District 8 Station 1 (E), Mountainburg Police Department (F), Mountainburg Fire District 3 (G). Display/hide their locations on the map
Churches in zip code 72946 include: Our Lady of the Ozarks Shrine (A), New Hope Church (B), Cain Church (C), Revis Hill Assembly of God Church (D). Display/hide their locations on the map
Cemeteries: Peters Cemetery (1), Pense Cemetery (2), Hillcrest Cemetery (3), Hatfield Cemetery (4), Basham Memorial Cemetery (5), Cain Cemetery (6), Conley Cemetery (7). Display/hide their locations on the map
Reservoirs: Lake Fort Smith (A), Lake Sheppard Spring Reservoir (B), Hammond Lake (C), Lake Shepherd Springs (D), Johnson Lake (E), Mount Gaylor Lake (F). Display/hide their locations on the map
Streams, rivers, and creeks: Cow Branch (A), Clear Creek (B), Campbell Branch (C), Bee Branch (D), Bear Branch (E), Riley Creek (F), Pigeon Creek (G), Jones Fork (H), Jack Creek (I). Display/hide their locations on the map
Size of family households: 463 2-persons, 161 3-persons, 67 4-persons, 105 5-persons, 155 6-persons, 12 7-or-more-persons
Size of nonfamily households: 293 1-person, 72 2-persons
612 married couples with children.
29 single-parent households (15 men, 14 women).
97.0% of residents of 72946 zip code speak English at home.
2.4% of residents speak Spanish at home (100% very well).
0.6% of residents speak other Indo-European language at home (100% very well).
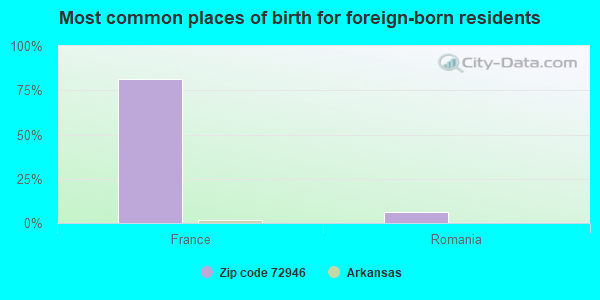
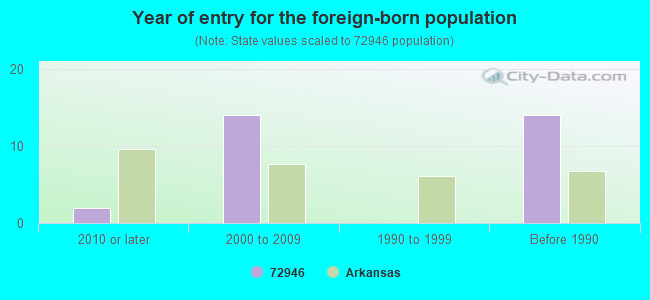
Foreign born population: 16 (0.5%) (100.0% of them are naturalized citizens)
This zip code:
0.5%
Whole state:
5.1%
81%France
6%Romania
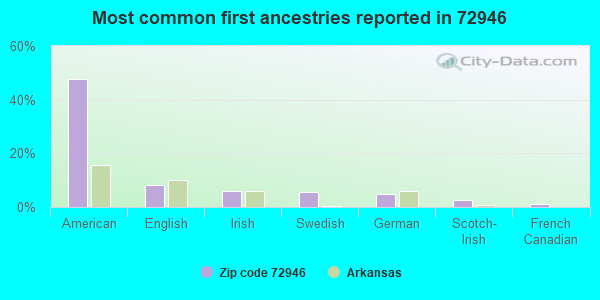
48%American
8%English
6%Irish
6%Swedish
5%German
3%Scotch-Irish
1%French Canadian
Year of entry for the foreign-born population
22010 or later
142000 to 2009
01990 to 1999
14Before 1990
Facilities with environmental interests located in this zip code:
LECTRA CIRCUITS, INC (2700 WINN MOUNTAIN LOOP in MOUNTAINBURG, AR)
STATE MASTER (PDS) - WATER-AR0041068, National Pollutant Discharge Elimination System Permit HAZARDOUS WASTE BIENNIAL REPORTER (Resource Conservation and Recovery Act (tracking hazardous waste)) (Resource Conservation and Recovery Act (tracking hazardous waste)) Business NAICS classification: BARE PRINTED CIRCUIT BOARD MANUFACTURING. Organizations: LECTRA CIRCUITS INC (CONTACT/OPERATOR)
, DWIGHT L FINCHER (CONTACT/OWNER)
Alternative names: LECTRA CIRCUITS INC
Housing units lacking complete plumbing facilities: 3.3% Housing units lacking complete kitchen facilities: 3.1%
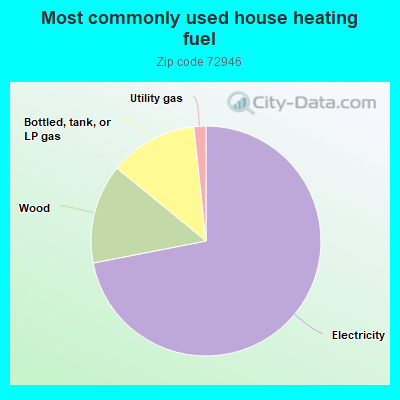
72.0%Electricity
14.0%Wood
12.4%Bottled, tank, or LP gas
1.7%Utility gas
Population in 1990: 4,762.
Place of birth for U.S.-born residents:
This state: 1,851
Northeast: 72
Midwest: 302
South: 903
West: 432
60% of the 72946 zip code residents lived in the same house 5 years ago. Out of people who lived in different houses, 62% lived in this county. Out of people who lived in different counties, 50% lived in Arkansas.
89% of the 72946 zip code residents lived in the same house 1 year ago. Out of people who lived in different houses, 32% moved from this county. Out of people who lived in different houses, 23% moved from different county within same state. Out of people who lived in different houses, 47% moved from different state. Out of people who lived in different houses, 5% moved from abroad.
Private vs. public school enrollment:
Students in private schools in grades 1 to 8 (elementary and middle school): 93
Here:
35.8%
Arkansas:
10.5%
Students in private schools in grades 9 to 12 (high school): 28
Here:
51.0%
Arkansas:
8.7%
Students in private undergraduate colleges:
Here:
0.0%
Arkansas:
19.4%
Occupation by median earnings in the past 12 months ($)
68,601Arts, design, entertainment, sports, and media occupations
58,762Health diagnosing and treating practitioners and other technical occupations
53,025Production occupations
42,721Material moving occupations
42,043Office and administrative support occupations
40,333Installation, maintenance, and repair occupations
Top industries in this zip code by the number of employees in 2005:
Construction: Highway, Street, and Bridge Construction (10-19 employees: 1 establishment, 5-9 employees: 1 establishment)
Professional, Scientific, and Technical Services: Offices of Lawyers (10-19: 1)
Construction: Power and Communication Line and Related Structures Construction (5-9: 1, 1-4: 1)
Wholesale Trade: Motor Vehicle Supplies and New Parts Merchant Wholesalers (5-9: 1)
Construction: Site Preparation Contractors (5-9: 1)
Fatal accident statistics in 2014:
Fatal accident count: 1
Vehicles involved in fatal accidents: 1
Fatal accidents caused by drunken drivers: 1
Fatalities: 1
Persons involved in fatal accidents: 2
Pedestrians involved in fatal accidents: 0
Fatal accident statistics in 2013:
Fatal accident count: 1
Vehicles involved in fatal accidents: 1
Fatal accidents caused by drunken drivers: 0
Fatalities: 1
Persons involved in fatal accidents: 1
Pedestrians involved in fatal accidents: 0
Home Mortgage Disclosure Act Aggregated Statistics For Year 2009 (Based on 2 partial tracts)
A) FHA, FSA/RHS & VA Home Purchase Loans
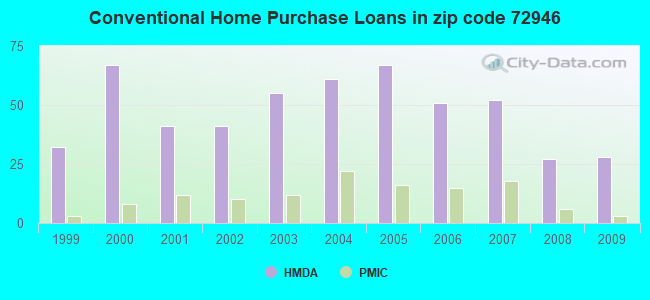
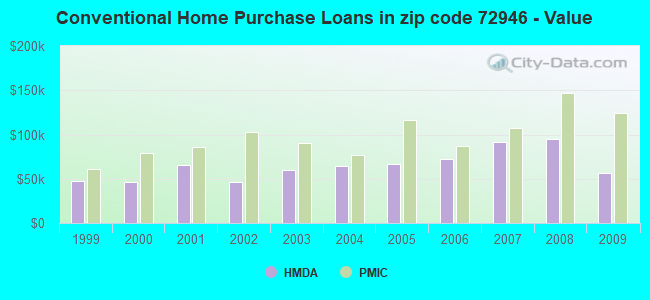
B) Conventional Home Purchase Loans
C) Refinancings
D) Home Improvement Loans
F) Non-occupant Loans on < 5 Family Dwellings (A B C & D)
G) Loans On Manufactured Home Dwelling (A B C & D)
Number
Average Value
Number
Average Value
Number
Average Value
Number
Average Value
Number
Average Value
Number
Average Value
LOANS ORIGINATED
21
$103,336
28
$56,558
86
$91,093
21
$23,621
22
$50,463
20
$33,994
APPLICATIONS APPROVED, NOT ACCEPTED
0
$0
0
$0
4
$84,728
0
$0
0
$0
1
$25,680
APPLICATIONS DENIED
8
$124,010
15
$52,651
25
$105,247
11
$32,771
2
$45,700
14
$45,555
APPLICATIONS WITHDRAWN
2
$77,540
5
$46,216
20
$99,927
0
$0
3
$59,567
1
$64,700
FILES CLOSED FOR INCOMPLETENESS
1
$44,160
1
$187,940
3
$133,510
0
$0
0
$0
0
$0
Aggregated Statistics For Year 2008 (Based on 2 partial tracts)
A) FHA, FSA/RHS & VA Home Purchase Loans
B) Conventional Home Purchase Loans
C) Refinancings
D) Home Improvement Loans
F) Non-occupant Loans on < 5 Family Dwellings (A B C & D)
G) Loans On Manufactured Home Dwelling (A B C & D)
Number
Average Value
Number
Average Value
Number
Average Value
Number
Average Value
Number
Average Value
Number
Average Value
LOANS ORIGINATED
13
$115,893
27
$95,131
82
$92,543
18
$67,383
20
$39,745
23
$39,964
APPLICATIONS APPROVED, NOT ACCEPTED
1
$91,400
3
$44,847
3
$81,817
2
$9,245
0
$0
4
$56,485
APPLICATIONS DENIED
4
$105,268
13
$67,308
44
$84,821
12
$46,814
4
$71,378
17
$56,908
APPLICATIONS WITHDRAWN
1
$74,970
2
$74,460
14
$91,109
3
$35,947
1
$112,970
2
$79,080
FILES CLOSED FOR INCOMPLETENESS
3
$109,547
2
$43,135
7
$81,280
0
$0
0
$0
2
$43,135
Aggregated Statistics For Year 2007 (Based on 2 partial tracts)
A) FHA, FSA/RHS & VA Home Purchase Loans
B) Conventional Home Purchase Loans
C) Refinancings
D) Home Improvement Loans
F) Non-occupant Loans on < 5 Family Dwellings (A B C & D)
G) Loans On Manufactured Home Dwelling (A B C & D)
Number
Average Value
Number
Average Value
Number
Average Value
Number
Average Value
Number
Average Value
Number
Average Value
LOANS ORIGINATED
15
$114,476
52
$91,383
87
$85,678
35
$29,607
30
$56,553
26
$44,240
APPLICATIONS APPROVED, NOT ACCEPTED
1
$23,620
6
$74,287
11
$106,061
3
$122,213
0
$0
6
$83,700
APPLICATIONS DENIED
3
$66,070
31
$71,261
33
$100,335
11
$57,885
4
$129,915
24
$57,084
APPLICATIONS WITHDRAWN
0
$0
3
$79,080
21
$91,599
4
$66,242
1
$54,430
0
$0
FILES CLOSED FOR INCOMPLETENESS
0
$0
0
$0
7
$92,723
2
$89,865
0
$0
0
$0
Aggregated Statistics For Year 2006 (Based on 2 partial tracts)
A) FHA, FSA/RHS & VA Home Purchase Loans
B) Conventional Home Purchase Loans
C) Refinancings
D) Home Improvement Loans
F) Non-occupant Loans on < 5 Family Dwellings (A B C & D)
G) Loans On Manufactured Home Dwelling (A B C & D)
Number
Average Value
Number
Average Value
Number
Average Value
Number
Average Value
Number
Average Value
Number
Average Value
LOANS ORIGINATED
17
$87,054
51
$72,031
107
$70,018
28
$47,132
21
$58,392
22
$49,016
APPLICATIONS APPROVED, NOT ACCEPTED
0
$0
7
$91,110
5
$74,560
2
$97,565
1
$322,480
5
$49,090
APPLICATIONS DENIED
4
$98,592
21
$57,757
30
$82,092
13
$12,008
3
$73,603
10
$41,696
APPLICATIONS WITHDRAWN
2
$94,485
4
$63,160
24
$82,245
0
$0
1
$21,570
0
$0
FILES CLOSED FOR INCOMPLETENESS
1
$96,540
0
$0
1
$51,350
0
$0
0
$0
0
$0
Aggregated Statistics For Year 2005 (Based on 2 partial tracts)
A) FHA, FSA/RHS & VA Home Purchase Loans
B) Conventional Home Purchase Loans
C) Refinancings
D) Home Improvement Loans
F) Non-occupant Loans on < 5 Family Dwellings (A B C & D)
G) Loans On Manufactured Home Dwelling (A B C & D)
Number
Average Value
Number
Average Value
Number
Average Value
Number
Average Value
Number
Average Value
Number
Average Value
LOANS ORIGINATED
7
$79,226
67
$67,184
107
$72,735
31
$32,301
37
$61,898
21
$40,151
APPLICATIONS APPROVED, NOT ACCEPTED
1
$87,300
7
$70,570
15
$69,151
1
$30,810
1
$49,300
4
$69,065
APPLICATIONS DENIED
6
$73,430
33
$65,075
56
$78,657
15
$28,414
5
$57,512
15
$54,979
APPLICATIONS WITHDRAWN
0
$0
7
$97,271
24
$78,052
4
$84,215
0
$0
1
$98,590
FILES CLOSED FOR INCOMPLETENESS
2
$142,755
2
$118,620
2
$57,000
2
$62,645
0
$0
0
$0
Aggregated Statistics For Year 2004 (Based on 2 partial tracts)
A) FHA, FSA/RHS & VA Home Purchase Loans
B) Conventional Home Purchase Loans
C) Refinancings
D) Home Improvement Loans
F) Non-occupant Loans on < 5 Family Dwellings (A B C & D)
G) Loans On Manufactured Home Dwelling (A B C & D)
Number
Average Value
Number
Average Value
Number
Average Value
Number
Average Value
Number
Average Value
Number
Average Value
LOANS ORIGINATED
13
$79,474
61
$64,836
96
$66,926
18
$45,017
27
$52,643
23
$45,411
APPLICATIONS APPROVED, NOT ACCEPTED
1
$61,620
11
$61,154
13
$77,499
1
$57,510
0
$0
6
$35,432
APPLICATIONS DENIED
6
$59,908
26
$52,653
50
$76,121
16
$10,527
2
$63,160
25
$38,738
APPLICATIONS WITHDRAWN
2
$110,405
8
$55,330
35
$86,796
0
$0
1
$71,890
3
$75,313
FILES CLOSED FOR INCOMPLETENESS
1
$65,730
2
$56,485
9
$88,208
0
$0
0
$0
1
$51,350
Aggregated Statistics For Year 2003 (Based on 2 partial tracts)
A) FHA, FSA/RHS & VA Home Purchase Loans
B) Conventional Home Purchase Loans
C) Refinancings
D) Home Improvement Loans
F) Non-occupant Loans on < 5 Family Dwellings (A B C & D)
Number
Average Value
Number
Average Value
Number
Average Value
Number
Average Value
Number
Average Value
LOANS ORIGINATED
16
$70,029
55
$59,771
136
$69,134
32
$15,052
32
$32,800
APPLICATIONS APPROVED, NOT ACCEPTED
1
$42,110
5
$57,102
13
$78,605
0
$0
0
$0
APPLICATIONS DENIED
4
$54,688
41
$56,886
58
$87,029
11
$9,990
4
$58,025
APPLICATIONS WITHDRAWN
1
$132,480
1
$102,700
36
$88,807
1
$20,540
0
$0
FILES CLOSED FOR INCOMPLETENESS
0
$0
1
$64,700
8
$104,754
1
$27,730
1
$60,590
Aggregated Statistics For Year 2002 (Based on 2 partial tracts)
A) FHA, FSA/RHS & VA Home Purchase Loans
B) Conventional Home Purchase Loans
C) Refinancings
D) Home Improvement Loans
F) Non-occupant Loans on < 5 Family Dwellings (A B C & D)
Number
Average Value
Number
Average Value
Number
Average Value
Number
Average Value
Number
Average Value
LOANS ORIGINATED
11
$64,141
41
$46,891
138
$65,654
22
$28,102
23
$33,534
APPLICATIONS APPROVED, NOT ACCEPTED
1
$77,030
12
$44,846
20
$62,801
4
$13,865
0
$0
APPLICATIONS DENIED
3
$71,890
18
$44,218
65
$65,412
12
$9,927
0
$0
APPLICATIONS WITHDRAWN
0
$0
7
$51,057
24
$59,095
1
$5,140
2
$36,970
FILES CLOSED FOR INCOMPLETENESS
0
$0
2
$45,190
8
$70,735
0
$0
1
$18,490
Aggregated Statistics For Year 2001 (Based on 2 partial tracts)
A) FHA, FSA/RHS & VA Home Purchase Loans
B) Conventional Home Purchase Loans
C) Refinancings
D) Home Improvement Loans
F) Non-occupant Loans on < 5 Family Dwellings (A B C & D)
Number
Average Value
Number
Average Value
Number
Average Value
Number
Average Value
Number
Average Value
LOANS ORIGINATED
9
$55,116
41
$65,327
110
$60,966
34
$20,389
17
$49,115
APPLICATIONS APPROVED, NOT ACCEPTED
0
$0
7
$37,999
10
$58,642
3
$44,160
1
$53,400
APPLICATIONS DENIED
1
$61,620
28
$36,789
78
$56,696
13
$11,218
4
$34,405
APPLICATIONS WITHDRAWN
1
$81,130
4
$57,770
22
$59,660
4
$36,715
4
$42,108
FILES CLOSED FOR INCOMPLETENESS
0
$0
1
$30,810
9
$80,334
0
$0
0
$0
Aggregated Statistics For Year 2000 (Based on 2 partial tracts)
A) FHA, FSA/RHS & VA Home Purchase Loans
B) Conventional Home Purchase Loans
C) Refinancings
D) Home Improvement Loans
F) Non-occupant Loans on < 5 Family Dwellings (A B C & D)
Number
Average Value
Number
Average Value
Number
Average Value
Number
Average Value
Number
Average Value
LOANS ORIGINATED
9
$69,266
67
$46,598
68
$66,982
29
$12,147
13
$53,957
APPLICATIONS APPROVED, NOT ACCEPTED
1
$65,730
17
$38,301
13
$67,940
2
$13,865
1
$23,620
APPLICATIONS DENIED
2
$52,890
67
$39,302
65
$48,885
18
$16,660
4
$42,878
APPLICATIONS WITHDRAWN
2
$45,700
5
$67,988
42
$55,874
2
$16,430
0
$0
FILES CLOSED FOR INCOMPLETENESS
0
$0
1
$634,690
6
$72,062
0
$0
0
$0
Aggregated Statistics For Year 1999 (Based on 1 partial tract)
A) FHA, FSA/RHS & VA Home Purchase Loans
B) Conventional Home Purchase Loans
C) Refinancings
D) Home Improvement Loans
E) Loans on Dwellings For 5+ Families
F) Non-occupant Loans on < 5 Family Dwellings (A B C & D)
Detailed PMIC statistics for the following Tracts:0201.00
2002 - 2018 National Fire Incident Reporting System (NFIRS) incidents
Based on the data from the years 2002 - 2018 the average number of fire incidents per year is 31. The highest number of fire incidents - 63 took place in 2017, and the least - 11 in 2004. The data has a growing trend.
When looking into fire subcategories, the most incidents belonged to: Outside Fires (49.7%), and Structure Fires (29.4%).
Fire incident types reported to NFIRS in Zip Code 72946


 Nearest zip codes: 72959, 72947, 72934, 72935, 72952, 72921.
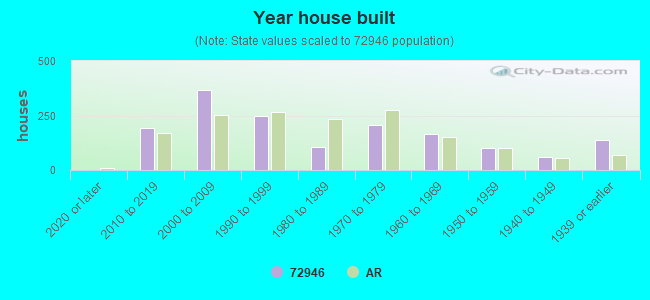


 Based on the data from the years 2002 - 2018 the average number of fire incidents per year is 31. The highest number of fire incidents - 63 took place in 2017, and the least - 11 in 2004. The data has a growing trend.
 When looking into fire subcategories, the most incidents belonged to: Outside Fires (49.7%), and Structure Fires (29.4%).