Estimated zip code population in 2022: 3,274 Zip code population in 2010: 3,858 Zip code population in 2000: 3,278
Houses and condos: 1,525 Renter-occupied apartments: 311
% of renters here:
22%
State:
34%
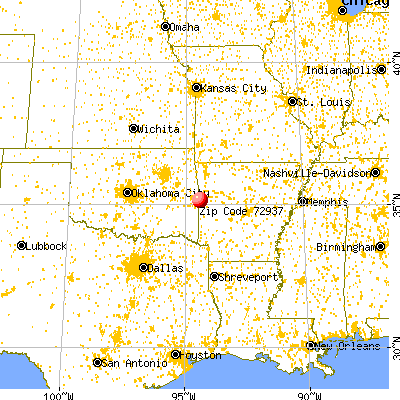
March 2022 cost of living index in zip code 72937: 78.7 (low, U.S. average is 100)
Land area: 64.7 sq. mi. Water area: 1.1 sq. mi.
Population density: 51 people per square mile
(very low).
OSM Map
General Map
Google Map
MSN Map
OSM Map
General Map
Google Map
MSN Map
OSM Map
General Map
Google Map
MSN Map
OSM Map
General Map
Google Map
MSN Map
Please wait while loading the map...
Real estate property taxes paid for housing units in 2022:
This zip code:
0.5% ($717)
Arkansas:
0.5% ($977)
Median real estate property taxes paid for housing units with mortgages in 2022: $730 (0.6%) Median real estate property taxes paid for housing units with no mortgage in 2022: $731 (0.5%)
Business Search- 14 Million verified businesses
Males: 1,665
(50.8%)
Females: 1,609
(49.2%)
For population 25 years and over in 72937:
High school or higher: 78.0%
Bachelor's degree or higher: 12.8%
Graduate or professional degree: 8.5%
Unemployed: 1.7%
Mean travel time to work (commute): 27.5 minutes
For population 15 years and over in 72937:
Never married: 20.8%
Now married: 59.2%
Separated: 3.3%
Widowed: 4.9%
Divorced: 11.8%
Zip code 72937 compared to state average:
Unemployed percentage below state average.
Black race population percentage significantly below state average.
Hispanic race population percentage significantly below state average.
Median age significantly above state average.
Foreign-born population percentage significantly below state average.
Renting percentage below state average.
Length of stay since moving in significantly above state average.
Number of college students below state average.
Percentage of population with a bachelor's degree or higher below state average.
Averages for the 2020 tax year for zip code 72937, filed in 2021:
Average Adjusted Gross Income (AGI) in 2020: $49,974 (Individual Income Tax Returns)
Here:
$49,974
State:
$64,872
Salary/wage: $47,289 (reported on 80.8% of returns)
Here:
$47,289
State:
$50,644
(% of AGI for various income ranges: 1158.0% for AGIs below $25k, 3443.8% for AGIs $25k-50k, 6235.8% for AGIs $50k-75k, 8956.4% for AGIs $75k-100k, 19651.0% for AGIs $100k-200k)
Taxable interest for individuals: $892 (reported on 25.2% of returns)
This zip code:
$892
Arkansas:
$1,857
(% of AGI for various income ranges: 8.5% for AGIs below $25k, 15.3% for AGIs $25k-50k, 17.4% for AGIs $50k-75k, 8.2% for AGIs $75k-100k, 211.0% for AGIs $100k-200k)
Ordinary dividends: $2,081 (reported on 10.6% of returns)
Here:
$2,081
State:
$21,681
(% of AGI for various income ranges: 9.2% for AGIs below $25k, 12.6% for AGIs $25k-50k, 12.6% for AGIs $50k-75k, 56.4% for AGIs $75k-100k, 167.0% for AGIs $100k-200k)
Net capital gain/loss in AGI: +$9,720 (reported on 9.9% of returns)
Here:
+$9,720
State:
+$22,815
(% of AGI for various income ranges: 25.0% for AGIs below $25k, 14.4% for AGIs $25k-50k, 109.5% for AGIs $50k-75k, 1101.0% for AGIs $100k-200k)
Profit/loss from business: +$8,188 (reported on 15.9% of returns)
Here:
+$8,188
State:
+$9,743
(% of AGI for various income ranges: 120.0% for AGIs below $25k, 108.5% for AGIs $25k-50k, 237.9% for AGIs $50k-75k, 119.1% for AGIs $75k-100k, 533.0% for AGIs $100k-200k)
Taxable individual retirement arrangement distribution: $18,408 (reported on 7.9% of returns)
72937:
$18,408
Arkansas:
$18,502
(% of AGI for various income ranges: 77.5% for AGIs below $25k, 120.9% for AGIs $25k-50k, 358.9% for AGIs $50k-75k, 806.0% for AGIs $100k-200k)
Total itemized deductions: $42,120 (reported on 3.3% of returns)
Here:
$42,120
State:
$52,840
(% of AGI for various income ranges: 2106.0% for AGIs $100k-200k)
Charity contributions: $15,333 (reported on 2.0% of returns)
Here:
$15,333
State:
$35,735
(% of AGI for various income ranges: 460.0% for AGIs $100k-200k)
Taxes paid: $6,700 (reported on 3.3% of returns)
72937:
$6,700
State:
$7,196
(% of AGI for various income ranges: 20.8% for AGIs below $25k, 252.0% for AGIs $100k-200k)
Earned income credit: $2,600 (reported on 19.2% of returns)
Here:
$2,600
State:
$2,546
(% of AGI for various income ranges: 107.7% for AGIs below $25k, 95.0% for AGIs $25k-50k)
Percentage of individuals using paid preparers for their 2020 taxes: 96.0%
Here:
96%
State:
94%
(% for various income ranges: 96.3% for AGIs below $25k, 95.2% for AGIs $25k-50k, 95.8% for AGIs $50k-75k, 100.0% for AGIs $75k-100k, 93.8% for AGIs $100k-200k)
Averages for the 2012 tax year for zip code 72937, filed in 2013:
Average Adjusted Gross Income (AGI) in 2012: $40,209 (Individual Income Tax Returns)
Here:
$40,209
State:
$52,148
Salary/wage: $36,257 (reported on 83.9% of returns)
Here:
$36,257
State:
$41,669
(% of AGI for various income ranges: 70.0% for AGIs below $25k, 78.1% for AGIs $25k-50k, 80.8% for AGIs $50k-75k, 77.2% for AGIs $75k-100k, 70.7% for AGIs $100k-200k)
Taxable interest for individuals: $703 (reported on 23.1% of returns)
This zip code:
$703
Arkansas:
$1,648
(% of AGI for various income ranges: 0.9% for AGIs below $25k, 0.6% for AGIs $25k-50k, 0.2% for AGIs $50k-75k, 0.3% for AGIs $75k-100k, 0.1% for AGIs $100k-200k)
Ordinary dividends: $1,185 (reported on 9.1% of returns)
Here:
$1,185
State:
$20,675
(% of AGI for various income ranges: 0.8% for AGIs below $25k, 0.3% for AGIs $25k-50k, 0.5% for AGIs $75k-100k)
Net capital gain/loss in AGI: +$2,712 (reported on 5.6% of returns)
Here:
+$2,712
State:
+$15,222
(% of AGI for various income ranges: 0.5% for AGIs $25k-50k, 1.1% for AGIs $100k-200k)
Profit/loss from business: +$5,148 (reported on 16.1% of returns)
Here:
+$5,148
State:
+$9,665
(% of AGI for various income ranges: 7.7% for AGIs below $25k, 2.9% for AGIs $25k-50k, 0.8% for AGIs $50k-75k, 0.5% for AGIs $75k-100k)
Taxable individual retirement arrangement distribution: $11,938 (reported on 9.1% of returns)
72937:
$11,938
Arkansas:
$13,644
(% of AGI for various income ranges: 3.8% for AGIs below $25k, 3.7% for AGIs $25k-50k, 8.4% for AGIs $75k-100k)
Total itemized deductions: $19,236 (23% of AGI, reported on 19.6% of returns)
Here:
$19,236
State:
$23,276
Here:
23.2% of AGI
State:
19.1% of AGI
(% of AGI for various income ranges: 5.3% for AGIs below $25k, 7.0% for AGIs $25k-50k, 10.0% for AGIs $50k-75k, 10.6% for AGIs $75k-100k, 12.9% for AGIs $100k-200k)
Charity contributions: $3,990 (reported on 14.7% of returns)
Here:
$3,990
State:
$5,996
(% of AGI for various income ranges: 1.3% for AGIs $25k-50k, 1.7% for AGIs $50k-75k, 1.4% for AGIs $75k-100k, 2.2% for AGIs $100k-200k)
Taxes paid: $5,636 (reported on 19.6% of returns)
72937:
$5,636
State:
$7,941
(% of AGI for various income ranges: 0.6% for AGIs below $25k, 1.6% for AGIs $25k-50k, 2.3% for AGIs $50k-75k, 3.2% for AGIs $75k-100k, 5.2% for AGIs $100k-200k)
Earned income credit: $2,497 (reported on 24.5% of returns)
Here:
$2,497
State:
$2,455
(% of AGI for various income ranges: 8.2% for AGIs below $25k, 1.5% for AGIs $25k-50k)
Percentage of individuals using paid preparers for their 2012 taxes: 69.2%
Here:
69%
State:
61%
(% for various income ranges: 65.1% for AGIs below $25k, 75.0% for AGIs $25k-50k, 71.4% for AGIs $50k-75k, 70.0% for AGIs $75k-100k, 66.7% for AGIs $100k-200k)
Averages for the 2004 tax year for zip code 72937, filed in 2005:
Average Adjusted Gross Income (AGI) in 2004: $32,742 (Individual Income Tax Returns)
Here:
$32,742
State:
$39,270
Salary/wage: $32,063 (reported on 87.2% of returns)
Here:
$32,063
State:
$34,079
(% of AGI for various income ranges: 137.7% for AGIs below $10k, 78.7% for AGIs $10k-25k, 86.8% for AGIs $25k-50k, 88.3% for AGIs $50k-75k, 83.5% for AGIs $75k-100k, 71.4% for AGIs over 100k)
Taxable interest for individuals: $781 (reported on 32.3% of returns)
This zip code:
$781
Arkansas:
$1,904
(% of AGI for various income ranges: 4.4% for AGIs below $10k, 1.0% for AGIs $10k-25k, 0.8% for AGIs $25k-50k, 0.5% for AGIs $50k-75k, 0.7% for AGIs $75k-100k, 0.5% for AGIs over 100k)
Taxable dividends: $719 (reported on 11.3% of returns)
Here:
$719
State:
$5,995
(% of AGI for various income ranges: 1.1% for AGIs below $10k, 0.3% for AGIs $10k-25k, 0.2% for AGIs $25k-50k, 0.3% for AGIs $50k-75k, 0.2% for AGIs $75k-100k, 0.2% for AGIs over 100k)
Net capital gain/loss: +$1,426 (reported on 10.4% of returns)
Here:
+$1,426
State:
+$10,430
(% of AGI for various income ranges: -0.2% for AGIs below $10k, -0.1% for AGIs $10k-25k, 0.3% for AGIs $25k-50k, 0.6% for AGIs $50k-75k, 1.4% for AGIs $75k-100k)
Profit/loss from business: +$2,842 (reported on 15.9% of returns)
Here:
+$2,842
State:
+$7,823
(% of AGI for various income ranges: 11.2% for AGIs below $10k, 4.2% for AGIs $10k-25k, 1.3% for AGIs $25k-50k, 0.0% for AGIs $50k-75k, 1.0% for AGIs $75k-100k)
IRA payment deduction: $2,850 (reported on 1.5% of returns)
72937:
$2,850
Arkansas:
$3,204
Total itemized deductions: $13,861 (24% of AGI, reported on 18.6% of returns)
Here:
$13,861
State:
$18,389
Here:
23.6% of AGI
State:
21.0% of AGI
(% of AGI for various income ranges: 4.2% for AGIs $10k-25k, 6.9% for AGIs $25k-50k, 8.6% for AGIs $50k-75k, 10.5% for AGIs $75k-100k, 13.9% for AGIs over 100k)
Charity contributions deductions: $2,764 (4% of AGI, reported on 15.9% of returns)
Here:
$2,764
State:
$4,725
Here:
4.5% of AGI
State:
5.1% of AGI
(% of AGI for various income ranges: 0.4% for AGIs $10k-25k, 1.3% for AGIs $25k-50k, 1.2% for AGIs $50k-75k, 1.5% for AGIs $75k-100k, 4.3% for AGIs over 100k)
Total tax: $3,369 (reported on 73.4% of returns)
72937:
$3,369
State:
$6,047
(% of AGI for various income ranges: 4.8% for AGIs below $10k, 3.6% for AGIs $10k-25k, 6.0% for AGIs $25k-50k, 8.0% for AGIs $50k-75k, 10.3% for AGIs $75k-100k, 16.1% for AGIs over 100k)
Earned income credit: $1,864 (reported on 20.1% of returns)
Here:
$1,864
State:
$1,909
Percentage of individuals using paid preparers for their 2004 taxes: 71.6%
Here:
72%
State:
67%
(% for various income ranges: 69.8% for AGIs below $10k, 70.1% for AGIs $10k-25k, 70.7% for AGIs $25k-50k, 72.3% for AGIs $50k-75k, 86.8% for AGIs $75k-100k, 79.2% for AGIs over 100k)
Household received Food Stamps/SNAP in the past 12 months: 227 Household did not receive Food Stamps/SNAP in the past 12 months: 1,169
Women who had a birth in the past 12 months: 33 (24 now married, 9 unmarried) Women who did not have a birth in the past 12 months: 714 (328 now married, 386 unmarried)
Housing units in zip code 72937 with a mortgage: 401 (2 second mortgage, 1 home equity loan) Median monthly owner costs for units with a mortgage: $1,075 Median monthly owner costs for units without a mortgage: $456
Residents with income below the poverty level in 2022:
This zip code:
12.8%
Whole state:
16.8%
Residents with income below 50% of the poverty level in 2022:
This zip code:
10.6%
Whole state:
8.5%
Median number of rooms in houses and condos:
Here:
5.9
State:
6.1
Median number of rooms in apartments:
Here:
5.0
State:
4.3
Notable locations in this zip code not listed on our city pages
Notable locations in zip code 72937: Sugarloaf - Slaytonville Fire Station (A), Hackett Police Department (B), Hackett Volunteer Fire Department (C). Display/hide their locations on the map
Churches in zip code 72937 include: New Providence Church (A), Pleasant Hill Church (B), Amity Church (C), Old Union Church (D), Mount Zion Baptist Church (E). Display/hide their locations on the map
Cemeteries: Mount Zineche Cemetery (1), Mount View Cemetery (2), Doubleday Cemetery (3), Clark Cemetery (4), Pleasant Valley Cemetery (5), Begum Cemetery (6), Ramsey Cemetery (7). Display/hide their locations on the map
Streams, rivers, and creeks: Mackenay Creek (A), Hackett Creek (B), Emert Branch (C), Haw Branch (D), Elder Branch (E), Johnson Branch (F). Display/hide their locations on the map
Size of family households: 467 2-persons, 159 3-persons, 234 4-persons, 50 5-persons, 61 6-persons, 7 7-or-more-persons
Size of nonfamily households: 332 1-person, 52 2-persons, 30 3-persons
351 married couples with children.
140 single-parent households (25 men, 115 women).
99.2% of residents of 72937 zip code speak English at home.
0.2% of residents speak other language at home (100% very well).
Foreign born population: 2 (0.1%) (100.0% of them are naturalized citizens)
This zip code:
0.1%
Whole state:
5.1%
50%Honduras
27%American
8%English
3%European
3%German
2%Irish
1%Northern European
1%Scotch-Irish
Year of entry for the foreign-born population
02010 or later
02000 to 2009
01990 to 1999
25Before 1990
Facilities with environmental interests located in this zip code:
HACKETT, CITY OF (102 N MAIN (E OF HWY 10) in HACKETT, AR)
National Pollutant Discharge Elimination System NON-MAJOR (Tracking pollutant discharge elimination systems) - permit STATE MASTER (PDS) - WATER-AR0039781, National Pollutant Discharge Elimination System Permit Business SIC classification: SEWERAGE SYSTEMS
HACKETT ELEMENTARY SCHOOL (102 NORTH OAK STREET in HACKETT, AR)
(Geographic Names Information System) (National Center for Education Statistics) - STATE ID-6603047
HACKETT HIGH SCHOOL (102 NORTH OAK STREET in HACKETT, AR)
(Geographic Names Information System) (National Center for Education Statistics) - STATE ID-6603048
SEBASTIAN LAKE UTILITY CO, INC (8700 BLOCK OF WEST BETHEL ROAD in HACKETT, AR)
National Pollutant Discharge Elimination System NON-MAJOR (Tracking pollutant discharge elimination systems) - permit Business SIC classification: LAND SUBDIVIDERS AND DEVELOPERS, EXCEPT CEMETERIES
Housing units lacking complete plumbing facilities: 6.4% Housing units lacking complete kitchen facilities: 5.1%
67.6%Electricity
23.1%Utility gas
5.1%Wood
3.1%Bottled, tank, or LP gas
1.3%Fuel oil, kerosene, etc.
Population in 1990: 1,587. Population change in the 1990s: +1,691 (+106.6%).
Place of birth for U.S.-born residents:
This state: 2,093
Northeast: 45
Midwest: 240
South: 489
West: 384
58% of the 72937 zip code residents lived in the same house 5 years ago. Out of people who lived in different houses, 58% lived in this county. Out of people who lived in different counties, 50% lived in Arkansas.
96% of the 72937 zip code residents lived in the same house 1 year ago. Out of people who lived in different houses, 36% moved from this county. Out of people who lived in different houses, 45% moved from different county within same state. Out of people who lived in different houses, 28% moved from different state.
Private vs. public school enrollment:
Students in private schools in grades 1 to 8 (elementary and middle school): 29
Here:
15.8%
Arkansas:
10.5%
Students in private schools in grades 9 to 12 (high school):
Here:
0.0%
Arkansas:
8.7%
Students in private undergraduate colleges: 5
Here:
9.2%
Arkansas:
19.4%
Occupation by median earnings in the past 12 months ($)
239,238Health diagnosing and treating practitioners and other technical occupations
64,493Architecture and engineering occupations
63,264Sales and related occupations
60,901Education, training, and library occupations
58,190Business and financial operations occupations
56,146Production occupations
Companies with federal contracts located in this zip code:
DUBOISE ELECTRIC (204 S MAIN ST in HACKETT, AR; small business) 2 employees, $84000 revenue.
$13,000 with Agricultural Research Service (disused code) for Maintenance, Repair or Alteration of Real Property -- Other Non-Building Facilities. Signed on 2000-02-15. Completion date: 2000-05-15.
Top industries in this zip code by the number of employees in 2005:
Construction: Other Building Equipment Contractors (20-49 employees: 1 establishment, 10-19 employees: 1 establishment)
Other Services (except Public Administration): Other Automotive Mechanical and Electrical Repair and Maintenance (20-49: 1)
Health Care and Social Assistance: Child Day Care Services (5-9: 1, 1-4: 1)
Real Estate and Rental and Leasing: Video Tape and Disc Rental (5-9: 1, 1-4: 1)
Construction: Water and Sewer Line and Related Structures Construction (5-9: 1)
Other Services (except Public Administration): Drycleaning and Laundry Services (except Coin-Operated) (5-9: 1)
Construction: Plumbing, Heating, and Air-Conditioning Contractors (1-4: 2)
Fatal accident statistics in 2014:
Fatal accident count: 2
Vehicles involved in fatal accidents: 3
Fatal accidents caused by drunken drivers: 1
Fatalities: 2
Persons involved in fatal accidents: 7
Pedestrians involved in fatal accidents: 0
Home Mortgage Disclosure Act Aggregated Statistics For Year 2009 (Based on 4 partial tracts)
A) FHA, FSA/RHS & VA Home Purchase Loans
B) Conventional Home Purchase Loans
C) Refinancings
D) Home Improvement Loans
F) Non-occupant Loans on < 5 Family Dwellings (A B C & D)
G) Loans On Manufactured Home Dwelling (A B C & D)
Number
Average Value
Number
Average Value
Number
Average Value
Number
Average Value
Number
Average Value
Number
Average Value
LOANS ORIGINATED
50
$157,365
56
$124,695
144
$136,568
37
$25,732
16
$80,244
14
$40,020
APPLICATIONS APPROVED, NOT ACCEPTED
3
$115,743
9
$85,183
3
$224,120
3
$48,467
2
$43,035
4
$55,175
APPLICATIONS DENIED
5
$148,198
18
$42,719
47
$121,747
16
$15,876
3
$30,917
17
$42,557
APPLICATIONS WITHDRAWN
2
$107,845
7
$89,673
35
$131,368
6
$45,315
3
$74,130
2
$20,030
FILES CLOSED FOR INCOMPLETENESS
1
$97,760
1
$61,550
5
$158,338
0
$0
1
$41,300
0
$0
Aggregated Statistics For Year 2008 (Based on 4 partial tracts)
A) FHA, FSA/RHS & VA Home Purchase Loans
B) Conventional Home Purchase Loans
C) Refinancings
D) Home Improvement Loans
F) Non-occupant Loans on < 5 Family Dwellings (A B C & D)
G) Loans On Manufactured Home Dwelling (A B C & D)
Number
Average Value
Number
Average Value
Number
Average Value
Number
Average Value
Number
Average Value
Number
Average Value
LOANS ORIGINATED
32
$140,646
72
$144,111
96
$125,454
48
$31,666
21
$149,263
14
$53,999
APPLICATIONS APPROVED, NOT ACCEPTED
1
$117,150
6
$71,442
4
$136,150
2
$17,995
1
$83,730
6
$62,450
APPLICATIONS DENIED
7
$157,731
21
$73,470
39
$106,901
9
$19,472
7
$85,207
16
$58,304
APPLICATIONS WITHDRAWN
2
$140,340
10
$69,059
25
$105,871
3
$30,867
6
$70,512
2
$47,750
FILES CLOSED FOR INCOMPLETENESS
0
$0
0
$0
5
$152,252
0
$0
0
$0
0
$0
Aggregated Statistics For Year 2007 (Based on 4 partial tracts)
A) FHA, FSA/RHS & VA Home Purchase Loans
B) Conventional Home Purchase Loans
C) Refinancings
D) Home Improvement Loans
F) Non-occupant Loans on < 5 Family Dwellings (A B C & D)
G) Loans On Manufactured Home Dwelling (A B C & D)
Number
Average Value
Number
Average Value
Number
Average Value
Number
Average Value
Number
Average Value
Number
Average Value
LOANS ORIGINATED
22
$105,986
89
$104,809
110
$124,904
66
$35,039
32
$64,326
25
$45,709
APPLICATIONS APPROVED, NOT ACCEPTED
0
$0
8
$98,364
5
$109,400
4
$21,660
0
$0
6
$89,473
APPLICATIONS DENIED
3
$61,727
27
$88,733
40
$134,987
14
$13,794
5
$100,838
12
$75,580
APPLICATIONS WITHDRAWN
2
$129,045
7
$132,140
27
$129,489
10
$34,996
5
$101,788
3
$33,030
FILES CLOSED FOR INCOMPLETENESS
0
$0
0
$0
5
$104,512
1
$43,390
0
$0
0
$0
Aggregated Statistics For Year 2006 (Based on 4 partial tracts)
A) FHA, FSA/RHS & VA Home Purchase Loans
B) Conventional Home Purchase Loans
C) Refinancings
D) Home Improvement Loans
E) Loans on Dwellings For 5+ Families
F) Non-occupant Loans on < 5 Family Dwellings (A B C & D)
G) Loans On Manufactured Home Dwelling (A B C & D)
Number
Average Value
Number
Average Value
Number
Average Value
Number
Average Value
Number
Average Value
Number
Average Value
Number
Average Value
LOANS ORIGINATED
21
$99,691
90
$121,945
101
$91,670
63
$28,989
2
$53,245
19
$58,114
19
$40,185
APPLICATIONS APPROVED, NOT ACCEPTED
3
$55,623
17
$59,198
9
$94,806
5
$31,882
0
$0
1
$42,140
12
$43,398
APPLICATIONS DENIED
2
$89,400
35
$65,110
43
$75,474
17
$16,825
0
$0
3
$36,543
23
$46,550
APPLICATIONS WITHDRAWN
3
$83,727
15
$83,669
28
$101,274
6
$46,970
0
$0
3
$41,797
1
$71,420
FILES CLOSED FOR INCOMPLETENESS
0
$0
2
$101,580
8
$90,718
0
$0
0
$0
0
$0
0
$0
Aggregated Statistics For Year 2005 (Based on 4 partial tracts)
A) FHA, FSA/RHS & VA Home Purchase Loans
B) Conventional Home Purchase Loans
C) Refinancings
D) Home Improvement Loans
F) Non-occupant Loans on < 5 Family Dwellings (A B C & D)
G) Loans On Manufactured Home Dwelling (A B C & D)
Number
Average Value
Number
Average Value
Number
Average Value
Number
Average Value
Number
Average Value
Number
Average Value
LOANS ORIGINATED
18
$94,673
86
$96,666
127
$111,930
69
$38,326
29
$56,469
28
$42,329
APPLICATIONS APPROVED, NOT ACCEPTED
2
$40,705
12
$53,674
11
$98,052
3
$32,147
1
$59,290
10
$40,507
APPLICATIONS DENIED
2
$54,765
27
$63,565
51
$89,723
12
$35,514
4
$61,738
17
$39,735
APPLICATIONS WITHDRAWN
1
$134,420
12
$86,364
36
$112,062
6
$95,102
2
$67,845
1
$48,880
FILES CLOSED FOR INCOMPLETENESS
1
$79,380
1
$121,660
6
$98,122
0
$0
1
$106,920
0
$0
Aggregated Statistics For Year 2004 (Based on 4 partial tracts)
A) FHA, FSA/RHS & VA Home Purchase Loans
B) Conventional Home Purchase Loans
C) Refinancings
D) Home Improvement Loans
F) Non-occupant Loans on < 5 Family Dwellings (A B C & D)
G) Loans On Manufactured Home Dwelling (A B C & D)
Number
Average Value
Number
Average Value
Number
Average Value
Number
Average Value
Number
Average Value
Number
Average Value
LOANS ORIGINATED
23
$83,142
81
$107,366
169
$95,840
55
$29,174
34
$57,058
32
$43,379
APPLICATIONS APPROVED, NOT ACCEPTED
1
$70,150
15
$70,215
20
$71,054
3
$39,230
1
$45,510
11
$46,510
APPLICATIONS DENIED
5
$54,582
38
$90,916
64
$70,039
17
$25,572
5
$85,450
26
$50,663
APPLICATIONS WITHDRAWN
2
$61,620
11
$77,069
40
$108,921
5
$11,600
2
$41,695
1
$42,140
FILES CLOSED FOR INCOMPLETENESS
1
$90,070
4
$82,140
7
$121,416
0
$0
0
$0
1
$62,010
Aggregated Statistics For Year 2003 (Based on 4 partial tracts)
A) FHA, FSA/RHS & VA Home Purchase Loans
B) Conventional Home Purchase Loans
C) Refinancings
D) Home Improvement Loans
F) Non-occupant Loans on < 5 Family Dwellings (A B C & D)
Number
Average Value
Number
Average Value
Number
Average Value
Number
Average Value
Number
Average Value
LOANS ORIGINATED
15
$104,176
97
$89,406
250
$99,466
48
$31,203
31
$52,205
APPLICATIONS APPROVED, NOT ACCEPTED
1
$226,710
11
$83,181
25
$65,515
1
$76,040
0
$0
APPLICATIONS DENIED
6
$71,982
30
$49,793
53
$75,329
8
$14,431
3
$61,643
APPLICATIONS WITHDRAWN
3
$62,787
10
$74,489
36
$104,337
4
$15,142
3
$69,553
FILES CLOSED FOR INCOMPLETENESS
0
$0
4
$69,470
15
$84,269
0
$0
0
$0
Aggregated Statistics For Year 2002 (Based on 4 partial tracts)
A) FHA, FSA/RHS & VA Home Purchase Loans
B) Conventional Home Purchase Loans
C) Refinancings
D) Home Improvement Loans
F) Non-occupant Loans on < 5 Family Dwellings (A B C & D)
Number
Average Value
Number
Average Value
Number
Average Value
Number
Average Value
Number
Average Value
LOANS ORIGINATED
36
$101,028
98
$96,662
199
$98,207
69
$22,469
33
$57,980
APPLICATIONS APPROVED, NOT ACCEPTED
1
$49,730
12
$72,341
25
$73,199
3
$22,370
0
$0
APPLICATIONS DENIED
7
$66,890
26
$52,715
41
$63,862
17
$17,439
5
$31,314
APPLICATIONS WITHDRAWN
5
$97,752
13
$72,735
25
$84,967
5
$19,694
2
$40,345
FILES CLOSED FOR INCOMPLETENESS
1
$126,420
0
$0
7
$165,544
1
$12,640
0
$0
Aggregated Statistics For Year 2001 (Based on 4 partial tracts)
A) FHA, FSA/RHS & VA Home Purchase Loans
B) Conventional Home Purchase Loans
C) Refinancings
D) Home Improvement Loans
E) Loans on Dwellings For 5+ Families
F) Non-occupant Loans on < 5 Family Dwellings (A B C & D)
Number
Average Value
Number
Average Value
Number
Average Value
Number
Average Value
Number
Average Value
Number
Average Value
LOANS ORIGINATED
32
$86,693
110
$87,514
154
$80,888
73
$19,088
1
$292,830
35
$50,055
APPLICATIONS APPROVED, NOT ACCEPTED
1
$28,060
12
$68,551
20
$60,086
1
$18,980
0
$0
0
$0
APPLICATIONS DENIED
2
$62,100
41
$41,690
59
$62,264
13
$26,644
0
$0
6
$52,643
APPLICATIONS WITHDRAWN
3
$91,787
12
$107,677
28
$59,555
4
$19,142
0
$0
0
$0
FILES CLOSED FOR INCOMPLETENESS
1
$53,940
1
$74,310
6
$59,927
0
$0
0
$0
0
$0
Aggregated Statistics For Year 2000 (Based on 4 partial tracts)
A) FHA, FSA/RHS & VA Home Purchase Loans
B) Conventional Home Purchase Loans
C) Refinancings
D) Home Improvement Loans
E) Loans on Dwellings For 5+ Families
F) Non-occupant Loans on < 5 Family Dwellings (A B C & D)
Number
Average Value
Number
Average Value
Number
Average Value
Number
Average Value
Number
Average Value
Number
Average Value
LOANS ORIGINATED
24
$84,209
89
$73,973
82
$71,717
55
$18,604
2
$135,270
14
$31,723
APPLICATIONS APPROVED, NOT ACCEPTED
2
$54,765
25
$43,140
7
$58,074
5
$16,694
0
$0
2
$7,185
APPLICATIONS DENIED
5
$68,054
70
$38,055
56
$57,995
24
$12,775
0
$0
4
$25,202
APPLICATIONS WITHDRAWN
4
$63,350
13
$77,011
29
$74,431
6
$17,342
0
$0
0
$0
FILES CLOSED FOR INCOMPLETENESS
2
$32,025
0
$0
5
$73,628
1
$25,280
0
$0
0
$0
Aggregated Statistics For Year 1999 (Based on 2 partial tracts)
A) FHA, FSA/RHS & VA Home Purchase Loans
B) Conventional Home Purchase Loans
C) Refinancings
D) Home Improvement Loans
F) Non-occupant Loans on < 5 Family Dwellings (A B C & D)
Detailed PMIC statistics for the following Tracts:0103.01
, 0103.02
2002 - 2018 National Fire Incident Reporting System (NFIRS) incidents
Based on the data from the years 2002 - 2018 the average number of fires per year is 26. The highest number of fire incidents - 62 took place in 2018, and the least - 2 in 2005. The data has an increasing trend.
When looking into fire subcategories, the most incidents belonged to: Outside Fires (57.9%), and Structure Fires (36.5%).
Fire incident types reported to NFIRS in Zip Code 72937


 Nearest zip codes: 72945, 72916, 72938, 72940, 74902, 74932.


 Based on the data from the years 2002 - 2018 the average number of fires per year is 26. The highest number of fire incidents - 62 took place in 2018, and the least - 2 in 2005. The data has an increasing trend.
 When looking into fire subcategories, the most incidents belonged to: Outside Fires (57.9%), and Structure Fires (36.5%).