Estimated zip code population in 2022: 5,003 Zip code population in 2010: 4,999 Zip code population in 2000: 5,065
Houses and condos: 2,302 Renter-occupied apartments: 434
% of renters here:
21%
State:
34%
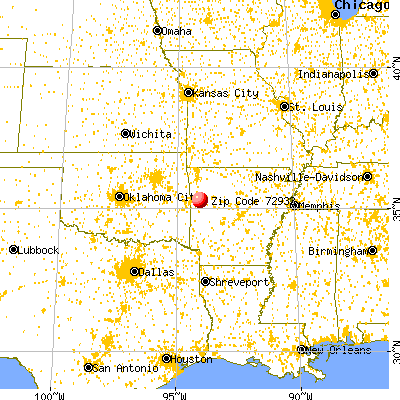
March 2022 cost of living index in zip code 72933: 78.1 (low, U.S. average is 100)
Land area: 114.1 sq. mi. Water area: 0.6 sq. mi.
Population density: 44 people per square mile
(very low).
OSM Map
General Map
Google Map
MSN Map
OSM Map
General Map
Google Map
MSN Map
OSM Map
General Map
Google Map
MSN Map
OSM Map
General Map
Google Map
MSN Map
Please wait while loading the map...
Real estate property taxes paid for housing units in 2022:
This zip code:
0.5% ($627)
Arkansas:
0.5% ($977)
Median real estate property taxes paid for housing units with mortgages in 2022: $825 (0.5%) Median real estate property taxes paid for housing units with no mortgage in 2022: $472 (0.5%)
Business Search- 14 Million verified businesses
Males: 2,339
(46.7%)
Females: 2,664
(53.3%)
For population 25 years and over in 72933:
High school or higher: 82.9%
Bachelor's degree or higher: 18.0%
Graduate or professional degree: 5.1%
Unemployed: 3.3%
Mean travel time to work (commute): 27.3 minutes
For population 15 years and over in 72933:
Never married: 17.8%
Now married: 57.6%
Separated: 1.9%
Widowed: 9.9%
Divorced: 12.8%
Zip code 72933 compared to state average:
Black race population percentage significantly below state average.
Hispanic race population percentage below state average.
Foreign-born population percentage significantly below state average.
Renting percentage below state average.
Length of stay since moving in significantly above state average.
Estimated median house/condo value in 2022: $129,757
72933:
$129,757
Arkansas:
$179,800
According to our research of Arkansas and other state lists, there were 6 registered sex offenders living in 72933 zip code as of July 03, 2024. The ratio of all residents to sex offenders in zip code 72933 is 920 to 1. The ratio of registered sex offenders to all residents in this zip code is lower than the state average.
Median resident age:
This zip code:
41.8 years
Arkansas median age:
38.9 years
Average household size:
This zip code:
2.3 people
Arkansas:
2.4 people
Averages for the 2020 tax year for zip code 72933, filed in 2021:
Average Adjusted Gross Income (AGI) in 2020: $58,621 (Individual Income Tax Returns)
Here:
$58,621
State:
$64,872
Salary/wage: $48,558 (reported on 81.7% of returns)
Here:
$48,558
State:
$50,644
(% of AGI for various income ranges: 1194.3% for AGIs below $25k, 3621.0% for AGIs $25k-50k, 6598.6% for AGIs $50k-75k, 8865.0% for AGIs $75k-100k, 14753.3% for AGIs $100k-200k)
Taxable interest for individuals: $1,069 (reported on 27.9% of returns)
This zip code:
$1,069
Arkansas:
$1,857
(% of AGI for various income ranges: 16.5% for AGIs below $25k, 32.8% for AGIs $25k-50k, 25.5% for AGIs $50k-75k, 52.5% for AGIs $75k-100k, 58.0% for AGIs $100k-200k)
Ordinary dividends: $4,269 (reported on 13.2% of returns)
Here:
$4,269
State:
$21,681
(% of AGI for various income ranges: 7.3% for AGIs below $25k, 24.8% for AGIs $25k-50k, 105.0% for AGIs $50k-75k, 123.8% for AGIs $75k-100k, 288.0% for AGIs $100k-200k)
Net capital gain/loss in AGI: +$10,500 (reported on 13.2% of returns)
Here:
+$10,500
State:
+$22,815
(% of AGI for various income ranges: 11.4% for AGIs below $25k, 13.8% for AGIs $25k-50k, 50.5% for AGIs $50k-75k, 151.9% for AGIs $75k-100k, 388.7% for AGIs $100k-200k)
Profit/loss from business: +$8,453 (reported on 15.2% of returns)
Here:
+$8,453
State:
+$9,743
(% of AGI for various income ranges: 147.1% for AGIs below $25k, 108.7% for AGIs $25k-50k, 150.9% for AGIs $50k-75k, 120.6% for AGIs $75k-100k, 279.3% for AGIs $100k-200k)
Taxable individual retirement arrangement distribution: $16,532 (reported on 9.6% of returns)
72933:
$16,532
Arkansas:
$18,502
(% of AGI for various income ranges: 50.2% for AGIs below $25k, 150.5% for AGIs $25k-50k, 195.5% for AGIs $50k-75k, 246.9% for AGIs $75k-100k, 978.7% for AGIs $100k-200k)
Total itemized deductions: $36,343 (reported on 3.6% of returns)
Here:
$36,343
State:
$52,840
(% of AGI for various income ranges: 270.0% for AGIs $50k-75k, 610.7% for AGIs $100k-200k)
Charity contributions: $10,683 (reported on 3.0% of returns)
Here:
$10,683
State:
$35,735
(% of AGI for various income ranges: 427.3% for AGIs $100k-200k)
Taxes paid: $7,914 (reported on 3.6% of returns)
72933:
$7,914
State:
$7,196
(% of AGI for various income ranges: 50.9% for AGIs $50k-75k, 150.7% for AGIs $100k-200k)
Earned income credit: $2,629 (reported on 19.3% of returns)
Here:
$2,629
State:
$2,546
(% of AGI for various income ranges: 115.3% for AGIs below $25k, 108.5% for AGIs $25k-50k)
Percentage of individuals using paid preparers for their 2020 taxes: 94.9%
Here:
95%
State:
94%
(% for various income ranges: 95.5% for AGIs below $25k, 94.0% for AGIs $25k-50k, 96.7% for AGIs $50k-75k, 95.5% for AGIs $75k-100k, 91.7% for AGIs $100k-200k, 100.0% for AGIs over 200k)
Averages for the 2012 tax year for zip code 72933, filed in 2013:
Average Adjusted Gross Income (AGI) in 2012: $49,150 (Individual Income Tax Returns)
Here:
$49,150
State:
$52,148
Salary/wage: $42,036 (reported on 83.7% of returns)
Here:
$42,036
State:
$41,669
(% of AGI for various income ranges: 74.5% for AGIs below $25k, 80.8% for AGIs $25k-50k, 80.6% for AGIs $50k-75k, 79.9% for AGIs $75k-100k, 71.4% for AGIs $100k-200k, 35.5% for AGIs over 200k)
Taxable interest for individuals: $1,371 (reported on 31.1% of returns)
This zip code:
$1,371
Arkansas:
$1,648
(% of AGI for various income ranges: 1.3% for AGIs below $25k, 1.0% for AGIs $25k-50k, 0.4% for AGIs $50k-75k, 0.2% for AGIs $75k-100k, 0.7% for AGIs $100k-200k, 2.1% for AGIs over 200k)
Ordinary dividends: $4,292 (reported on 13.7% of returns)
Here:
$4,292
State:
$20,675
(% of AGI for various income ranges: 1.0% for AGIs below $25k, 0.6% for AGIs $25k-50k, 0.3% for AGIs $50k-75k, 0.1% for AGIs $75k-100k, 4.1% for AGIs $100k-200k)
Net capital gain/loss in AGI: +$7,126 (reported on 10.0% of returns)
Here:
+$7,126
State:
+$15,222
(% of AGI for various income ranges: 0.2% for AGIs $25k-50k, 1.6% for AGIs $50k-75k, 1.0% for AGIs $75k-100k, 4.3% for AGIs $100k-200k)
Profit/loss from business: +$5,787 (reported on 15.8% of returns)
Here:
+$5,787
State:
+$9,665
(% of AGI for various income ranges: 6.1% for AGIs below $25k, 2.0% for AGIs $25k-50k, 0.8% for AGIs $50k-75k, 1.5% for AGIs $75k-100k, 2.2% for AGIs $100k-200k)
Taxable individual retirement arrangement distribution: $12,061 (reported on 9.5% of returns)
72933:
$12,061
Arkansas:
$13,644
(% of AGI for various income ranges: 4.2% for AGIs below $25k, 2.6% for AGIs $25k-50k, 1.4% for AGIs $50k-75k, 1.1% for AGIs $75k-100k, 4.4% for AGIs $100k-200k)
Total itemized deductions: $20,241 (20% of AGI, reported on 24.2% of returns)
Here:
$20,241
State:
$23,276
Here:
20.4% of AGI
State:
19.1% of AGI
(% of AGI for various income ranges: 7.6% for AGIs below $25k, 8.4% for AGIs $25k-50k, 7.5% for AGIs $50k-75k, 10.0% for AGIs $75k-100k, 13.0% for AGIs $100k-200k, 12.3% for AGIs over 200k)
Charity contributions: $5,315 (reported on 17.9% of returns)
Here:
$5,315
State:
$5,996
(% of AGI for various income ranges: 0.8% for AGIs below $25k, 0.9% for AGIs $25k-50k, 1.7% for AGIs $50k-75k, 2.2% for AGIs $75k-100k, 3.0% for AGIs $100k-200k, 2.3% for AGIs over 200k)
Taxes paid: $6,949 (reported on 23.7% of returns)
72933:
$6,949
State:
$7,941
(% of AGI for various income ranges: 0.7% for AGIs below $25k, 1.4% for AGIs $25k-50k, 1.6% for AGIs $50k-75k, 2.8% for AGIs $75k-100k, 5.1% for AGIs $100k-200k, 7.9% for AGIs over 200k)
Earned income credit: $2,440 (reported on 21.1% of returns)
Here:
$2,440
State:
$2,455
(% of AGI for various income ranges: 7.3% for AGIs below $25k, 1.7% for AGIs $25k-50k)
Percentage of individuals using paid preparers for their 2012 taxes: 70.0%
Here:
70%
State:
61%
(% for various income ranges: 64.9% for AGIs below $25k, 70.2% for AGIs $25k-50k, 75.9% for AGIs $50k-75k, 77.8% for AGIs $75k-100k, 75.0% for AGIs $100k-200k, 66.7% for AGIs over 200k)
Averages for the 2004 tax year for zip code 72933, filed in 2005:
Average Adjusted Gross Income (AGI) in 2004: $38,007 (Individual Income Tax Returns)
Here:
$38,007
State:
$39,270
Salary/wage: $34,120 (reported on 84.9% of returns)
Here:
$34,120
State:
$34,079
(% of AGI for various income ranges: 129.3% for AGIs below $10k, 76.9% for AGIs $10k-25k, 82.3% for AGIs $25k-50k, 83.7% for AGIs $50k-75k, 78.2% for AGIs $75k-100k, 53.1% for AGIs over 100k)
Taxable interest for individuals: $1,500 (reported on 39.4% of returns)
This zip code:
$1,500
Arkansas:
$1,904
(% of AGI for various income ranges: 7.7% for AGIs below $10k, 2.9% for AGIs $10k-25k, 1.3% for AGIs $25k-50k, 1.1% for AGIs $50k-75k, 1.0% for AGIs $75k-100k, 1.5% for AGIs over 100k)
Taxable dividends: $2,377 (reported on 16.5% of returns)
Here:
$2,377
State:
$5,995
(% of AGI for various income ranges: 1.6% for AGIs below $10k, 1.4% for AGIs $10k-25k, 0.6% for AGIs $25k-50k, 0.2% for AGIs $50k-75k, 1.3% for AGIs $75k-100k, 2.2% for AGIs over 100k)
Net capital gain/loss: +$7,148 (reported on 14.0% of returns)
Here:
+$7,148
State:
+$10,430
(% of AGI for various income ranges: -1.6% for AGIs below $10k, 0.4% for AGIs $10k-25k, 0.8% for AGIs $25k-50k, 1.4% for AGIs $50k-75k, 1.7% for AGIs $75k-100k, 8.9% for AGIs over 100k)
Profit/loss from business: +$4,808 (reported on 14.8% of returns)
Here:
+$4,808
State:
+$7,823
(% of AGI for various income ranges: -8.1% for AGIs below $10k, 4.4% for AGIs $10k-25k, 2.7% for AGIs $25k-50k, 1.5% for AGIs $50k-75k, 1.7% for AGIs $75k-100k, 0.5% for AGIs over 100k)
IRA payment deduction: $3,000 (reported on 1.8% of returns)
72933:
$3,000
Arkansas:
$3,204
(% of AGI for various income ranges: 1.4% for AGIs below $10k, 0.1% for AGIs $50k-75k, 0.6% for AGIs $75k-100k)
Total itemized deductions: $15,990 (21% of AGI, reported on 21.3% of returns)
Here:
$15,990
State:
$18,389
Here:
20.7% of AGI
State:
21.0% of AGI
(% of AGI for various income ranges: 8.6% for AGIs $10k-25k, 5.5% for AGIs $25k-50k, 9.8% for AGIs $50k-75k, 11.6% for AGIs $75k-100k, 11.2% for AGIs over 100k)
Charity contributions deductions: $3,562 (4% of AGI, reported on 17.6% of returns)
Here:
$3,562
State:
$4,725
Here:
4.3% of AGI
State:
5.1% of AGI
(% of AGI for various income ranges: 1.1% for AGIs $10k-25k, 0.9% for AGIs $25k-50k, 1.4% for AGIs $50k-75k, 2.8% for AGIs $75k-100k, 2.5% for AGIs over 100k)
Total tax: $4,734 (reported on 74.1% of returns)
72933:
$4,734
State:
$6,047
(% of AGI for various income ranges: 3.8% for AGIs below $10k, 3.5% for AGIs $10k-25k, 6.0% for AGIs $25k-50k, 8.0% for AGIs $50k-75k, 9.9% for AGIs $75k-100k, 18.7% for AGIs over 100k)
Earned income credit: $1,807 (reported on 18.4% of returns)
Here:
$1,807
State:
$1,909
Percentage of individuals using paid preparers for their 2004 taxes: 72.3%
Here:
72%
State:
67%
(% for various income ranges: 63.5% for AGIs below $10k, 71.2% for AGIs $10k-25k, 77.8% for AGIs $25k-50k, 71.5% for AGIs $50k-75k, 74.6% for AGIs $75k-100k, 82.7% for AGIs over 100k)
Household received Food Stamps/SNAP in the past 12 months: 232 Household did not receive Food Stamps/SNAP in the past 12 months: 1,855
Women who had a birth in the past 12 months: 22 (22 now married, 0 unmarried) Women who did not have a birth in the past 12 months: 1,010 (531 now married, 480 unmarried)
Housing units in zip code 72933 with a mortgage: 817 (22 second mortgage, 21 both second mortgage and home equity loan) Houses without a mortgage: 25
Median monthly owner costs for units with a mortgage: $1,100 Median monthly owner costs for units without a mortgage: $344
Residents with income below the poverty level in 2022:
This zip code:
15.1%
Whole state:
16.8%
Residents with income below 50% of the poverty level in 2022:
This zip code:
11.0%
Whole state:
8.5%
Median number of rooms in houses and condos:
Here:
6.1
State:
6.1
Median number of rooms in apartments:
Here:
4.5
State:
4.3
Notable locations in this zip code not listed on our city pages
Notable locations in zip code 72933: Charleston Police Department (A), Big Creek Fire Department Station 2 (B), Charleston Volunteer Fire Department (C). Display/hide their locations on the map
Churches in zip code 72933 include: Marietta Church (A), Potts Church (B), Grand Prairie Church (C), Lowes Creek Church (D), Mount Hope Church (E), Mount View Church (F), Bloomer Baptist Church (G). Display/hide their locations on the map
Cemeteries: Nixon Cemetery (1), Hampton Cemetery (2), King Cemetery (3), Morris Cemetery (4), Sacred Heart Cemetery (5), Garden Memorial Cemetery (6), Singleton Cemetery (7). Display/hide their locations on the map
Reservoirs: Sixmile Creek Watershed Site 11 Reservoir (A), Sixmile Creek Watershed Site 12 Reservoir (B), Sixmile Creek Watershed Site 10 Reservoir (C), Engineer Lake (D), Sixmile Creek Site 24 Reservoir (E), Sixmile Creek Site 23 Reservoir (F), Sixmile Creek Site 22 Reservoir (G), Sixmile Creek Site 21 Reservoir (H). Display/hide their locations on the map
Streams, rivers, and creeks: Lowes Creek (A), Hall Creek (B), Doctors Fork (C), Sulphia Springs Branch (D), Perry Creek (E), Rattlesnake Creek (F). Display/hide their locations on the map
In group quarters: 106 (-1 institutionalized population)
Size of family households: 731 2-persons, 300 3-persons, 195 4-persons, 85 5-persons, 107 6-persons, 24 7-or-more-persons
Size of nonfamily households: 522 1-person, 123 2-persons
732 married couples with children.
278 single-parent households (156 men, 122 women).
98.5% of residents of 72933 zip code speak English at home.
0.8% of residents speak Spanish at home (100% very well).
0.2% of residents speak other Indo-European language at home (100% very well).
0.3% of residents speak Asian or Pacific Island language at home (100% well).
Foreign born population: 39 (0.8%) (48.2% of them are naturalized citizens)
This zip code:
0.8%
Whole state:
5.1%
29%Malaysia
18%Indonesia
16%Germany
16%Japan
11%France
40%American
14%German
5%Irish
5%English
2%European
1%Dutch
1%Polish
Year of entry for the foreign-born population
222010 or later
122000 to 2009
01990 to 1999
16Before 1990
Facilities with environmental interests located in this zip code:
CHARLESTON ELEMENTARY SCHOOL (125 WEST MAIN in CHARLESTON, AR)
(Geographic Names Information System) (National Center for Education Statistics) - STATE ID-2402006
CHARLESTON HIGH SCHOOL (125 WEST MAIN in CHARLESTON, AR)
(Geographic Names Information System) (National Center for Education Statistics) - STATE ID-2402007
CHARLESTON, CITY OF (LEE WESTERN RD in CHARLESTON, AR)
National Pollutant Discharge Elimination System NON-MAJOR (Tracking pollutant discharge elimination systems) - permit Business SIC classification: SEWERAGE SYSTEMS
CHARLESTON, CITY OF-PWTP (WATER DEPARTMENT PLANT in CHARLESTON, AR)
National Pollutant Discharge Elimination System NON-MAJOR (Tracking pollutant discharge elimination systems) - permit Business SIC classification: WATER SUPPLY
KOCH POULTRY FARM (TATE RIDGE ROAD in CHARLESTON, AR)
National Pollutant Discharge Elimination System NON-MAJOR (Tracking pollutant discharge elimination systems) - permit Business SIC classification: MANAGEMENT SERVICES
Housing units lacking complete plumbing facilities: 4.6% Housing units lacking complete kitchen facilities: 1.9%
54.2%Electricity
40.7%Utility gas
4.4%Wood
0.8%No fuel used
Population in 1990: 3,173. Population change in the 1990s: +1,892 (+59.6%).
Place of birth for U.S.-born residents:
This state: 3,532
Northeast: 144
Midwest: 288
South: 618
West: 350
64% of the 72933 zip code residents lived in the same house 5 years ago. Out of people who lived in different houses, 50% lived in this county. Out of people who lived in different counties, 50% lived in Arkansas.
97% of the 72933 zip code residents lived in the same house 1 year ago. Out of people who lived in different houses, 56% moved from this county. Out of people who lived in different houses, 42% moved from different county within same state. Out of people who lived in different houses, 1% moved from different state. Out of people who lived in different houses, 6% moved from abroad.
Private vs. public school enrollment:
Students in private schools in grades 1 to 8 (elementary and middle school): 58
Here:
8.1%
Arkansas:
10.5%
Students in private schools in grades 9 to 12 (high school): 12
Here:
6.0%
Arkansas:
8.7%
Students in private undergraduate colleges: 45
Here:
40.6%
Arkansas:
19.4%
Occupation by median earnings in the past 12 months ($)
81,279Computer and mathematical occupations
69,634Management occupations
45,402Business and financial operations occupations
44,621Health diagnosing and treating practitioners and other technical occupations
43,653Construction and extraction occupations
36,645Office and administrative support occupations
Companies with federal contracts located in this zip code:
MEDISAV PHARMACY (101 SOUTH LOGAN in CHARLESTON, AR; small business) : $20,000 in 2 contractsfrom 2002 to 2003
$10,000 with Army for Drugs and Biologicals. Signed on 2003-05-30. Completion date: 2003-06-28.
$10,000 with Army for Medical and Surgical Instruments, Equipment, and Supplies. Signed on 2002-05-23. Completion date: 2002-05-15.
CHARLES WILLIAMS (107 FIFTH ST in CHARLESTON, AR; small business)
$8,325 with Army for Operation of Government-Owned Facilities -- Other Conservation and Development Facilities. Signed on 2006-01-26. Completion date: 2006-10-31.
STURDIVANT, DELINDA (7208 N GRAND PRAIRIE RD in CHARLESTON, AR; small business) : $0 in 2 contractsin 2006
$1,109 with Army for Operation of Government-Owned Facilities -- Other Conservation and Development Facilities. Signed on 2006-01-24. Completion date: 2006-10-31.
-$1,109, same as above.Signed on 2006-02-09. Completion date: 2006-10-31.
Top industries in this zip code by the number of employees in 2005:
Health Care and Social Assistance: Nursing Care Facilities (100-249 employees: 1 establishment)
Accommodation and Food Services: Limited-Service Restaurants (20-49: 1, 5-9: 1)
Wholesale Trade: Industrial Machinery and Equipment Merchant Wholesalers (20-49: 1)
Finance and Insurance: Commercial Banking (10-19: 1, 5-9: 1)
Other Services (except Public Administration): Religious Organizations (10-19: 1, 1-4: 3)
People in group quarters in 2010:
95 people in nursing facilities/skilled-nursing facilities
People in group quarters in 2000:
84 people in nursing homes
13 people in agriculture workers' dormitories on farms
Fatal accident statistics in 2014:
Fatal accident count: 1
Vehicles involved in fatal accidents: 1
Fatal accidents caused by drunken drivers: 1
Fatalities: 1
Persons involved in fatal accidents: 1
Pedestrians involved in fatal accidents: 0
Fatal accident statistics in 2011:
Fatal accident count: 1
Vehicles involved in fatal accidents: 1
Fatal accidents caused by drunken drivers: 0
Fatalities: 1
Persons involved in fatal accidents: 1
Pedestrians involved in fatal accidents: 0
Home Mortgage Disclosure Act Aggregated Statistics For Year 2009 (Based on 2 partial tracts)
A) FHA, FSA/RHS & VA Home Purchase Loans
B) Conventional Home Purchase Loans
C) Refinancings
D) Home Improvement Loans
F) Non-occupant Loans on < 5 Family Dwellings (A B C & D)
G) Loans On Manufactured Home Dwelling (A B C & D)
Number
Average Value
Number
Average Value
Number
Average Value
Number
Average Value
Number
Average Value
Number
Average Value
LOANS ORIGINATED
14
$131,078
7
$72,741
36
$111,430
7
$27,166
2
$56,265
3
$37,760
APPLICATIONS APPROVED, NOT ACCEPTED
0
$0
1
$120,330
3
$132,960
1
$11,140
0
$0
1
$65,370
APPLICATIONS DENIED
2
$96,935
1
$61,650
11
$133,975
4
$15,412
0
$0
1
$61,650
APPLICATIONS WITHDRAWN
2
$133,890
0
$0
6
$106,777
0
$0
0
$0
1
$55,340
FILES CLOSED FOR INCOMPLETENESS
0
$0
0
$0
1
$180,130
0
$0
0
$0
0
$0
Aggregated Statistics For Year 2008 (Based on 2 partial tracts)
A) FHA, FSA/RHS & VA Home Purchase Loans
B) Conventional Home Purchase Loans
C) Refinancings
D) Home Improvement Loans
F) Non-occupant Loans on < 5 Family Dwellings (A B C & D)
G) Loans On Manufactured Home Dwelling (A B C & D)
Number
Average Value
Number
Average Value
Number
Average Value
Number
Average Value
Number
Average Value
Number
Average Value
LOANS ORIGINATED
14
$110,624
15
$94,014
28
$120,042
10
$30,083
4
$61,002
3
$41,967
APPLICATIONS APPROVED, NOT ACCEPTED
0
$0
2
$59,610
1
$140,760
0
$0
0
$0
1
$78,370
APPLICATIONS DENIED
3
$99,040
4
$52,832
7
$104,310
4
$24,790
1
$40,480
3
$62,643
APPLICATIONS WITHDRAWN
0
$0
1
$63,140
4
$114,762
1
$31,570
0
$0
0
$0
FILES CLOSED FOR INCOMPLETENESS
0
$0
0
$0
2
$120,520
0
$0
0
$0
0
$0
Aggregated Statistics For Year 2007 (Based on 2 partial tracts)
A) FHA, FSA/RHS & VA Home Purchase Loans
B) Conventional Home Purchase Loans
C) Refinancings
D) Home Improvement Loans
F) Non-occupant Loans on < 5 Family Dwellings (A B C & D)
G) Loans On Manufactured Home Dwelling (A B C & D)
Number
Average Value
Number
Average Value
Number
Average Value
Number
Average Value
Number
Average Value
Number
Average Value
LOANS ORIGINATED
10
$106,703
26
$102,807
31
$95,845
10
$25,515
8
$56,964
5
$35,580
APPLICATIONS APPROVED, NOT ACCEPTED
0
$0
3
$49,150
2
$177,160
1
$24,880
0
$0
3
$49,150
APPLICATIONS DENIED
1
$65,740
6
$74,465
14
$92,293
6
$26,617
1
$96,560
2
$46,795
APPLICATIONS WITHDRAWN
0
$0
1
$140,020
5
$153,462
2
$27,485
0
$0
0
$0
FILES CLOSED FOR INCOMPLETENESS
0
$0
1
$65,370
2
$130,735
0
$0
0
$0
0
$0
Aggregated Statistics For Year 2006 (Based on 2 partial tracts)
A) FHA, FSA/RHS & VA Home Purchase Loans
B) Conventional Home Purchase Loans
C) Refinancings
D) Home Improvement Loans
F) Non-occupant Loans on < 5 Family Dwellings (A B C & D)
G) Loans On Manufactured Home Dwelling (A B C & D)
Number
Average Value
Number
Average Value
Number
Average Value
Number
Average Value
Number
Average Value
Number
Average Value
LOANS ORIGINATED
8
$103,806
27
$99,466
25
$92,850
16
$26,300
7
$109,829
1
$340,200
APPLICATIONS APPROVED, NOT ACCEPTED
0
$0
3
$37,883
1
$254,780
1
$46,050
0
$0
3
$39,493
APPLICATIONS DENIED
1
$77,990
4
$72,145
19
$80,007
7
$17,986
1
$62,400
3
$37,263
APPLICATIONS WITHDRAWN
0
$0
4
$102,600
10
$118,885
2
$34,355
0
$0
0
$0
FILES CLOSED FOR INCOMPLETENESS
0
$0
0
$0
3
$100,650
0
$0
0
$0
0
$0
Aggregated Statistics For Year 2005 (Based on 2 partial tracts)
A) FHA, FSA/RHS & VA Home Purchase Loans
B) Conventional Home Purchase Loans
C) Refinancings
D) Home Improvement Loans
F) Non-occupant Loans on < 5 Family Dwellings (A B C & D)
G) Loans On Manufactured Home Dwelling (A B C & D)
Number
Average Value
Number
Average Value
Number
Average Value
Number
Average Value
Number
Average Value
Number
Average Value
LOANS ORIGINATED
10
$96,378
27
$97,830
33
$83,036
14
$37,989
8
$58,635
5
$55,190
APPLICATIONS APPROVED, NOT ACCEPTED
1
$87,650
3
$51,873
8
$78,505
1
$21,170
0
$0
1
$65,000
APPLICATIONS DENIED
1
$119,220
6
$54,843
17
$92,173
3
$23,647
2
$40,295
3
$43,207
APPLICATIONS WITHDRAWN
1
$50,140
3
$73,043
12
$113,679
0
$0
0
$0
0
$0
FILES CLOSED FOR INCOMPLETENESS
0
$0
0
$0
3
$68,957
0
$0
0
$0
0
$0
Aggregated Statistics For Year 2004 (Based on 2 partial tracts)
A) FHA, FSA/RHS & VA Home Purchase Loans
B) Conventional Home Purchase Loans
C) Refinancings
D) Home Improvement Loans
F) Non-occupant Loans on < 5 Family Dwellings (A B C & D)
G) Loans On Manufactured Home Dwelling (A B C & D)
Number
Average Value
Number
Average Value
Number
Average Value
Number
Average Value
Number
Average Value
Number
Average Value
LOANS ORIGINATED
7
$102,294
25
$91,959
38
$94,091
11
$34,776
5
$104,884
4
$108,542
APPLICATIONS APPROVED, NOT ACCEPTED
0
$0
3
$63,137
8
$80,686
0
$0
0
$0
1
$58,310
APPLICATIONS DENIED
1
$112,160
7
$72,317
15
$83,961
6
$27,360
0
$0
4
$47,725
APPLICATIONS WITHDRAWN
1
$61,650
2
$129,805
7
$81,709
2
$18,570
1
$89,510
0
$0
FILES CLOSED FOR INCOMPLETENESS
0
$0
0
$0
3
$77,500
0
$0
0
$0
0
$0
Aggregated Statistics For Year 2003 (Based on 2 partial tracts)
A) FHA, FSA/RHS & VA Home Purchase Loans
B) Conventional Home Purchase Loans
C) Refinancings
D) Home Improvement Loans
F) Non-occupant Loans on < 5 Family Dwellings (A B C & D)
Detailed PMIC statistics for the following Tracts:0101.01
2002 - 2018 National Fire Incident Reporting System (NFIRS) incidents
Based on the data from the years 2002 - 2018 the average number of fires per year is 34. The highest number of fire incidents - 50 took place in 2003, and the least - 7 in 2005. The data has an increasing trend.
When looking into fire subcategories, the most incidents belonged to: Outside Fires (64.3%), and Structure Fires (27.4%).
Fire incident types reported to NFIRS in Zip Code 72933


 Nearest zip codes: 72928, 72930, 72951, 72941, 72935, 72921.


 Based on the data from the years 2002 - 2018 the average number of fires per year is 34. The highest number of fire incidents - 50 took place in 2003, and the least - 7 in 2005. The data has an increasing trend.
 When looking into fire subcategories, the most incidents belonged to: Outside Fires (64.3%), and Structure Fires (27.4%).