Estimated zip code population in 2022: 421 Zip code population in 2010: 4,264 Zip code population in 2000: 4,214
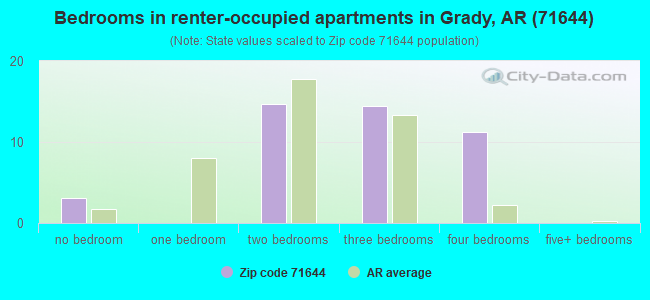
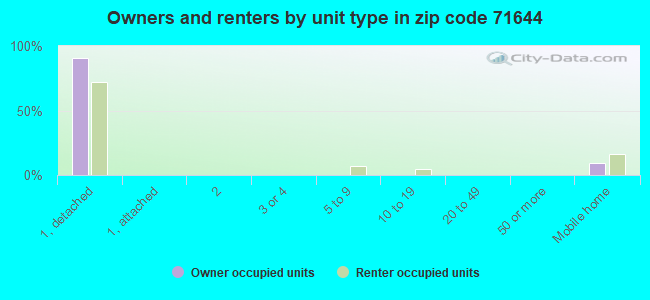
Houses and condos: 367 Renter-occupied apartments: 44
% of renters here:
19%
State:
34%
March 2022 cost of living index in zip code 71644: 77.3 (low, U.S. average is 100)
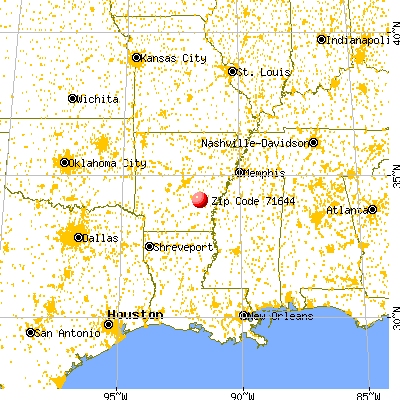
Land area: 74.7 sq. mi. Water area: 2.2 sq. mi.
Population density: 6 people per square mile
(very low).
OSM Map
General Map
Google Map
MSN Map
OSM Map
General Map
Google Map
MSN Map
OSM Map
General Map
Google Map
MSN Map
OSM Map
General Map
Google Map
MSN Map
Please wait while loading the map...
Real estate property taxes paid for housing units in 2022:
This zip code:
0.8% ($1,141)
Arkansas:
0.5% ($977)
Median real estate property taxes paid for housing units with mortgages in 2022: $1,286 (0.8%) Median real estate property taxes paid for housing units with no mortgage in 2022: $202 (0.4%)
Business Search- 14 Million verified businesses
Males: 187
(44.5%)
Females: 234
(55.5%)
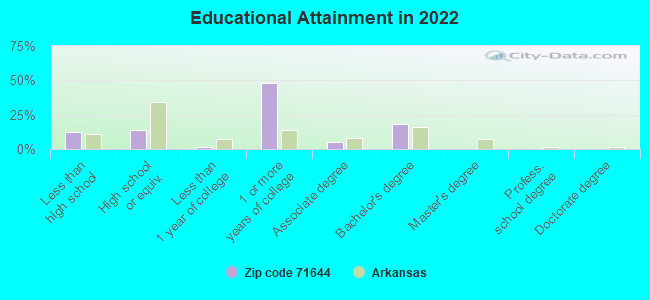
For population 25 years and over in 71644:
High school or higher: 84.9%
Bachelor's degree or higher: 18.0%
Graduate or professional degree: 0.3%
Mean travel time to work (commute): 28.9 minutes
For population 15 years and over in 71644:
Never married: 6.7%
Now married: 66.0%
Separated: 1.5%
Widowed: 12.3%
Divorced: 13.5%
Zip code 71644 compared to state average:
Unemployed percentage significantly below state average.
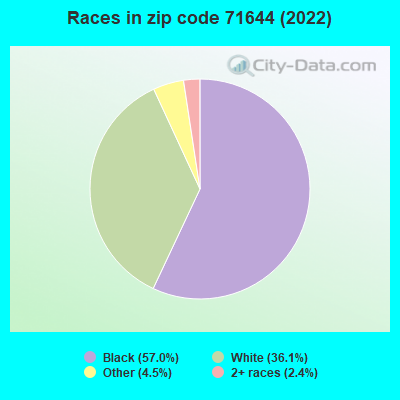
Black race population percentage significantly above state average.
Hispanic race population percentage significantly below state average.
Median age significantly above state average.
Foreign-born population percentage significantly below state average.
Renting percentage below state average.
Length of stay since moving in significantly above state average.
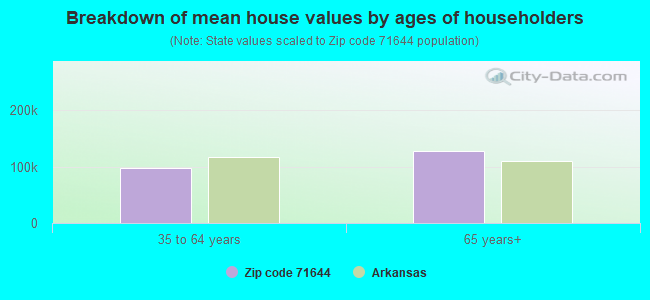
Estimated median house/condo value in 2022: $144,261
71644:
$144,261
Arkansas:
$179,800
According to our research of Arkansas and other state lists, there were 4 registered sex offenders living in 71644 zip code as of July 03, 2024. The ratio of all residents to sex offenders in zip code 71644 is 1,376 to 1. The ratio of registered sex offenders to all residents in this zip code is much lower than the state average.
Median resident age:
This zip code:
67.3 years
Arkansas median age:
38.9 years
Average household size:
This zip code:
1.8 people
Arkansas:
2.4 people
Averages for the 2020 tax year for zip code 71644, filed in 2021:
Average Adjusted Gross Income (AGI) in 2020: $30,870 (Individual Income Tax Returns)
Here:
$30,870
State:
$64,872
Salary/wage: $34,900 (reported on 56.8% of returns)
Here:
$34,900
State:
$50,644
(% of AGI for various income ranges: 945.0% for AGIs below $25k, 4235.0% for AGIs $25k-50k, 10980.0% for AGIs $50k-75k)
Taxable interest for individuals: $128 (reported on 40.9% of returns)
This zip code:
$128
Arkansas:
$1,857
(% of AGI for various income ranges: 1.2% for AGIs $25k-50k)
Profit/loss from business: +$3,400 (reported on 6.8% of returns)
Here:
+$3,400
State:
+$9,743
(% of AGI for various income ranges: 102.0% for AGIs below $25k)
Earned income credit: $2,133 (reported on 20.5% of returns)
Here:
$2,133
State:
$2,546
(% of AGI for various income ranges: 119.0% for AGIs below $25k, 91.2% for AGIs $25k-50k)
Percentage of individuals using paid preparers for their 2020 taxes: 61.4%
Here:
61%
State:
94%
(% for various income ranges: 42.3% for AGIs below $25k, 90.0% for AGIs $25k-50k, 80.0% for AGIs $50k-75k, 100.0% for AGIs $100k-200k)
Averages for the 2012 tax year for zip code 71644, filed in 2013:
Average Adjusted Gross Income (AGI) in 2012: $44,251 (Individual Income Tax Returns)
Here:
$44,251
State:
$52,148
Salary/wage: $32,807 (reported on 85.7% of returns)
Here:
$32,807
State:
$41,669
(% of AGI for various income ranges: 86.9% for AGIs below $25k, 86.9% for AGIs $25k-50k, 74.9% for AGIs $50k-75k, 32.6% for AGIs $100k-200k)
Taxable interest for individuals: $1,083 (reported on 17.1% of returns)
This zip code:
$1,083
Arkansas:
$1,648
Profit/loss from business: +$1,600 (reported on 8.6% of returns)
Here:
+$1,600
State:
+$9,665
Total itemized deductions: $20,200 (18% of AGI, reported on 17.1% of returns)
Here:
$20,200
State:
$23,276
Here:
17.8% of AGI
State:
19.1% of AGI
Charity contributions: $5,940 (reported on 14.3% of returns)
Here:
$5,940
State:
$5,996
Taxes paid: $7,150 (reported on 17.1% of returns)
71644:
$7,150
State:
$7,941
Earned income credit: $2,383 (reported on 34.3% of returns)
Here:
$2,383
State:
$2,455
(% of AGI for various income ranges: 10.2% for AGIs below $25k, 1.2% for AGIs $25k-50k)
Percentage of individuals using paid preparers for their 2012 taxes: 57.1%
Here:
57%
State:
61%
(% for various income ranges: 50.0% for AGIs below $25k, 54.5% for AGIs $25k-50k, 60.0% for AGIs $50k-75k, 100.0% for AGIs $100k-200k)
Averages for the 2004 tax year for zip code 71644, filed in 2005:
Average Adjusted Gross Income (AGI) in 2004: $32,281 (Individual Income Tax Returns)
Here:
$32,281
State:
$39,270
Salary/wage: $26,372 (reported on 89.5% of returns)
Here:
$26,372
State:
$34,079
(% of AGI for various income ranges: 111.1% for AGIs below $10k, 89.4% for AGIs $10k-25k, 85.4% for AGIs $25k-50k, 70.3% for AGIs $50k-75k, 92.2% for AGIs $75k-100k, 31.8% for AGIs over 100k)
Taxable interest for individuals: $1,796 (reported on 22.7% of returns)
This zip code:
$1,796
Arkansas:
$1,904
(% of AGI for various income ranges: 0.4% for AGIs $10k-25k, 0.7% for AGIs $25k-50k, 1.1% for AGIs $50k-75k, 3.5% for AGIs over 100k)
Taxable dividends: $1,756 (reported on 10.0% of returns)
Here:
$1,756
State:
$5,995
(% of AGI for various income ranges: 0.2% for AGIs $10k-25k, 0.2% for AGIs $50k-75k, 2.1% for AGIs over 100k)
Profit/loss from business: +$1,121 (reported on 8.1% of returns)
Here:
+$1,121
State:
+$7,823
Total itemized deductions: $17,465 (23% of AGI, reported on 17.4% of returns)
Here:
$17,465
State:
$18,389
Here:
23.1% of AGI
State:
21.0% of AGI
Charity contributions deductions: $4,391 (6% of AGI, reported on 15.6% of returns)
Here:
$4,391
State:
$4,725
Here:
5.9% of AGI
State:
5.1% of AGI
Total tax: $5,084 (reported on 58.2% of returns)
71644:
$5,084
State:
$6,047
(% of AGI for various income ranges: 2.3% for AGIs below $10k, 2.6% for AGIs $10k-25k, 5.3% for AGIs $25k-50k, 10.6% for AGIs $50k-75k, 11.3% for AGIs $75k-100k, 19.1% for AGIs over 100k)
Earned income credit: $2,148 (reported on 39.6% of returns)
Here:
$2,148
State:
$1,909
Percentage of individuals using paid preparers for their 2004 taxes: 68.2%
Here:
68%
State:
67%
(% for various income ranges: 67.5% for AGIs below $10k, 72.3% for AGIs $10k-25k, 62.3% for AGIs $25k-50k, 62.2% for AGIs $50k-75k, 71.4% for AGIs $75k-100k, 93.3% for AGIs over 100k)
Household received Food Stamps/SNAP in the past 12 months: 33 Household did not receive Food Stamps/SNAP in the past 12 months: 204
Women who had a birth in the past 12 months: 5 (0 now married, 5 unmarried) Women who did not have a birth in the past 12 months: 38 (20 now married, 18 unmarried)
Housing units in zip code 71644 with a mortgage: 124 (1 second mortgage) Median monthly owner costs for units with a mortgage: $942 Median monthly owner costs for units without a mortgage: $295
Residents with income below the poverty level in 2022:
This zip code:
13.4%
Whole state:
16.8%
Residents with income below 50% of the poverty level in 2022:
This zip code:
13.4%
Whole state:
8.5%
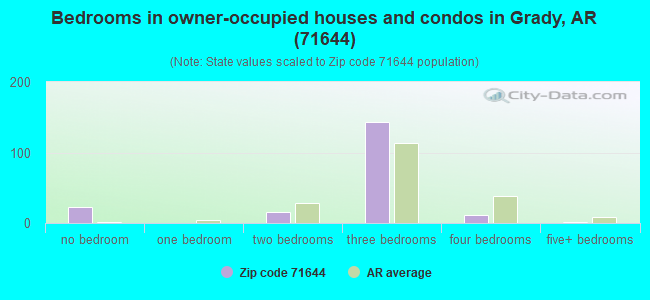
Median number of rooms in houses and condos:
Here:
5.9
State:
6.1
Median number of rooms in apartments:
Here:
5.0
State:
4.3
Notable locations in this zip code not listed on our city pages
Notable locations in zip code 71644: Goat Shed (A), Heckatoo Landing (B), State Penal Farm Number 2 (C), Grady Public Library (D), Grady Fire Department (E), Grady Police Department (F). Display/hide their locations on the map
Churches in zip code 71644 include: Church of God (A), Damascus Church (B), Daniels Chapel (C), First Baptist Church (D), Kinnlen Star Church (E), Marzell Church (F), Mount Zion Church (G), New Saint James Zion Church (H), Olive Branch Church (I). Display/hide their locations on the map
Cemeteries: Rice Cemetery (1), Randolph Cemetery (2), Grady Cemetery (3), Gocio Cemetery (4), Wynn Cemetery (5), McBride Cemetery (6), Round Lake Cemetery (7). Display/hide their locations on the map
Size of family households: 154 2-persons, 15 3-persons, 1 4-persons, 5 5-persons, 3 6-persons
Size of nonfamily households: 61 1-person
28 married couples with children.
16 single-parent households (5 men, 11 women).
101.1% of residents of 71644 zip code speak English at home.
Foreign born population: 0 (0.0%)
:
0.0%
Whole state:
5.1%
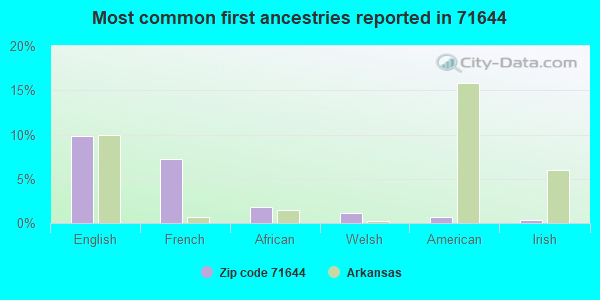
10%English
7%French
2%African
1%Welsh
1%American
0%Irish
Facilities with environmental interests located in this zip code:
GRADY, CITY OF-WWTP (1MI NE OF HWY 65 & 11 JUNCTION in GRADY, AR)
National Pollutant Discharge Elimination System NON-MAJOR (Tracking pollutant discharge elimination systems) - permit COMMUNITY WATER SYSTEM (SDWIS) - SDWIS-AR0000317 1, WATER TREATMENT PLANT, SDWIS-AR0000317 2, Business SIC classification: SEWERAGE SYSTEMS Alternative names: GRADY WATERWORKS
GRADY ELEMENTARY SCHOOL (804 HWY. 65 S. in GRADY, AR)
(Geographic Names Information System) (National Center for Education Statistics) - STATE ID-4002010
GRADY HIGH SCHOOL (907 S. MAIN in GRADY, AR)
(Geographic Names Information System) (National Center for Education Statistics) - STATE ID-4002011
GRADY SHELL (HWY 65 SOUTH in GRADY, AR)
(Integrated Compliance Information System) - ICIS-06-2003-5313, FORMAL ENFORCEMENT ACTION
AR DEPT OF CORRECTION-CUMMINS (HWY 388 in GRADY, AR)
National Pollutant Discharge Elimination System NON-MAJOR (Tracking pollutant discharge elimination systems) - permit Business SIC classification: CORRECTIONAL INSTITUTIONS Alternative names: AR DEPT OF CORRECTIONS-CUMMINS
Housing units lacking complete plumbing facilities: 11.7% Housing units lacking complete kitchen facilities: 7.2%
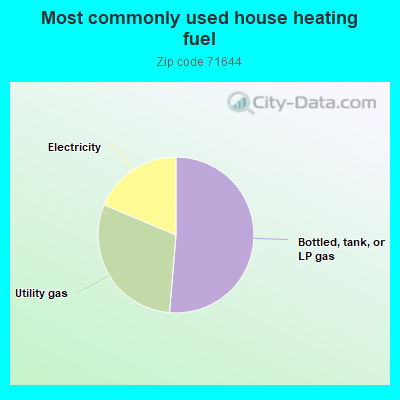
51.7%Bottled, tank, or LP gas
30.2%Utility gas
18.8%Electricity
Population in 1990: 3,768. Population change in the 1990s: +446 (+11.8%).
Place of birth for U.S.-born residents:
This state: 341
Midwest: 13
South: 62
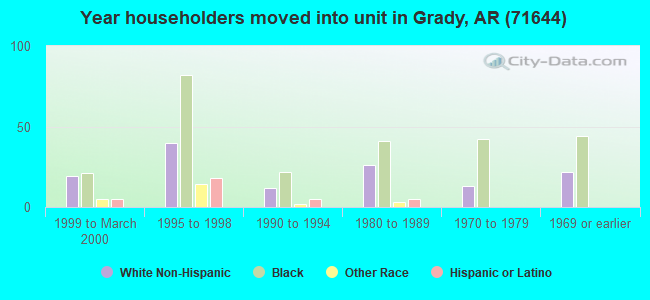
38% of the 71644 zip code residents lived in the same house 5 years ago. Out of people who lived in different houses, 5% lived in this county. Out of people who lived in different counties, 50% lived in Arkansas.
99% of the 71644 zip code residents lived in the same house 1 year ago. Out of people who lived in different houses, 25% moved from this county. Out of people who lived in different houses, 75% moved from different state.
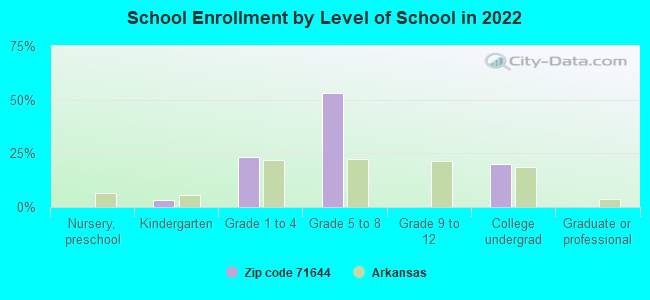
Private vs. public school enrollment:
Students in private schools in grades 1 to 8 (elementary and middle school):
Here:
0.0%
Arkansas:
10.5%
Students in private schools in grades 9 to 12 (high school):
Here:
0.0%
Arkansas:
8.7%
Students in private undergraduate colleges: 2
Here:
32.8%
Arkansas:
19.4%
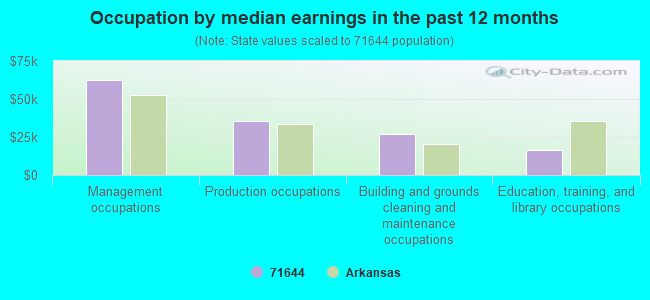
Occupation by median earnings in the past 12 months ($)
62,358Management occupations
35,789Production occupations
27,104Building and grounds cleaning and maintenance occupations
16,344Education, training, and library occupations
Companies with federal contracts located in this zip code:
LEVI G HOOVER (1102 SHEA ST in GRADY, AR; small business) : $782,238 in 54 contractsfrom 2002 to 2006
Contracts for Landscaping/Groundskeeping Services, Trash/Garbage Collection Services - Including Portable Sanitation Services, Construction of Structures and Facilities -- Office Buildings by Army, U.S. Army Corps of Engineers - civil program financing only Signed by year:2000: $0; 2001: $0; 2002: $83,941; 2003: $122,407; 2004: $292,410; 2005: $154,885; 2006: $128,595.
Biggest contracts:
$81,040 with Army for Landscaping/Groundskeeping Services. Signed on 2006-03-27. Completion date: 2006-09-30.
$73,220, same as above.Signed on 2004-05-07. Completion date: 2004-09-30.
$73,220 with U.S. Army Corps of Engineers - civil program financing only for Landscaping/Groundskeeping Services. Signed on 2004-05-07. Completion date: 2004-09-30.
$54,840, same as above.Signed on 2002-03-25. Completion date: 2002-09-28.
RAULS CLEANING SERVICE (ROUTE 1 BOX 1K in GRADY, AR) : $382,470 in 30 contractsfrom 2001 to 2005
Contracts for Custodial Janitorial Services, Other Housekeeping Services by U.S. Army Corps of Engineers - civil program financing only, Army Signed by year:2000: $0; 2001: $21,280; 2002: $60,925; 2003: $88,995; 2004: $163,934; 2005: $47,336; 2006: $0.
Biggest contracts:
$68,485 with U.S. Army Corps of Engineers - civil program financing only for Custodial Janitorial Services. Signed on 2004-01-06. Completion date: 2004-09-30.
$68,485 with Army for Custodial Janitorial Services. Signed on 2004-01-06. Completion date: 2004-09-30.
$48,590 with U.S. Army Corps of Engineers - civil program financing only for Custodial Janitorial Services. Signed on 2003-02-27. Completion date: 2003-09-30.
$38,815, same as above.Signed on 2002-04-19. Completion date: 2002-09-30.
Top industries in this zip code by the number of employees in 2005:
Health Care and Social Assistance: All Other Outpatient Care Centers (20-49 employees: 2 establishments)
Construction: Power and Communication Line and Related Structures Construction (10-19: 1)
Wholesale Trade: Farm and Garden Machinery and Equipment Merchant Wholesalers (5-9: 1)
Finance and Insurance: Commercial Banking (1-4: 1)
Other Services (except Public Administration): Commercial and Industrial Machinery and Equipment (except Automotive and Electronic) Repair and Maintenance (1-4: 1)
People in group quarters in 2010:
3,288 people in state prisons
People in group quarters in 2000:
3,003 people in state prisons
Fatal accident statistics in 2013:
Fatal accident count: 2
Vehicles involved in fatal accidents: 2
Fatal accidents caused by drunken drivers: 0
Fatalities: 2
Persons involved in fatal accidents: 2
Pedestrians involved in fatal accidents: 1
Home Mortgage Disclosure Act Aggregated Statistics For Year 2009 (Based on 4 partial tracts)
A) FHA, FSA/RHS & VA Home Purchase Loans
C) Refinancings
D) Home Improvement Loans
F) Non-occupant Loans on < 5 Family Dwellings (A B C & D)
G) Loans On Manufactured Home Dwelling (A B C & D)
Number
Average Value
Number
Average Value
Number
Average Value
Number
Average Value
Number
Average Value
LOANS ORIGINATED
1
$77,760
3
$92,997
2
$33,890
1
$19,440
0
$0
APPLICATIONS APPROVED, NOT ACCEPTED
0
$0
0
$0
0
$0
0
$0
0
$0
APPLICATIONS DENIED
1
$40,980
0
$0
0
$0
0
$0
0
$0
APPLICATIONS WITHDRAWN
0
$0
1
$3,150
0
$0
0
$0
1
$3,150
FILES CLOSED FOR INCOMPLETENESS
0
$0
1
$42,560
0
$0
0
$0
0
$0
Aggregated Statistics For Year 2008 (Based on 4 partial tracts)
A) FHA, FSA/RHS & VA Home Purchase Loans
B) Conventional Home Purchase Loans
C) Refinancings
D) Home Improvement Loans
F) Non-occupant Loans on < 5 Family Dwellings (A B C & D)
G) Loans On Manufactured Home Dwelling (A B C & D)
Number
Average Value
Number
Average Value
Number
Average Value
Number
Average Value
Number
Average Value
Number
Average Value
LOANS ORIGINATED
0
$0
0
$0
1
$59,370
1
$16,290
1
$16,290
0
$0
APPLICATIONS APPROVED, NOT ACCEPTED
1
$39,930
0
$0
1
$118,210
0
$0
0
$0
0
$0
APPLICATIONS DENIED
1
$40,460
1
$11,030
2
$64,885
0
$0
1
$26,800
1
$11,030
APPLICATIONS WITHDRAWN
0
$0
0
$0
1
$39,400
0
$0
0
$0
0
$0
FILES CLOSED FOR INCOMPLETENESS
0
$0
0
$0
0
$0
0
$0
0
$0
0
$0
Aggregated Statistics For Year 2007 (Based on 4 partial tracts)
A) FHA, FSA/RHS & VA Home Purchase Loans
B) Conventional Home Purchase Loans
C) Refinancings
D) Home Improvement Loans
G) Loans On Manufactured Home Dwelling (A B C & D)
Number
Average Value
Number
Average Value
Number
Average Value
Number
Average Value
Number
Average Value
LOANS ORIGINATED
0
$0
2
$54,380
3
$58,493
0
$0
1
$27,320
APPLICATIONS APPROVED, NOT ACCEPTED
0
$0
0
$0
1
$46,760
0
$0
0
$0
APPLICATIONS DENIED
1
$32,570
1
$53,070
1
$67,250
2
$49,915
1
$42,030
APPLICATIONS WITHDRAWN
0
$0
0
$0
0
$0
0
$0
0
$0
FILES CLOSED FOR INCOMPLETENESS
0
$0
0
$0
0
$0
0
$0
0
$0
Aggregated Statistics For Year 2006 (Based on 4 partial tracts)
A) FHA, FSA/RHS & VA Home Purchase Loans
B) Conventional Home Purchase Loans
C) Refinancings
D) Home Improvement Loans
F) Non-occupant Loans on < 5 Family Dwellings (A B C & D)
G) Loans On Manufactured Home Dwelling (A B C & D)
Number
Average Value
Number
Average Value
Number
Average Value
Number
Average Value
Number
Average Value
Number
Average Value
LOANS ORIGINATED
2
$55,955
5
$57,374
3
$54,467
1
$19,970
2
$44,135
2
$43,085
APPLICATIONS APPROVED, NOT ACCEPTED
0
$0
1
$18,390
0
$0
0
$0
0
$0
1
$18,390
APPLICATIONS DENIED
0
$0
2
$20,755
1
$74,080
1
$99,830
0
$0
1
$25,740
APPLICATIONS WITHDRAWN
0
$0
0
$0
1
$117,690
0
$0
1
$46,760
0
$0
FILES CLOSED FOR INCOMPLETENESS
0
$0
0
$0
0
$0
0
$0
0
$0
0
$0
Aggregated Statistics For Year 2005 (Based on 4 partial tracts)
A) FHA, FSA/RHS & VA Home Purchase Loans
B) Conventional Home Purchase Loans
C) Refinancings
D) Home Improvement Loans
F) Non-occupant Loans on < 5 Family Dwellings (A B C & D)
G) Loans On Manufactured Home Dwelling (A B C & D)
Number
Average Value
Number
Average Value
Number
Average Value
Number
Average Value
Number
Average Value
Number
Average Value
LOANS ORIGINATED
1
$23,640
4
$101,270
3
$80,560
1
$10,510
1
$39,400
1
$8,930
APPLICATIONS APPROVED, NOT ACCEPTED
1
$8,930
2
$18,390
1
$51,490
0
$0
0
$0
2
$22,855
APPLICATIONS DENIED
1
$25,220
4
$58,188
4
$71,980
2
$13,400
0
$0
4
$33,100
APPLICATIONS WITHDRAWN
0
$0
1
$53,070
2
$45,185
1
$26,270
1
$44,660
1
$8,410
FILES CLOSED FOR INCOMPLETENESS
0
$0
0
$0
0
$0
0
$0
0
$0
0
$0
Aggregated Statistics For Year 2004 (Based on 4 partial tracts)
A) FHA, FSA/RHS & VA Home Purchase Loans
B) Conventional Home Purchase Loans
C) Refinancings
D) Home Improvement Loans
E) Loans on Dwellings For 5+ Families
G) Loans On Manufactured Home Dwelling (A B C & D)
Number
Average Value
Number
Average Value
Number
Average Value
Number
Average Value
Number
Average Value
Number
Average Value
LOANS ORIGINATED
1
$21,020
2
$33,365
7
$86,316
1
$28,370
1
$294,220
2
$38,880
APPLICATIONS APPROVED, NOT ACCEPTED
1
$14,710
0
$0
4
$59,370
0
$0
0
$0
0
$0
APPLICATIONS DENIED
1
$65,670
3
$41,157
2
$95,625
2
$10,510
0
$0
2
$21,015
APPLICATIONS WITHDRAWN
0
$0
0
$0
2
$69,615
0
$0
0
$0
1
$21,020
FILES CLOSED FOR INCOMPLETENESS
0
$0
0
$0
0
$0
0
$0
0
$0
0
$0
Aggregated Statistics For Year 2003 (Based on 4 partial tracts)
A) FHA, FSA/RHS & VA Home Purchase Loans
B) Conventional Home Purchase Loans
C) Refinancings
D) Home Improvement Loans
F) Non-occupant Loans on < 5 Family Dwellings (A B C & D)
Number
Average Value
Number
Average Value
Number
Average Value
Number
Average Value
Number
Average Value
LOANS ORIGINATED
0
$0
2
$59,105
3
$43,083
2
$4,205
1
$19,440
APPLICATIONS APPROVED, NOT ACCEPTED
0
$0
1
$17,340
2
$91,155
0
$0
0
$0
APPLICATIONS DENIED
1
$24,690
3
$31,173
4
$39,930
1
$3,680
0
$0
APPLICATIONS WITHDRAWN
0
$0
1
$5,250
2
$28,110
0
$0
0
$0
FILES CLOSED FOR INCOMPLETENESS
0
$0
0
$0
0
$0
0
$0
0
$0
Aggregated Statistics For Year 2002 (Based on 4 partial tracts)
B) Conventional Home Purchase Loans
C) Refinancings
D) Home Improvement Loans
F) Non-occupant Loans on < 5 Family Dwellings (A B C & D)
Number
Average Value
Number
Average Value
Number
Average Value
Number
Average Value
LOANS ORIGINATED
4
$51,882
1
$54,120
0
$0
1
$30,470
APPLICATIONS APPROVED, NOT ACCEPTED
0
$0
4
$38,092
1
$10,510
0
$0
APPLICATIONS DENIED
3
$29,073
2
$44,920
2
$5,780
1
$10,510
APPLICATIONS WITHDRAWN
1
$24,170
2
$15,235
0
$0
0
$0
FILES CLOSED FOR INCOMPLETENESS
0
$0
0
$0
0
$0
0
$0
Aggregated Statistics For Year 2001 (Based on 4 partial tracts)
B) Conventional Home Purchase Loans
C) Refinancings
D) Home Improvement Loans
F) Non-occupant Loans on < 5 Family Dwellings (A B C & D)
Number
Average Value
Number
Average Value
Number
Average Value
Number
Average Value
LOANS ORIGINATED
2
$54,115
3
$52,890
1
$1,050
1
$1,050
APPLICATIONS APPROVED, NOT ACCEPTED
1
$38,350
1
$36,780
1
$9,460
0
$0
APPLICATIONS DENIED
2
$49,650
2
$31,525
1
$7,880
0
$0
APPLICATIONS WITHDRAWN
0
$0
2
$23,645
0
$0
0
$0
FILES CLOSED FOR INCOMPLETENESS
0
$0
0
$0
0
$0
0
$0
Aggregated Statistics For Year 2000 (Based on 4 partial tracts)
A) FHA, FSA/RHS & VA Home Purchase Loans
B) Conventional Home Purchase Loans
C) Refinancings
D) Home Improvement Loans
F) Non-occupant Loans on < 5 Family Dwellings (A B C & D)
Number
Average Value
Number
Average Value
Number
Average Value
Number
Average Value
Number
Average Value
LOANS ORIGINATED
0
$0
5
$36,358
2
$52,015
2
$8,145
2
$20,230
APPLICATIONS APPROVED, NOT ACCEPTED
1
$12,610
3
$50,263
1
$53,590
1
$4,200
0
$0
APPLICATIONS DENIED
0
$0
7
$48,111
6
$38,880
1
$13,130
1
$53,590
APPLICATIONS WITHDRAWN
0
$0
0
$0
2
$48,860
0
$0
0
$0
FILES CLOSED FOR INCOMPLETENESS
0
$0
0
$0
2
$39,670
1
$29,950
0
$0
Aggregated Statistics For Year 1999 (Based on 2 partial tracts)
B) Conventional Home Purchase Loans
C) Refinancings
D) Home Improvement Loans
F) Non-occupant Loans on < 5 Family Dwellings (A B C & D)
Detailed PMIC statistics for the following Tracts:0008.00
2002 - 2018 National Fire Incident Reporting System (NFIRS) incidents
According to the data from the years 2002 - 2018 the average number of fires per year is 7. The highest number of fire incidents - 19 took place in 2011, and the least - 0 in 2004. The data has a growing trend.
When looking into fire subcategories, the most reports belonged to: Structure Fires (44.1%), and Outside Fires (34.6%).
Fire incident types reported to NFIRS in Zip Code 71644


 Nearest zip codes: 71659, 71643, 72004, 71601, 71667, 72175.


 According to the data from the years 2002 - 2018 the average number of fires per year is 7. The highest number of fire incidents - 19 took place in 2011, and the least - 0 in 2004. The data has a growing trend.
 When looking into fire subcategories, the most reports belonged to: Structure Fires (44.1%), and Outside Fires (34.6%).