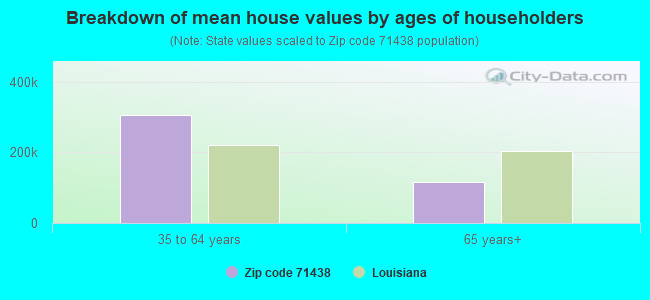
Estimated median house/condo value in 2022: $188,523
71438:
$188,523
Louisiana:
$209,200
According to our research of Louisiana and other state lists, there were 5 registered sex offenders living in 71438 zip code as of July 05, 2024. The ratio of all residents to sex offenders in zip code 71438 is 340 to 1. The ratio of registered sex offenders to all residents in this zip code is near the state average.
Median resident age:
This zip code:
52.1 years
Louisiana median age:
38.2 years
Average household size:
This zip code:
2.3 people
Louisiana:
2.5 people
Averages for the 2020 tax year for zip code 71438, filed in 2021:
Average Adjusted Gross Income (AGI) in 2020: $58,986 (Individual Income Tax Returns)
Here:
$58,986
State:
$60,757
Salary/wage: $55,924 (reported on 84.1% of returns)
Here:
$55,924
State:
$50,882
(% of AGI for various income ranges: 1166.0% for AGIs below $25k, 3780.0% for AGIs $25k-50k, 6348.6% for AGIs $50k-75k, 10350.0% for AGIs $75k-100k, 17605.0% for AGIs $100k-200k)
Taxable interest for individuals: $393 (reported on 21.7% of returns)
This zip code:
$393
Louisiana:
$1,576
(% of AGI for various income ranges: 3.3% for AGIs below $25k, 9.2% for AGIs $25k-50k, 4.3% for AGIs $50k-75k, 8.6% for AGIs $75k-100k, 41.2% for AGIs $100k-200k)
Ordinary dividends: $450 (reported on 5.8% of returns)
Here:
$450
State:
$7,743
(% of AGI for various income ranges: 25.7% for AGIs $75k-100k)
Net capital gain/loss in AGI: +$2,200 (reported on 5.8% of returns)
Here:
+$2,200
State:
+$16,917
(% of AGI for various income ranges: 125.7% for AGIs $75k-100k)
Profit/loss from business: +$5,192 (reported on 17.4% of returns)
Here:
+$5,192
State:
+$7,679
(% of AGI for various income ranges: 117.3% for AGIs below $25k, 160.0% for AGIs $25k-50k, 481.4% for AGIs $50k-75k)
Taxable individual retirement arrangement distribution: $7,900 (reported on 4.3% of returns)
71438:
$7,900
Louisiana:
$20,716
(% of AGI for various income ranges: 182.3% for AGIs $25k-50k)
Total itemized deductions: $28,375 (reported on 5.8% of returns)
Here:
$28,375
State:
$36,265
(% of AGI for various income ranges: 1418.8% for AGIs $100k-200k)
Taxes paid: $6,100 (reported on 2.9% of returns)
71438:
$6,100
State:
$6,643
(% of AGI for various income ranges: 174.3% for AGIs $75k-100k)
Earned income credit: $2,283 (reported on 17.4% of returns)
Here:
$2,283
State:
$2,671
(% of AGI for various income ranges: 111.3% for AGIs below $25k, 82.3% for AGIs $25k-50k)
Percentage of individuals using paid preparers for their 2020 taxes: 91.3%
Here:
91%
State:
92%
(% for various income ranges: 90.5% for AGIs below $25k, 88.2% for AGIs $25k-50k, 88.9% for AGIs $50k-75k, 100.0% for AGIs $75k-100k, 91.7% for AGIs $100k-200k)
Averages for the 2012 tax year for zip code 71438, filed in 2013:
Average Adjusted Gross Income (AGI) in 2012: $51,025 (Individual Income Tax Returns)
Here:
$51,025
State:
$56,730
Salary/wage: $48,160 (reported on 91.8% of returns)
Here:
$48,160
State:
$45,545
(% of AGI for various income ranges: 75.7% for AGIs below $25k, 86.7% for AGIs $25k-50k, 92.7% for AGIs $50k-75k, 87.2% for AGIs $75k-100k, 84.5% for AGIs $100k-200k)
Taxable interest for individuals: $395 (reported on 26.0% of returns)
This zip code:
$395
Louisiana:
$1,804
(% of AGI for various income ranges: 0.6% for AGIs below $25k, 0.1% for AGIs $25k-50k, 0.2% for AGIs $75k-100k, 0.3% for AGIs $100k-200k)
Profit/loss from business: +$5,073 (reported on 15.1% of returns)
Here:
+$5,073
State:
+$12,088
(% of AGI for various income ranges: 8.4% for AGIs below $25k, 1.6% for AGIs $25k-50k, 2.6% for AGIs $75k-100k)
Taxable individual retirement arrangement distribution: $6,750 (reported on 2.7% of returns)
71438:
$6,750
Louisiana:
$16,085
Total itemized deductions: $20,873 (23% of AGI, reported on 20.5% of returns)
Here:
$20,873
State:
$23,585
Here:
22.5% of AGI
State:
18.1% of AGI
(% of AGI for various income ranges: 5.4% for AGIs $25k-50k, 7.7% for AGIs $50k-75k, 9.4% for AGIs $75k-100k, 12.1% for AGIs $100k-200k)
Charity contributions: $6,410 (reported on 13.7% of returns)
Here:
$6,410
State:
$5,533
(% of AGI for various income ranges: 1.8% for AGIs $50k-75k, 1.9% for AGIs $75k-100k, 2.9% for AGIs $100k-200k)
Taxes paid: $3,840 (reported on 20.5% of returns)
71438:
$3,840
State:
$6,282
(% of AGI for various income ranges: 0.6% for AGIs $25k-50k, 1.2% for AGIs $50k-75k, 1.5% for AGIs $75k-100k, 2.8% for AGIs $100k-200k)
Earned income credit: $2,223 (reported on 17.8% of returns)
Here:
$2,223
State:
$2,633
(% of AGI for various income ranges: 7.0% for AGIs below $25k, 1.3% for AGIs $25k-50k)
Percentage of individuals using paid preparers for their 2012 taxes: 63.0%
Here:
63%
State:
57%
(% for various income ranges: 60.0% for AGIs below $25k, 58.8% for AGIs $25k-50k, 64.3% for AGIs $50k-75k, 66.7% for AGIs $75k-100k, 75.0% for AGIs $100k-200k)
Averages for the 2004 tax year for zip code 71438, filed in 2005:
Average Adjusted Gross Income (AGI) in 2004: $35,259 (Individual Income Tax Returns)
Here:
$35,259
State:
$39,411
Salary/wage: $34,727 (reported on 88.3% of returns)
Here:
$34,727
State:
$34,434
(% of AGI for various income ranges: 125.8% for AGIs below $10k, 81.3% for AGIs $10k-25k, 90.8% for AGIs $25k-50k, 89.4% for AGIs $50k-75k, 82.4% for AGIs $75k-100k, 79.1% for AGIs over 100k)
Taxable interest for individuals: $621 (reported on 30.0% of returns)
This zip code:
$621
Louisiana:
$1,606
(% of AGI for various income ranges: 2.2% for AGIs below $10k, 0.2% for AGIs $10k-25k, 0.3% for AGIs $25k-50k, 0.7% for AGIs $50k-75k, 0.4% for AGIs $75k-100k, 0.9% for AGIs over 100k)
Taxable dividends: $259 (reported on 4.1% of returns)
Here:
$259
State:
$3,235
Net capital gain/loss: +$938 (reported on 4.8% of returns)
Here:
+$938
State:
+$8,531
Profit/loss from business: +$4,198 (reported on 19.1% of returns)
Here:
+$4,198
State:
+$9,128
(% of AGI for various income ranges: 25.0% for AGIs below $10k, 6.8% for AGIs $10k-25k, 1.7% for AGIs $25k-50k, 0.4% for AGIs $50k-75k, 2.2% for AGIs $75k-100k)
IRA payment deduction: $909 (reported on 1.7% of returns)
71438:
$909
Louisiana:
$3,055
Total itemized deductions: $16,176 (25% of AGI, reported on 18.0% of returns)
Here:
$16,176
State:
$18,222
Here:
25.4% of AGI
State:
20.3% of AGI
(% of AGI for various income ranges: 4.4% for AGIs $10k-25k, 8.4% for AGIs $25k-50k, 7.7% for AGIs $50k-75k, 9.2% for AGIs $75k-100k, 13.1% for AGIs over 100k)
Charity contributions deductions: $4,620 (7% of AGI, reported on 13.9% of returns)
Here:
$4,620
State:
$4,190
Here:
7.0% of AGI
State:
4.4% of AGI
(% of AGI for various income ranges: 1.6% for AGIs $25k-50k, 1.4% for AGIs $50k-75k, 3.8% for AGIs $75k-100k, 3.3% for AGIs over 100k)
Total tax: $3,786 (reported on 71.4% of returns)
71438:
$3,786
State:
$6,529
(% of AGI for various income ranges: 5.7% for AGIs below $10k, 3.6% for AGIs $10k-25k, 5.1% for AGIs $25k-50k, 8.0% for AGIs $50k-75k, 10.4% for AGIs $75k-100k, 15.1% for AGIs over 100k)
Earned income credit: $1,742 (reported on 24.7% of returns)
Here:
$1,742
State:
$2,103
Percentage of individuals using paid preparers for their 2004 taxes: 67.7%
Here:
68%
State:
61%
(% for various income ranges: 63.0% for AGIs below $10k, 64.5% for AGIs $10k-25k, 69.7% for AGIs $25k-50k, 69.1% for AGIs $50k-75k, 78.9% for AGIs $75k-100k, 73.9% for AGIs over 100k)
Household received Food Stamps/SNAP in the past 12 months: 38 Household did not receive Food Stamps/SNAP in the past 12 months: 456
Women who had a birth in the past 12 months: 48 (21 now married, 26 unmarried) Women who did not have a birth in the past 12 months: 167 (45 now married, 123 unmarried)
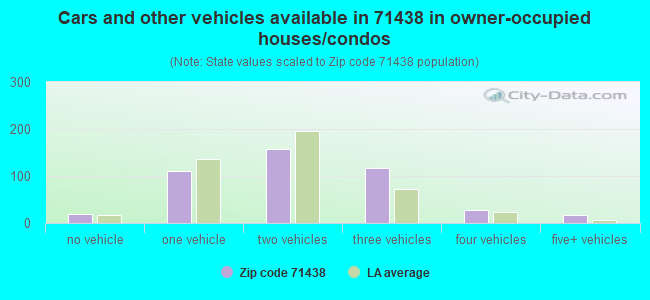
Housing units in zip code 71438 with a mortgage: 189 Median monthly owner costs for units with a mortgage: $1,151 Median monthly owner costs for units without a mortgage: $356
Residents with income below the poverty level in 2022:
This zip code:
4.5%
Whole state:
18.6%
Residents with income below 50% of the poverty level in 2022:
This zip code:
4.5%
Whole state:
10.1%
Median number of rooms in houses and condos:
Here:
5.2
State:
6.2
Notable locations in this zip code not listed on our city pages
Notable locations in zip code 71438: Oak Hill Volunteer Fire Department Station 1 (A), Oak Hill Volunteer Fire Department Station 4 (B). Display/hide their locations on the map
Churches in zip code 71438 include: Beechwood Church (A), Big Hammock Church (B), Lacamp Church (C), Leander Church (D), Mount Moriah Church (E), Oak Grove Church (F), Twin Oak Church (G), Oak Grove Church (H). Display/hide their locations on the map
Cemeteries: Upper Mount Moriah Cemetery (1), Doyle Cemetery (2), Smith Cemetery (3), Mount Moriah Cemetery (4), Oak Grove Cemetery (5). Display/hide their locations on the map
Streams, rivers, and creeks: Bay Branch (A), Buck Creek (B), Big Creek (C), Hathaway Branch (D), Hineston Branch (E), Houge Branch (F), Merchant Branch (G), Mineral Branch (H), Padget Branch (I). Display/hide their locations on the map
Size of family households: 206 2-persons, 109 3-persons, 54 4-persons
Size of nonfamily households: 132 1-person
83 married couples with children.
56 single-parent households (56 men).
98.9% of residents of 71438 zip code speak English at home.
1.8% of residents speak Asian or Pacific Island language at home (100% very well).
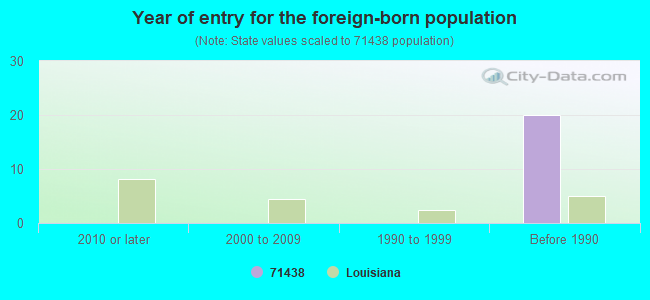
Foreign born population: 8 (0.7%) (100.0% of them are naturalized citizens)
This zip code:
0.7%
Whole state:
4.2%
88%France
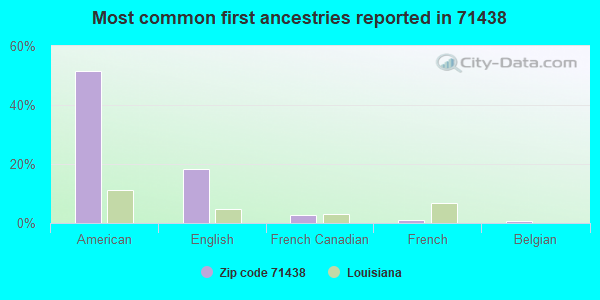
51%American
18%English
3%French Canadian
1%French
1%Belgian
Year of entry for the foreign-born population
02010 or later
02000 to 2009
01990 to 1999
20Before 1990
Facilities with environmental interests located in this zip code:
OAK HILL HIGH SCHOOL (7362 HIGHWAY 112 in HINESTON, LA)
(Geographic Names Information System) (National Center for Education Statistics) - STATE ID-040028 Organizations: RAPIDES PARISH SCHOOL BOARD (SCHOOL DISTRICT)
HINESTON WATER SYS, INC (PO BOX 100 in HINESTON, LA)
(Integrated Compliance Information System) - ICIS-06-2000-0756, FORMAL ENFORCEMENT ACTION Business SIC classification: WATER SUPPLY
HINESTON STORAGE YARD (LA 121 in HINESTON, LA)
National Pollutant Discharge Elimination System NON-MAJOR (Tracking pollutant discharge elimination systems) - permit Alternative names: LA DOTD
Housing units lacking complete plumbing facilities: 9.1% Housing units lacking complete kitchen facilities: 9.5%
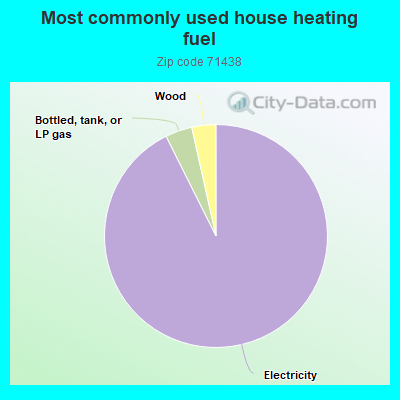
92.9%Electricity
3.9%Bottled, tank, or LP gas
3.5%Wood
Population in 1990: 854. Population change in the 1990s: +433 (+50.7%).
Place of birth for U.S.-born residents:
This state: 1,013
Midwest: 6
South: 18
West: 71
80% of the 71438 zip code residents lived in the same house 5 years ago. Out of people who lived in different houses, 74% lived in this county. Out of people who lived in different counties, 50% lived in Louisiana.
98% of the 71438 zip code residents lived in the same house 1 year ago. Out of people who lived in different houses, 160% moved from abroad.
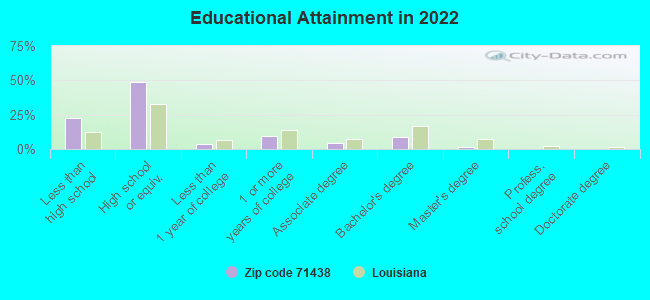
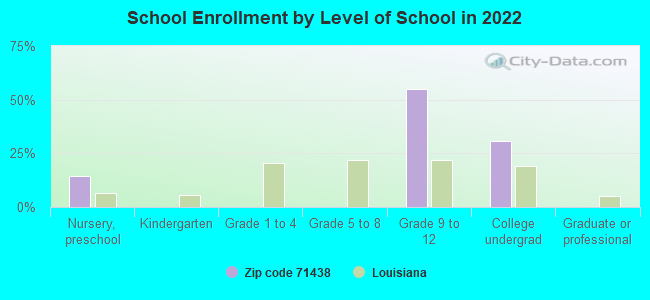
Students in private schools in grades 9 to 12 (high school):
Here:
0.0%
Louisiana:
18.3%
Students in private undergraduate colleges:
Here:
0.0%
Louisiana:
17.4%
Occupation by median earnings in the past 12 months ($)
139,950Installation, maintenance, and repair occupations
47,431Education, training, and library occupations
39,657Sales and related occupations
27,929Construction and extraction occupations
25,977Office and administrative support occupations
Companies with federal contracts located in this zip code:
WELLMAN TRUCKING (219 POE RD in LACAMP, LA; small business) : $2,722,596 in 41 contractsfrom 2000 to 2004
Contracts for Mineral Construction Materials, Bulk, Miscellaneous Construction Materials, Nonmetallic Scrap, Except Textile by Army Signed by year:2000: $844,821; 2001: $882,235; 2002: $1,092,356; 2003: $526,347; 2004: -$623,163; 2005: $0; 2006: $0.
Biggest contracts:
$299,991 with Army for Mineral Construction Materials, Bulk. Signed on 2002-09-18. Completion date: 2002-12-11.
$243,009, same as above.Signed on 2003-10-28. Completion date: 2003-10-27.
$201,750 with Army for Miscellaneous Construction Materials. Signed on 2000-08-29. Completion date: 2000-08-30.
$194,850 with Army for Mineral Construction Materials, Bulk. Signed on 2002-07-31. Completion date: 2002-10-31.
MERCHANT CONSTRUCTION COMPANY (1101 HIGHWAY 463 in HINESTON, LA; small business) : $70,450 in 2 contractsin 2004
$46,500 with Army for Construction of Structures and Facilities -- Other Non-Building Facilities. Taking place in KY. Signed on 2004-05-25. Completion date: 2005-05-24.
$23,950 with Army for Landscaping/Groundskeeping Services. Signed on 2004-09-01. Completion date: 2004-10-08.
SISSY S RESTAURANT (1855 HWY 121 in HINESTON, LA; small business) : $9,265 in 2 contractsin 2002
$5,569 with Army for Meat, Poultry, and Fish. Signed on 2002-07-08. Completion date: 2002-07-10.
$3,696, same as above.Signed on 2002-07-16. Completion date: 2002-07-23.
Top industries in this zip code by the number of employees in 2005:
Health Care and Social Assistance: Nursing Care Facilities (20-49 employees: 1 establishment)
Construction: Masonry Contractors (10-19: 1)
Construction: Plumbing, Heating, and Air-Conditioning Contractors (5-9: 1)
Wholesale Trade: Computer and Computer Peripheral Equipment and Software Merchant Wholesalers (5-9: 1)
Professional, Scientific, and Technical Services: Environmental Consulting Services (1-4: 1)
People in group quarters in 2000:
60 people in nursing homes
Fatal accident statistics in 2012:
Fatal accident count: 1
Vehicles involved in fatal accidents: 1
Fatal accidents caused by drunken drivers: 0
Fatalities: 1
Persons involved in fatal accidents: 1
Pedestrians involved in fatal accidents: 1
Fatal accident statistics in 2011:
Fatal accident count: 1
Vehicles involved in fatal accidents: 2
Fatal accidents caused by drunken drivers: 0
Fatalities: 1
Persons involved in fatal accidents: 3
Pedestrians involved in fatal accidents: 0
Home Mortgage Disclosure Act Aggregated Statistics For Year 2009 (Based on 2 partial tracts)
A) FHA, FSA/RHS & VA Home Purchase Loans
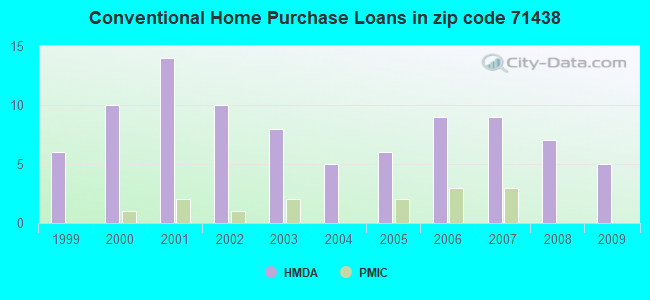
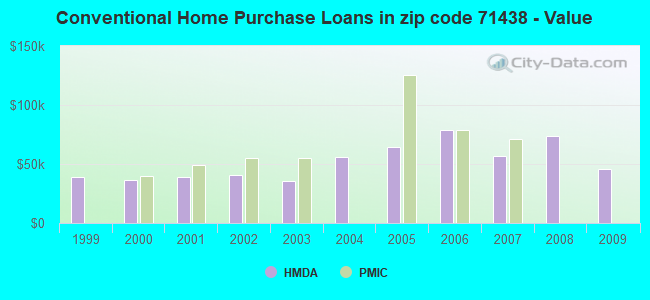
B) Conventional Home Purchase Loans
C) Refinancings
D) Home Improvement Loans
F) Non-occupant Loans on < 5 Family Dwellings (A B C & D)
G) Loans On Manufactured Home Dwelling (A B C & D)
Number
Average Value
Number
Average Value
Number
Average Value
Number
Average Value
Number
Average Value
Number
Average Value
LOANS ORIGINATED
2
$45,530
5
$45,532
7
$84,501
2
$13,780
2
$37,945
7
$47,986
APPLICATIONS APPROVED, NOT ACCEPTED
0
$0
1
$42,340
0
$0
1
$41,140
0
$0
1
$42,340
APPLICATIONS DENIED
0
$0
4
$63,505
4
$104,442
2
$4,795
0
$0
4
$40,340
APPLICATIONS WITHDRAWN
1
$83,080
0
$0
2
$90,265
0
$0
0
$0
0
$0
FILES CLOSED FOR INCOMPLETENESS
0
$0
0
$0
1
$110,230
0
$0
0
$0
0
$0
Aggregated Statistics For Year 2008 (Based on 2 partial tracts)
A) FHA, FSA/RHS & VA Home Purchase Loans
B) Conventional Home Purchase Loans
C) Refinancings
D) Home Improvement Loans
G) Loans On Manufactured Home Dwelling (A B C & D)
Number
Average Value
Number
Average Value
Number
Average Value
Number
Average Value
Number
Average Value
LOANS ORIGINATED
5
$95,456
7
$73,604
9
$69,718
4
$26,360
8
$40,539
APPLICATIONS APPROVED, NOT ACCEPTED
2
$34,550
2
$33,750
0
$0
0
$0
3
$45,530
APPLICATIONS DENIED
0
$0
4
$37,542
6
$96,322
3
$21,037
5
$36,984
APPLICATIONS WITHDRAWN
0
$0
1
$30,750
2
$85,670
0
$0
0
$0
FILES CLOSED FOR INCOMPLETENESS
0
$0
0
$0
0
$0
0
$0
0
$0
Aggregated Statistics For Year 2007 (Based on 2 partial tracts)
A) FHA, FSA/RHS & VA Home Purchase Loans
B) Conventional Home Purchase Loans
C) Refinancings
D) Home Improvement Loans
F) Non-occupant Loans on < 5 Family Dwellings (A B C & D)
G) Loans On Manufactured Home Dwelling (A B C & D)
Number
Average Value
Number
Average Value
Number
Average Value
Number
Average Value
Number
Average Value
Number
Average Value
LOANS ORIGINATED
2
$65,100
9
$56,538
13
$74,595
5
$28,198
1
$45,930
8
$38,592
APPLICATIONS APPROVED, NOT ACCEPTED
0
$0
2
$52,520
2
$26,960
1
$7,990
0
$0
3
$36,610
APPLICATIONS DENIED
0
$0
7
$37,886
8
$77,434
2
$77,485
0
$0
7
$45,360
APPLICATIONS WITHDRAWN
0
$0
1
$39,940
2
$34,550
1
$83,470
0
$0
2
$51,325
FILES CLOSED FOR INCOMPLETENESS
0
$0
0
$0
2
$101,050
0
$0
0
$0
0
$0
Aggregated Statistics For Year 2006 (Based on 2 partial tracts)
A) FHA, FSA/RHS & VA Home Purchase Loans
B) Conventional Home Purchase Loans
C) Refinancings
D) Home Improvement Loans
F) Non-occupant Loans on < 5 Family Dwellings (A B C & D)
G) Loans On Manufactured Home Dwelling (A B C & D)
Number
Average Value
Number
Average Value
Number
Average Value
Number
Average Value
Number
Average Value
Number
Average Value
LOANS ORIGINATED
2
$102,845
9
$78,460
8
$82,226
4
$38,042
1
$110,630
4
$53,520
APPLICATIONS APPROVED, NOT ACCEPTED
0
$0
3
$61,640
4
$64,103
1
$48,330
0
$0
2
$45,530
APPLICATIONS DENIED
2
$46,530
7
$44,790
9
$80,236
4
$38,042
2
$17,375
9
$41,760
APPLICATIONS WITHDRAWN
1
$59,910
1
$66,700
4
$101,948
1
$56,710
0
$0
1
$72,290
FILES CLOSED FOR INCOMPLETENESS
0
$0
0
$0
1
$97,050
0
$0
0
$0
0
$0
Aggregated Statistics For Year 2005 (Based on 2 partial tracts)
A) FHA, FSA/RHS & VA Home Purchase Loans
B) Conventional Home Purchase Loans
C) Refinancings
D) Home Improvement Loans
F) Non-occupant Loans on < 5 Family Dwellings (A B C & D)
G) Loans On Manufactured Home Dwelling (A B C & D)
Number
Average Value
Number
Average Value
Number
Average Value
Number
Average Value
Number
Average Value
Number
Average Value
LOANS ORIGINATED
1
$83,870
6
$64,037
14
$78,939
5
$24,922
0
$0
6
$38,143
APPLICATIONS APPROVED, NOT ACCEPTED
0
$0
4
$60,110
2
$42,935
1
$8,790
0
$0
5
$50,724
APPLICATIONS DENIED
2
$60,310
14
$61,080
7
$94,259
4
$18,472
1
$40,340
12
$48,960
APPLICATIONS WITHDRAWN
0
$0
0
$0
5
$107,278
1
$102,650
0
$0
1
$94,660
FILES CLOSED FOR INCOMPLETENESS
0
$0
1
$59,510
2
$96,255
0
$0
0
$0
0
$0
Aggregated Statistics For Year 2004 (Based on 2 partial tracts)
A) FHA, FSA/RHS & VA Home Purchase Loans
B) Conventional Home Purchase Loans
C) Refinancings
D) Home Improvement Loans
F) Non-occupant Loans on < 5 Family Dwellings (A B C & D)
G) Loans On Manufactured Home Dwelling (A B C & D)
Number
Average Value
Number
Average Value
Number
Average Value
Number
Average Value
Number
Average Value
Number
Average Value
LOANS ORIGINATED
1
$128,210
5
$56,316
12
$76,984
4
$9,185
2
$27,760
4
$30,755
APPLICATIONS APPROVED, NOT ACCEPTED
0
$0
1
$87,470
3
$74,820
0
$0
0
$0
1
$34,750
APPLICATIONS DENIED
0
$0
4
$56,215
12
$63,138
5
$22,286
0
$0
5
$39,222
APPLICATIONS WITHDRAWN
0
$0
0
$0
2
$105,840
0
$0
0
$0
0
$0
FILES CLOSED FOR INCOMPLETENESS
0
$0
0
$0
4
$86,770
0
$0
0
$0
0
$0
Aggregated Statistics For Year 2003 (Based on 2 partial tracts)
A) FHA, FSA/RHS & VA Home Purchase Loans
B) Conventional Home Purchase Loans
C) Refinancings
D) Home Improvement Loans
F) Non-occupant Loans on < 5 Family Dwellings (A B C & D)
Number
Average Value
Number
Average Value
Number
Average Value
Number
Average Value
Number
Average Value
LOANS ORIGINATED
2
$68,295
8
$35,248
19
$62,832
6
$15,110
2
$63,105
APPLICATIONS APPROVED, NOT ACCEPTED
0
$0
2
$45,330
6
$65,502
0
$0
0
$0
APPLICATIONS DENIED
1
$74,690
5
$45,772
7
$56,771
3
$16,377
0
$0
APPLICATIONS WITHDRAWN
0
$0
1
$47,130
8
$87,319
0
$0
0
$0
FILES CLOSED FOR INCOMPLETENESS
0
$0
0
$0
2
$85,270
0
$0
0
$0
Aggregated Statistics For Year 2002 (Based on 2 partial tracts)
A) FHA, FSA/RHS & VA Home Purchase Loans
B) Conventional Home Purchase Loans
C) Refinancings
D) Home Improvement Loans
F) Non-occupant Loans on < 5 Family Dwellings (A B C & D)
Number
Average Value
Number
Average Value
Number
Average Value
Number
Average Value
Number
Average Value
LOANS ORIGINATED
1
$70,290
10
$40,819
14
$58,940
6
$19,437
1
$19,570
APPLICATIONS APPROVED, NOT ACCEPTED
0
$0
2
$33,150
3
$58,313
0
$0
0
$0
APPLICATIONS DENIED
0
$0
5
$59,590
8
$48,628
6
$13,247
0
$0
APPLICATIONS WITHDRAWN
0
$0
0
$0
2
$73,290
0
$0
0
$0
FILES CLOSED FOR INCOMPLETENESS
0
$0
0
$0
0
$0
0
$0
0
$0
Aggregated Statistics For Year 2001 (Based on 2 partial tracts)
A) FHA, FSA/RHS & VA Home Purchase Loans
B) Conventional Home Purchase Loans
C) Refinancings
D) Home Improvement Loans
F) Non-occupant Loans on < 5 Family Dwellings (A B C & D)
Number
Average Value
Number
Average Value
Number
Average Value
Number
Average Value
Number
Average Value
LOANS ORIGINATED
1
$35,550
14
$38,884
18
$66,611
5
$9,426
1
$18,370
APPLICATIONS APPROVED, NOT ACCEPTED
0
$0
6
$44,333
3
$60,443
1
$2,800
0
$0
APPLICATIONS DENIED
0
$0
8
$45,481
12
$56,848
4
$5,092
1
$81,480
APPLICATIONS WITHDRAWN
0
$0
2
$36,545
5
$67,020
0
$0
0
$0
FILES CLOSED FOR INCOMPLETENESS
1
$47,130
0
$0
1
$73,490
0
$0
0
$0
Aggregated Statistics For Year 2000 (Based on 2 partial tracts)
A) FHA, FSA/RHS & VA Home Purchase Loans
B) Conventional Home Purchase Loans
C) Refinancings
D) Home Improvement Loans
F) Non-occupant Loans on < 5 Family Dwellings (A B C & D)
Number
Average Value
Number
Average Value
Number
Average Value
Number
Average Value
Number
Average Value
LOANS ORIGINATED
0
$0
10
$36,505
9
$46,241
8
$7,938
1
$27,960
APPLICATIONS APPROVED, NOT ACCEPTED
2
$27,960
6
$37,943
1
$75,490
0
$0
0
$0
APPLICATIONS DENIED
1
$44,730
14
$43,649
12
$43,867
4
$8,288
2
$20,770
APPLICATIONS WITHDRAWN
1
$37,940
0
$0
5
$31,154
0
$0
0
$0
FILES CLOSED FOR INCOMPLETENESS
0
$0
0
$0
2
$42,535
0
$0
0
$0
Aggregated Statistics For Year 1999 (Based on 1 partial tract)
A) FHA, FSA/RHS & VA Home Purchase Loans
B) Conventional Home Purchase Loans
C) Refinancings
D) Home Improvement Loans
F) Non-occupant Loans on < 5 Family Dwellings (A B C & D)
Detailed PMIC statistics for the following Tracts:0136.00
2002 - 2017 National Fire Incident Reporting System (NFIRS) incidents
Based on the data from the years 2002 - 2017 the average number of fire incidents per year is 16. The highest number of reported fires - 32 took place in 2011, and the least - 5 in 2007. The data has a decreasing trend.
When looking into fire subcategories, the most reports belonged to: Outside Fires (73.9%), and Structure Fires (17.0%).
Fire incident types reported to NFIRS in Zip Code 71438


 Nearest zip codes: 71472, 71466, 71424, 70656, 71433, 71409.


 Based on the data from the years 2002 - 2017 the average number of fire incidents per year is 16. The highest number of reported fires - 32 took place in 2011, and the least - 5 in 2007. The data has a decreasing trend.
 When looking into fire subcategories, the most reports belonged to: Outside Fires (73.9%), and Structure Fires (17.0%).