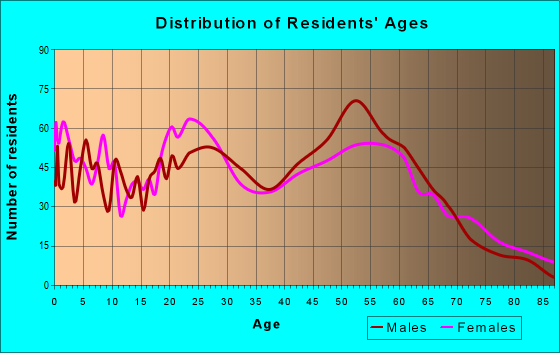
Estimated zip code population in 2022: 9,508 Zip code population in 2010: 7,025 Zip code population in 2000: 10,291
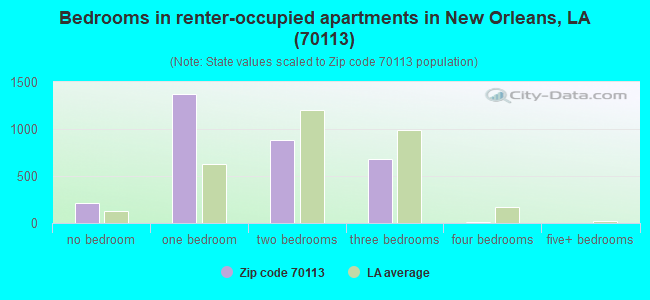
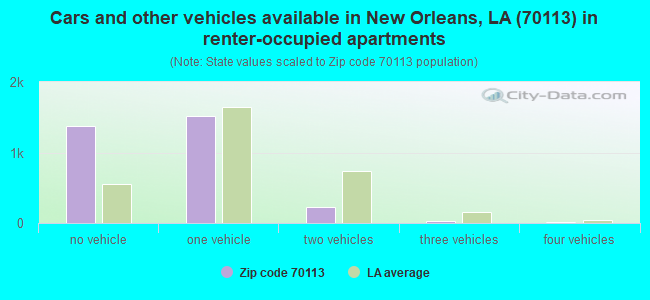
Houses and condos: 5,542 Renter-occupied apartments: 3,152
% of renters here:
77%
State:
32%
March 2022 cost of living index in zip code 70113: 99.1 (near average, U.S. average is 100)
Land area: 1.0 sq. mi. Water area: 0.0 sq. mi.
Population density: 9,347 people per square mile
(high).
OSM Map
General Map
Google Map
MSN Map
OSM Map
General Map
Google Map
MSN Map
OSM Map
General Map
Google Map
MSN Map
OSM Map
General Map
Google Map
MSN Map
Please wait while loading the map...
Real estate property taxes paid for housing units in 2022:
This zip code:
0.7% ($1,958)
Louisiana:
0.5% ($1,127)
Median real estate property taxes paid for housing units with mortgages in 2022: $1,844 (0.6%) Median real estate property taxes paid for housing units with no mortgage in 2022: $2,242 (1.0%)
Averages for the 2020 tax year for zip code 70113, filed in 2021:
Average Adjusted Gross Income (AGI) in 2020: $56,513 (Individual Income Tax Returns)
Here:
$56,513
State:
$60,757
Salary/wage: $45,359 (reported on 86.5% of returns)
Here:
$45,359
State:
$50,882
(% of AGI for various income ranges: 1122.5% for AGIs below $25k, 3534.8% for AGIs $25k-50k, 7837.6% for AGIs $50k-75k, 12307.5% for AGIs $75k-100k, 20538.3% for AGIs $100k-200k, 121240.0% for AGIs over 200k)
Taxable interest for individuals: $1,067 (reported on 13.8% of returns)
This zip code:
$1,067
Louisiana:
$1,576
(% of AGI for various income ranges: 0.7% for AGIs below $25k, 1.4% for AGIs $25k-50k, 13.3% for AGIs $50k-75k, 6.2% for AGIs $75k-100k, 82.5% for AGIs $100k-200k, 1096.7% for AGIs over 200k)
Ordinary dividends: $6,260 (reported on 9.2% of returns)
Here:
$6,260
State:
$7,743
(% of AGI for various income ranges: 3.2% for AGIs below $25k, 8.5% for AGIs $25k-50k, 35.2% for AGIs $50k-75k, 121.2% for AGIs $75k-100k, 284.2% for AGIs $100k-200k, 4206.7% for AGIs over 200k)
Net capital gain/loss in AGI: +$14,206 (reported on 9.5% of returns)
Here:
+$14,206
State:
+$16,917
(% of AGI for various income ranges: 8.0% for AGIs $25k-50k, 125.7% for AGIs $50k-75k, 126.2% for AGIs $75k-100k, 440.8% for AGIs $100k-200k, 11556.7% for AGIs over 200k)
Profit/loss from business: +$7,012 (reported on 22.7% of returns)
Here:
+$7,012
State:
+$7,679
(% of AGI for various income ranges: 8.8% for AGIs below $25k, 119.0% for AGIs $50k-75k, 325.0% for AGIs $75k-100k, 695.0% for AGIs $100k-200k, 12860.0% for AGIs over 200k)
Taxable individual retirement arrangement distribution: $12,225 (reported on 1.2% of returns)
70113:
$12,225
Louisiana:
$20,716
(% of AGI for various income ranges: 11.3% for AGIs below $25k, 416.2% for AGIs $75k-100k)
Total itemized deductions: $34,294 (reported on 5.5% of returns)
Here:
$34,294
State:
$36,265
(% of AGI for various income ranges: 114.6% for AGIs $25k-50k, 210.5% for AGIs $50k-75k, 542.5% for AGIs $75k-100k, 940.8% for AGIs $100k-200k, 11180.0% for AGIs over 200k)
Charity contributions: $7,357 (reported on 4.3% of returns)
Here:
$7,357
State:
$13,106
(% of AGI for various income ranges: 16.9% for AGIs $25k-50k, 119.0% for AGIs $50k-75k, 174.2% for AGIs $100k-200k, 1503.3% for AGIs over 200k)
Taxes paid: $6,583 (reported on 5.5% of returns)
70113:
$6,583
State:
$6,643
(% of AGI for various income ranges: 15.1% for AGIs $25k-50k, 42.4% for AGIs $50k-75k, 133.8% for AGIs $75k-100k, 321.7% for AGIs $100k-200k, 1653.3% for AGIs over 200k)
Earned income credit: $2,701 (reported on 35.3% of returns)
Here:
$2,701
State:
$2,671
(% of AGI for various income ranges: 170.8% for AGIs below $25k, 105.5% for AGIs $25k-50k)
Percentage of individuals using paid preparers for their 2020 taxes: 92.9%
Here:
93%
State:
92%
(% for various income ranges: 92.2% for AGIs below $25k, 94.2% for AGIs $25k-50k, 93.3% for AGIs $50k-75k, 92.3% for AGIs $75k-100k, 90.5% for AGIs $100k-200k, 100.0% for AGIs over 200k)
Averages for the 2012 tax year for zip code 70113, filed in 2013:
Average Adjusted Gross Income (AGI) in 2012: $38,320 (Individual Income Tax Returns)
Here:
$38,320
State:
$56,730
Salary/wage: $34,622 (reported on 87.0% of returns)
Here:
$34,622
State:
$45,545
(% of AGI for various income ranges: 84.1% for AGIs below $25k, 91.3% for AGIs $25k-50k, 89.0% for AGIs $50k-75k, 88.3% for AGIs $75k-100k, 76.0% for AGIs $100k-200k, 65.8% for AGIs over 200k)
Taxable interest for individuals: $1,100 (reported on 8.2% of returns)
This zip code:
$1,100
Louisiana:
$1,804
(% of AGI for various income ranges: 0.2% for AGIs below $25k, 0.1% for AGIs $25k-50k, 0.1% for AGIs $50k-75k, 0.3% for AGIs $100k-200k, 0.4% for AGIs over 200k)
Ordinary dividends: $6,482 (reported on 5.8% of returns)
Here:
$6,482
State:
$7,610
(% of AGI for various income ranges: 1.0% for AGIs below $25k, 1.2% for AGIs $25k-50k, 0.4% for AGIs $50k-75k, 2.0% for AGIs $100k-200k, 0.9% for AGIs over 200k)
Net capital gain/loss in AGI: +$9,164 (reported on 3.8% of returns)
Here:
+$9,164
State:
+$17,096
(% of AGI for various income ranges: 0.2% for AGIs $75k-100k, 2.5% for AGIs over 200k)
Profit/loss from business: +$7,336 (reported on 18.8% of returns)
Here:
+$7,336
State:
+$12,088
(% of AGI for various income ranges: 9.5% for AGIs below $25k, 1.1% for AGIs $25k-50k, 5.0% for AGIs $50k-75k, 9.2% for AGIs $100k-200k)
Taxable individual retirement arrangement distribution: $9,125 (reported on 1.4% of returns)
70113:
$9,125
Louisiana:
$16,085
Total itemized deductions: $24,944 (15% of AGI, reported on 11.6% of returns)
Here:
$24,944
State:
$23,585
Here:
14.6% of AGI
State:
18.1% of AGI
(% of AGI for various income ranges: 2.5% for AGIs below $25k, 7.5% for AGIs $25k-50k, 11.3% for AGIs $50k-75k, 14.0% for AGIs $75k-100k, 11.5% for AGIs $100k-200k, 8.1% for AGIs over 200k)
Charity contributions: $5,604 (reported on 8.9% of returns)
Here:
$5,604
State:
$5,533
(% of AGI for various income ranges: 0.3% for AGIs below $25k, 1.1% for AGIs $25k-50k, 2.2% for AGIs $50k-75k, 2.3% for AGIs $75k-100k, 2.2% for AGIs $100k-200k, 1.5% for AGIs over 200k)
Taxes paid: $8,997 (reported on 11.6% of returns)
70113:
$8,997
State:
$6,282
(% of AGI for various income ranges: 0.3% for AGIs below $25k, 0.9% for AGIs $25k-50k, 2.3% for AGIs $50k-75k, 2.5% for AGIs $75k-100k, 3.9% for AGIs $100k-200k, 5.0% for AGIs over 200k)
Earned income credit: $2,654 (reported on 49.1% of returns)
Here:
$2,654
State:
$2,633
(% of AGI for various income ranges: 13.8% for AGIs below $25k, 1.6% for AGIs $25k-50k)
Percentage of individuals using paid preparers for their 2012 taxes: 52.6%
Here:
53%
State:
57%
(% for various income ranges: 52.8% for AGIs below $25k, 48.4% for AGIs $25k-50k, 47.1% for AGIs $50k-75k, 60.0% for AGIs $75k-100k, 71.4% for AGIs $100k-200k, 80.0% for AGIs over 200k)
Averages for the 2004 tax year for zip code 70113, filed in 2005:
Average Adjusted Gross Income (AGI) in 2004: $22,564 (Individual Income Tax Returns)
Here:
$22,564
State:
$39,411
Salary/wage: $19,496 (reported on 92.7% of returns)
Here:
$19,496
State:
$34,434
(% of AGI for various income ranges: 91.3% for AGIs below $10k, 93.0% for AGIs $10k-25k, 94.0% for AGIs $25k-50k, 88.8% for AGIs $50k-75k, 83.2% for AGIs $75k-100k, 47.9% for AGIs over 100k)
Taxable interest for individuals: $936 (reported on 8.2% of returns)
This zip code:
$936
Louisiana:
$1,606
(% of AGI for various income ranges: 0.4% for AGIs below $10k, 0.0% for AGIs $10k-25k, 0.1% for AGIs $25k-50k, 0.1% for AGIs $50k-75k, 0.1% for AGIs $75k-100k, 1.0% for AGIs over 100k)
Taxable dividends: $5,115 (reported on 3.2% of returns)
Here:
$5,115
State:
$3,235
(% of AGI for various income ranges: 0.3% for AGIs below $10k, 0.0% for AGIs $10k-25k, 0.1% for AGIs $25k-50k, 0.1% for AGIs $50k-75k, 2.4% for AGIs over 100k)
Net capital gain/loss: +$12,941 (reported on 2.8% of returns)
Here:
+$12,941
State:
+$8,531
Profit/loss from business: +$10,424 (reported on 9.7% of returns)
Here:
+$10,424
State:
+$9,128
(% of AGI for various income ranges: 8.5% for AGIs below $10k, 2.7% for AGIs $10k-25k, 0.3% for AGIs $25k-50k, 1.8% for AGIs $50k-75k, 9.8% for AGIs over 100k)
Total itemized deductions: $18,119 (18% of AGI, reported on 7.9% of returns)
Here:
$18,119
State:
$18,222
Here:
18.3% of AGI
State:
20.3% of AGI
(% of AGI for various income ranges: 2.6% for AGIs $10k-25k, 7.0% for AGIs $25k-50k, 12.8% for AGIs $50k-75k, 18.8% for AGIs $75k-100k, 9.3% for AGIs over 100k)
Charity contributions deductions: $4,031 (4% of AGI, reported on 6.5% of returns)
Here:
$4,031
State:
$4,190
Here:
3.7% of AGI
State:
4.4% of AGI
(% of AGI for various income ranges: 0.6% for AGIs $10k-25k, 1.7% for AGIs $25k-50k, 2.6% for AGIs $50k-75k, 3.0% for AGIs $75k-100k, 1.3% for AGIs over 100k)
Total tax: $5,644 (reported on 40.6% of returns)
70113:
$5,644
State:
$6,529
(% of AGI for various income ranges: 1.9% for AGIs below $10k, 2.1% for AGIs $10k-25k, 5.2% for AGIs $25k-50k, 10.5% for AGIs $50k-75k, 13.6% for AGIs $75k-100k, 25.9% for AGIs over 100k)
Earned income credit: $2,276 (reported on 64.8% of returns)
Here:
$2,276
State:
$2,103
Percentage of individuals using paid preparers for their 2004 taxes: 74.5%
Here:
75%
State:
61%
(% for various income ranges: 75.9% for AGIs below $10k, 77.3% for AGIs $10k-25k, 62.4% for AGIs $25k-50k, 63.0% for AGIs $50k-75k, 91.3% for AGIs $75k-100k, 85.0% for AGIs over 100k)
Household received Food Stamps/SNAP in the past 12 months: 1,254 Household did not receive Food Stamps/SNAP in the past 12 months: 2,952
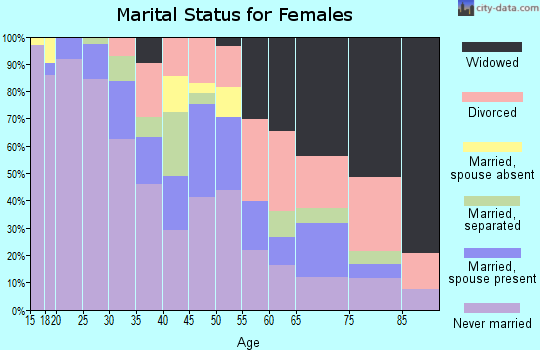
Women who had a birth in the past 12 months: 105 (48 now married, 57 unmarried) Women who did not have a birth in the past 12 months: 2,143 (487 now married, 1,666 unmarried)
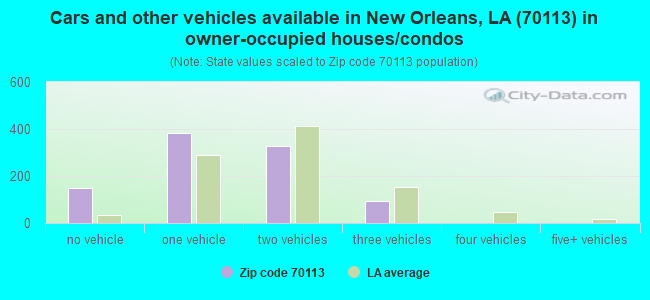
Housing units in zip code 70113 with a mortgage: 473 (37 second mortgage, 20 both second mortgage and home equity loan) Median monthly owner costs for units with a mortgage: $1,451 Median monthly owner costs for units without a mortgage: $520
Residents with income below the poverty level in 2022:
This zip code:
32.2%
Whole state:
18.6%
Residents with income below 50% of the poverty level in 2022:
This zip code:
17.2%
Whole state:
10.1%
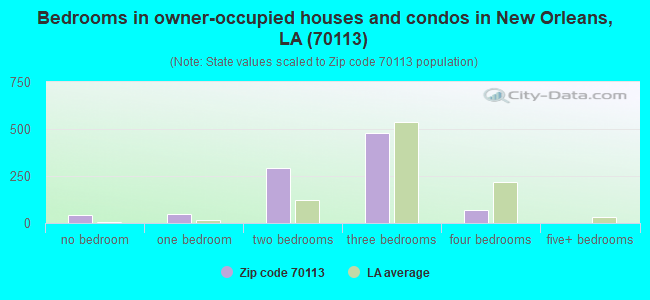
Median number of rooms in houses and condos:
Here:
5.2
State:
6.2
Median number of rooms in apartments:
Here:
3.6
State:
4.4
Notable locations in this zip code not listed on our city pages
Notable locations in zip code 70113: Keller Market (A), Union Station (B), Allie Mae Williams Multi - Service Center Complex (C), New Orleans Police Department Sixth District (D), Keller Golden Age Community Center (E), New Orleans Police Department (F), New Orleans Fire Department Squirt 16 and Ladder 8 (G), Central City Branch New Orleans City Library (H), City Wide Daycare Center (I), Crescent House (J), Dryades YMCA (K), Dryades YMCA Child Care Center (L), E B Bromon Liberty House Child Day Care Center (M), Peoples Community Child Care Center (N), Peoples United Methodist Community Center (O), Safe and Smart Afterschool and Summer Camp (P), Saint John The Baptist Community Center (Q), UNIKIDS Academy (R), Greater Saint Stephen Baptist Church Learning Center (S), Naval Support Activity Child Development Center (T). Display/hide their locations on the map
Churches in zip code 70113 include: Little Zion Baptist Church (A), Greater Mount Rose Baptist Church (B), Castle Rock Community Church (C), United House of Prayer (D), The Way Jesus Christ Christian Church (E), Second Macedonia Baptist Church (F), Second Bright Morning Star Baptist Church (G), Saint Philip Baptist Church (H), Saint Paul Community Baptist Church (I). Display/hide their locations on the map
Parks in zip code 70113 include: Shakespeare Park (1), Morris Park (2), Keller Square (3), Central City Historic District (4). Display/hide their locations on the map
523 married couples with children.
755 single-parent households (46 men, 709 women).
89.2% of residents of 70113 zip code speak English at home.
8.4% of residents speak Spanish at home (20% very well, 47% well, 23% not well, 9% not at all).
1.2% of residents speak other Indo-European language at home (76% very well, 24% well).
0.4% of residents speak Asian or Pacific Island language at home (100% very well).
0.1% of residents speak other language at home (100% very well).
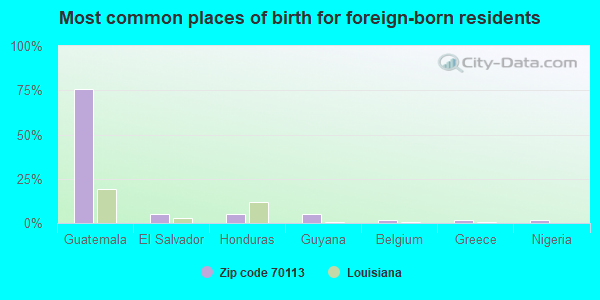
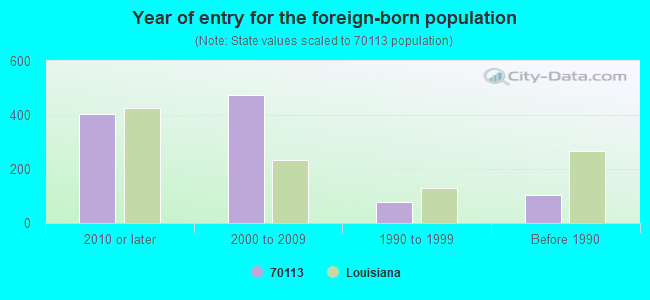
Foreign born population: 868 (9.1%) (11.8% of them are naturalized citizens)
Major facilities with environmental interests located in this zip code:
MOBIL OIL E & P SE INC (1250 POYDRAS ST in NEW ORLEANS, LA)
(Integrated Compliance Information System) - ICIS-06-1995-0436, FORMAL ENFORCEMENT ACTION, ICIS-06-1998-0418, ICIS-06-1998-0785, ICIS-06-1989-0133, Conditionally Exempt Small Quantity Generators, less than 100 kg/month of hazardous waste (Resource Conservation and Recovery Act (tracking hazardous waste)) - notification Business SIC classification: DRILLING OIL AND GAS WELLS; OIL AND GAS FIELD EXPLORATION SERVICES Organizations: MOBIL OIL CORP (CONTACT/OWNER)
MYRTLE ROSEBELLA BANKS SCHOOL (1307 ORETHA CASTLE HALEY BLVD. in NEW ORLEANS, LA)
(National Center for Education Statistics) - STATE ID-036090 Organizations: ORLEANS PARISH SCHOOL BOARD (SCHOOL DISTRICT)
AUTO DISMANTLERS, INC. (2815 N VILLERE in NEW ORLEANS, LA)
(Integrated Compliance Information System) - ICIS-06-1997-0032, FORMAL ENFORCEMENT ACTION Business SIC classification: MOTOR VEHICLE PARTS, USED; SCRAP AND WASTE MATERIALS
MOTIVA ENTERPRISESLLC, ORLEANS PARISH (ORLEANS PARISH in NEW ORLEANS, LA)
Large Quantity Generators, more that 1000 kg of hazardous waste/month (Resource Conservation and Recovery Act (tracking hazardous waste))
ORLEANS TRANSPORTATION SVC (1793 JULIA ST in NEW ORLEANS, LA)
(Resource Conservation and Recovery Act (tracking hazardous waste)) Organizations: ORLEANS TRANSPORTATION SERVICE (CONTACT/OWNER)
CIRCLE AUTO ELECTRIC (1124 BARONNE ST in NEW ORLEANS, LA)
(Resource Conservation and Recovery Act (tracking hazardous waste))
BELLSOUTH J2301 (840 POYDRAS ST in NEW ORLEANS, LA)
Conditionally Exempt Small Quantity Generators, less than 100 kg/month of hazardous waste (Resource Conservation and Recovery Act (tracking hazardous waste)) - notification Organizations: BELL SOUTH (CONTACT/OPERATOR)
BROWNS DAIRY (1300 BARONNE ST in NEW ORLEANS, LA)
Conditionally Exempt Small Quantity Generators, less than 100 kg/month of hazardous waste (Resource Conservation and Recovery Act (tracking hazardous waste)) - notification TRI REPORTER (Tracking of toxic chemicals releasing facilities) Business SIC and NAICS classification: FLUID MILK Organizations: BROWNS VELVET DAIRY (CONTACT/OWNER)
Alternative names: BROWNS DAIRY PRODUCTS, BROWN'S VELVET DAIRY, BROWNS VELVET DAIRY PRODUCTS
HEALTH-TEX INC (2515 CANAL SUITE 300 in NEW ORLEANS, LA)
(Resource Conservation and Recovery Act (tracking hazardous waste))
DURR HEAVY CONSTRUCTION (1301 SIMON BOLIVAR BLVD in NEW ORLEANS, LA)
National Pollutant Discharge Elimination System NON-MAJOR (Tracking pollutant discharge elimination systems) - permit Alternative names: DURR HEAVY COSNTRUCTION
EBONY DELUX CLEANERS (2039 WASHINGTON AVENUE in NEW ORLEANS, LA)
AIR MINOR (AIRS/AFS) Business SIC classification: DRYCLEANING PLANTS, EXCEPT RUG CLEANING
ENTERGY NEW ORLEANS (639 LOYOLA AVE. in NEW ORLEANS, LA)
National Pollutant Discharge Elimination System NON-MAJOR (Tracking pollutant discharge elimination systems) - permit Business SIC classification: OIL AND GAS FIELD SERVICES
ENTERGY THERMA/NORMC (GRAVIER NE/S CLAIBOR in NEW ORLEANS, LA)
AIR MINOR (AIRS/AFS) Business SIC classification: WATER SUPPLY
Housing units lacking complete plumbing facilities: 9.1% Housing units lacking complete kitchen facilities: 11.2%
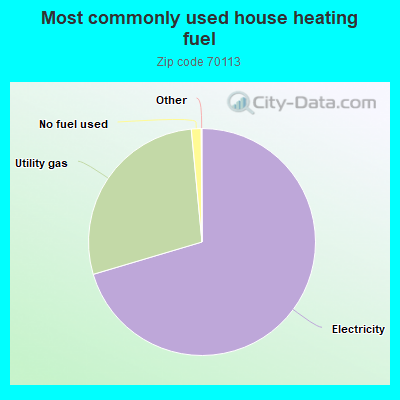
70.4%Electricity
28.1%Utility gas
1.4%No fuel used
Population in 1990: 12,177.
Place of birth for U.S.-born residents:
This state: 6,430
Northeast: 396
Midwest: 420
South: 973
West: 242
64% of the 70113 zip code residents lived in the same house 5 years ago. Out of people who lived in different houses, 88% lived in this county. Out of people who lived in different counties, 50% lived in Louisiana.
83% of the 70113 zip code residents lived in the same house 1 year ago. Out of people who lived in different houses, 45% moved from this county. Out of people who lived in different houses, 29% moved from different county within same state. Out of people who lived in different houses, 22% moved from different state. Out of people who lived in different houses, 2% moved from abroad.
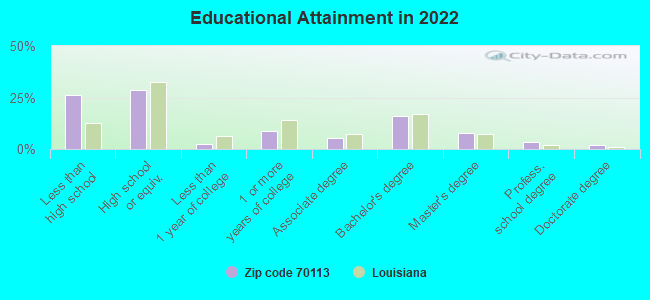
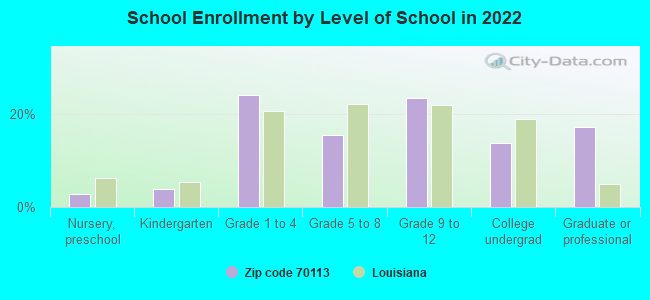
Private vs. public school enrollment:
Students in private schools in grades 1 to 8 (elementary and middle school): 58
Here:
6.6%
Louisiana:
19.6%
Students in private schools in grades 9 to 12 (high school): 130
Here:
24.6%
Louisiana:
18.3%
Students in private undergraduate colleges: 80
Here:
26.3%
Louisiana:
17.4%
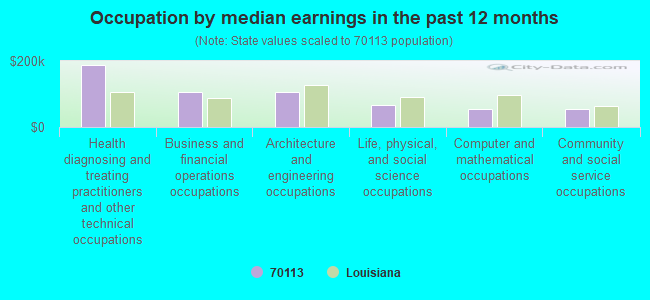
Occupation by median earnings in the past 12 months ($)
187,625Health diagnosing and treating practitioners and other technical occupations
105,618Business and financial operations occupations
105,453Architecture and engineering occupations
67,214Life, physical, and social science occupations
55,831Computer and mathematical occupations
54,464Community and social service occupations
Companies with federal contracts located in this zip code (NEW ORLEANS, LA):
Contracts for Electric Services by Army Signed by year:2000: $0; 2001: $0; 2002: $0; 2003: $0; 2004: $0; 2005: $9,554,196; 2006: $0.
Biggest contracts:
$1,437,155 with Army for Electric Services. Signed on 2005-09-30. Completion date: 2005-08-31.
$1,407,708, same as above.Signed on 2005-08-23. Completion date: 2005-07-31.
$1,140,907, same as above.Signed on 2005-01-28. Completion date: 2004-09-30.
$973,766, same as above.Signed on 2005-01-28. Completion date: 2004-10-31.
SOUTHERN FOODS GROUP, LP II (1300 BARONNE ST) : $983,763 in 32 contractsfrom 1999 to 2006
Contracts for Food Items For Resale, Condiments and Related Products, Beverages, Nonalcoholic by Defense Commissary Agency, Department of Defense, Army Signed by year:2000: $196,159; 2001: $1,230; 2002: $9,624; 2003: $12,151; 2004: $135,427; 2005: $228,704; 2006: $71,773.
Biggest contracts:
$132,539 with Defense Commissary Agency for Food Items For Resale. Signed on 2005-04-01. Completion date: 2005-08-31.
$132,100, same as above.Signed on 2004-10-01. Completion date: 2005-02-28.
$80,966 with Department of Defense for Food Items For Resale. Signed on 2000-06-30. Completion date: 2000-06-30.
$71,773 with Defense Commissary Agency for Food Items For Resale. Signed on 2006-01-01. Completion date: 2006-03-31.
IRVINGTON J EPPLING & ASSOCIA (938 LAFAYETTE ST STE 324; small business) : $87,350 in 9 contractsfrom 2000 to 2002
Contracts for Real Property Appraisals Services (SIC 6531) by U.S. Army Corps of Engineers - civil program financing only Signed by year:2000: $210,390; 2001: $0; 2002: -$123,040; 2003: $0; 2004: $0; 2005: $0; 2006: $0.
Biggest contracts:
$122,500 with U.S. Army Corps of Engineers - civil program financing only for Real Property Appraisals Services (SIC 6531). Signed on 2000-04-11. Completion date: 2003-09-30.
$87,890, same as above.Signed on 2000-10-12. Completion date: 2001-03-30.
$0, same as above.Signed on 2002-09-11. Completion date: 2001-05-11.
$0, same as above.Signed on 2002-09-11. Completion date: 2003-09-30.
CURE, KNAAK & DONNELLY, INC (615 BARONNE ST STE 205; small business)
$3,330 with Army for Transcription Services. Signed on 2002-04-08. Completion date: 2002-04-11.
Top industries in this zip code by the number of employees in 2005:
Utilities: Electric Power Distribution (500-999 employees: 1 establishment, 250-499 employees: 1 establishment, 1-4 employees: 4 establishments)
Real Estate and Rental and Leasing: Residential Property Managers (100-249: 2, 50-99: 1)
Professional, Scientific, and Technical Services: Offices of Lawyers (20-49: 1, 10-19: 4, 5-9: 11, 1-4: 41)
Administrative and Support and Waste Management and Remediation Services: Security Guards and Patrol Services (100-249: 1, 50-99: 1)
Arts, Entertainment, and Recreation: Sports Teams and Clubs (100-249: 1)
Information: Television Broadcasting (100-249: 1)
People in group quarters in 2010:
280 people in other noninstitutional facilities
211 people in emergency and transitional shelters (with sleeping facilities) for people experiencing homelessness
20 people in group homes intended for adults
People in group quarters in 2000:
182 people in other noninstitutional group quarters
77 people in other group homes
36 people in homes or halfway houses for drug/alcohol abuse
Fatal accident statistics in 2013:
Fatal accident count: 1
Vehicles involved in fatal accidents: 1
Fatal accidents caused by drunken drivers: 0
Fatalities: 1
Persons involved in fatal accidents: 1
Pedestrians involved in fatal accidents: 1
Fatal accident statistics in 2011:
Fatal accident count: 1
Vehicles involved in fatal accidents: 1
Fatal accidents caused by drunken drivers: 1
Fatalities: 1
Persons involved in fatal accidents: 1
Pedestrians involved in fatal accidents: 0
Home Mortgage Disclosure Act Aggregated Statistics For Year 2009 (Based on 5 full and 16 partial tracts)
A) FHA, FSA/RHS & VA Home Purchase Loans
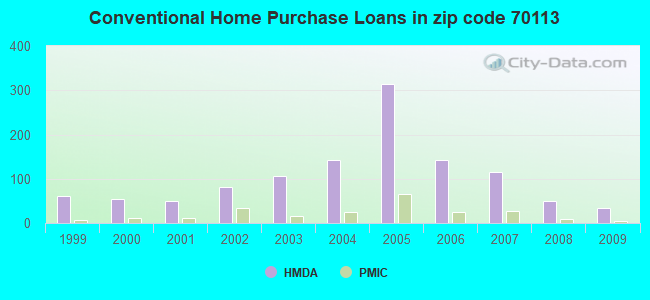
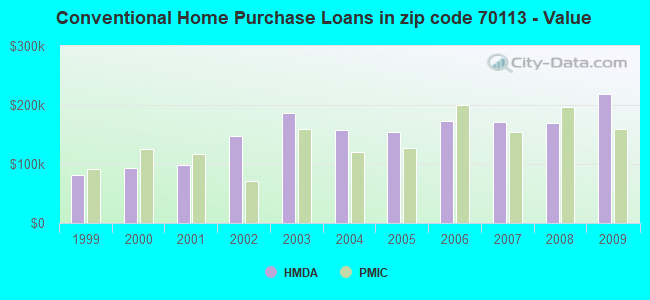
B) Conventional Home Purchase Loans
C) Refinancings
D) Home Improvement Loans
E) Loans on Dwellings For 5+ Families
F) Non-occupant Loans on < 5 Family Dwellings (A B C & D)
G) Loans On Manufactured Home Dwelling (A B C & D)
Number
Average Value
Number
Average Value
Number
Average Value
Number
Average Value
Number
Average Value
Number
Average Value
Number
Average Value
LOANS ORIGINATED
15
$119,476
33
$219,275
70
$207,607
7
$112,710
7
$453,741
39
$195,661
0
$0
APPLICATIONS APPROVED, NOT ACCEPTED
0
$0
3
$85,687
8
$208,190
2
$193,145
0
$0
3
$187,383
0
$0
APPLICATIONS DENIED
4
$122,798
11
$71,795
35
$189,495
11
$38,373
0
$0
18
$117,153
0
$0
APPLICATIONS WITHDRAWN
0
$0
12
$166,301
16
$244,551
2
$137,030
0
$0
7
$220,807
0
$0
FILES CLOSED FOR INCOMPLETENESS
0
$0
0
$0
8
$237,381
0
$0
0
$0
2
$261,700
1
$50,850
Aggregated Statistics For Year 2008 (Based on 5 full and 16 partial tracts)
A) FHA, FSA/RHS & VA Home Purchase Loans
B) Conventional Home Purchase Loans
C) Refinancings
D) Home Improvement Loans
E) Loans on Dwellings For 5+ Families
F) Non-occupant Loans on < 5 Family Dwellings (A B C & D)
G) Loans On Manufactured Home Dwelling (A B C & D)
Number
Average Value
Number
Average Value
Number
Average Value
Number
Average Value
Number
Average Value
Number
Average Value
Number
Average Value
LOANS ORIGINATED
6
$153,578
50
$170,338
64
$210,794
9
$84,222
12
$282,201
67
$199,968
1
$22,630
APPLICATIONS APPROVED, NOT ACCEPTED
0
$0
5
$108,896
10
$136,977
4
$46,900
0
$0
4
$208,328
1
$26,530
APPLICATIONS DENIED
3
$118,873
19
$189,837
44
$143,255
33
$70,097
1
$1,114,340
35
$109,141
0
$0
APPLICATIONS WITHDRAWN
3
$117,490
4
$436,732
16
$173,801
3
$87,987
0
$0
9
$208,759
0
$0
FILES CLOSED FOR INCOMPLETENESS
2
$183,820
0
$0
5
$179,818
1
$80,000
1
$1,000,760
0
$0
0
$0
Aggregated Statistics For Year 2007 (Based on 5 full and 16 partial tracts)
A) FHA, FSA/RHS & VA Home Purchase Loans
B) Conventional Home Purchase Loans
C) Refinancings
D) Home Improvement Loans
E) Loans on Dwellings For 5+ Families
F) Non-occupant Loans on < 5 Family Dwellings (A B C & D)
Number
Average Value
Number
Average Value
Number
Average Value
Number
Average Value
Number
Average Value
Number
Average Value
LOANS ORIGINATED
4
$88,482
116
$171,729
95
$194,529
22
$74,981
10
$562,961
107
$170,855
APPLICATIONS APPROVED, NOT ACCEPTED
0
$0
15
$171,261
36
$172,451
2
$18,100
0
$0
23
$150,262
APPLICATIONS DENIED
4
$120,908
56
$170,964
72
$163,681
27
$50,076
0
$0
47
$149,447
APPLICATIONS WITHDRAWN
1
$33,690
13
$153,438
27
$144,650
2
$149,375
0
$0
12
$132,846
FILES CLOSED FOR INCOMPLETENESS
0
$0
12
$152,822
20
$130,184
2
$137,225
0
$0
15
$114,980
Aggregated Statistics For Year 2006 (Based on 5 full and 16 partial tracts)
A) FHA, FSA/RHS & VA Home Purchase Loans
B) Conventional Home Purchase Loans
C) Refinancings
D) Home Improvement Loans
E) Loans on Dwellings For 5+ Families
F) Non-occupant Loans on < 5 Family Dwellings (A B C & D)
G) Loans On Manufactured Home Dwelling (A B C & D)
Number
Average Value
Number
Average Value
Number
Average Value
Number
Average Value
Number
Average Value
Number
Average Value
Number
Average Value
LOANS ORIGINATED
4
$137,492
142
$173,271
86
$183,402
17
$138,885
9
$243,879
114
$154,501
1
$135,780
APPLICATIONS APPROVED, NOT ACCEPTED
0
$0
29
$177,500
18
$169,532
2
$92,000
0
$0
18
$172,367
0
$0
APPLICATIONS DENIED
2
$104,190
49
$154,653
41
$161,035
14
$48,181
2
$333,535
36
$136,137
0
$0
APPLICATIONS WITHDRAWN
0
$0
30
$132,755
25
$138,200
3
$77,910
0
$0
19
$106,975
0
$0
FILES CLOSED FOR INCOMPLETENESS
0
$0
12
$146,898
7
$117,219
1
$153,180
0
$0
12
$120,047
0
$0
Aggregated Statistics For Year 2005 (Based on 5 full and 16 partial tracts)
A) FHA, FSA/RHS & VA Home Purchase Loans
B) Conventional Home Purchase Loans
C) Refinancings
D) Home Improvement Loans
E) Loans on Dwellings For 5+ Families
F) Non-occupant Loans on < 5 Family Dwellings (A B C & D)
G) Loans On Manufactured Home Dwelling (A B C & D)
Number
Average Value
Number
Average Value
Number
Average Value
Number
Average Value
Number
Average Value
Number
Average Value
Number
Average Value
LOANS ORIGINATED
6
$103,880
315
$153,447
120
$132,347
16
$52,168
18
$654,068
214
$131,621
0
$0
APPLICATIONS APPROVED, NOT ACCEPTED
3
$80,333
57
$109,823
35
$102,140
19
$34,149
0
$0
33
$83,605
1
$25,420
APPLICATIONS DENIED
0
$0
88
$116,934
113
$108,231
37
$33,542
1
$50,000
51
$113,664
4
$71,720
APPLICATIONS WITHDRAWN
1
$91,440
58
$109,206
43
$110,543
11
$85,304
1
$296,170
25
$121,078
1
$79,260
FILES CLOSED FOR INCOMPLETENESS
0
$0
19
$216,402
50
$103,861
0
$0
0
$0
17
$163,386
0
$0
Aggregated Statistics For Year 2004 (Based on 5 full and 16 partial tracts)
A) FHA, FSA/RHS & VA Home Purchase Loans
B) Conventional Home Purchase Loans
C) Refinancings
D) Home Improvement Loans
E) Loans on Dwellings For 5+ Families
F) Non-occupant Loans on < 5 Family Dwellings (A B C & D)
G) Loans On Manufactured Home Dwelling (A B C & D)
Number
Average Value
Number
Average Value
Number
Average Value
Number
Average Value
Number
Average Value
Number
Average Value
Number
Average Value
LOANS ORIGINATED
9
$95,244
142
$157,710
172
$125,273
24
$53,099
22
$374,082
148
$119,801
0
$0
APPLICATIONS APPROVED, NOT ACCEPTED
1
$189,590
27
$132,035
41
$119,488
7
$29,257
0
$0
31
$100,264
0
$0
APPLICATIONS DENIED
6
$123,278
39
$86,507
170
$98,585
48
$36,170
0
$0
54
$76,784
0
$0
APPLICATIONS WITHDRAWN
2
$76,865
27
$94,000
64
$124,648
1
$20,320
0
$0
19
$128,131
1
$82,630
FILES CLOSED FOR INCOMPLETENESS
0
$0
6
$93,825
38
$113,918
4
$51,918
1
$800,860
2
$71,665
0
$0
Aggregated Statistics For Year 2003 (Based on 5 full and 16 partial tracts)
A) FHA, FSA/RHS & VA Home Purchase Loans
B) Conventional Home Purchase Loans
C) Refinancings
D) Home Improvement Loans
E) Loans on Dwellings For 5+ Families
F) Non-occupant Loans on < 5 Family Dwellings (A B C & D)
Number
Average Value
Number
Average Value
Number
Average Value
Number
Average Value
Number
Average Value
Number
Average Value
LOANS ORIGINATED
9
$88,754
107
$187,035
157
$124,930
18
$34,472
15
$288,397
105
$106,381
APPLICATIONS APPROVED, NOT ACCEPTED
1
$97,480
20
$88,102
37
$84,264
6
$39,848
1
$203,390
21
$89,994
APPLICATIONS DENIED
2
$100,650
31
$116,458
141
$96,168
24
$46,472
0
$0
38
$99,585
APPLICATIONS WITHDRAWN
3
$70,427
7
$130,874
46
$85,292
2
$52,035
0
$0
5
$103,206
FILES CLOSED FOR INCOMPLETENESS
2
$174,040
3
$77,227
6
$90,477
1
$19,000
0
$0
3
$117,443
Aggregated Statistics For Year 2002 (Based on 5 full and 16 partial tracts)
A) FHA, FSA/RHS & VA Home Purchase Loans
B) Conventional Home Purchase Loans
C) Refinancings
D) Home Improvement Loans
E) Loans on Dwellings For 5+ Families
F) Non-occupant Loans on < 5 Family Dwellings (A B C & D)
Number
Average Value
Number
Average Value
Number
Average Value
Number
Average Value
Number
Average Value
Number
Average Value
LOANS ORIGINATED
4
$97,908
82
$148,053
107
$119,336
27
$19,634
7
$412,413
85
$105,711
APPLICATIONS APPROVED, NOT ACCEPTED
1
$76,240
19
$125,543
32
$75,425
7
$89,146
0
$0
11
$130,381
APPLICATIONS DENIED
1
$69,000
30
$82,378
86
$72,275
29
$32,984
0
$0
25
$88,478
APPLICATIONS WITHDRAWN
1
$64,010
11
$105,659
29
$95,259
6
$12,952
0
$0
6
$133,155
FILES CLOSED FOR INCOMPLETENESS
0
$0
3
$69,897
14
$72,796
0
$0
0
$0
5
$62,338
Aggregated Statistics For Year 2001 (Based on 5 full and 16 partial tracts)
A) FHA, FSA/RHS & VA Home Purchase Loans
B) Conventional Home Purchase Loans
C) Refinancings
D) Home Improvement Loans
E) Loans on Dwellings For 5+ Families
F) Non-occupant Loans on < 5 Family Dwellings (A B C & D)
Number
Average Value
Number
Average Value
Number
Average Value
Number
Average Value
Number
Average Value
Number
Average Value
LOANS ORIGINATED
18
$93,861
50
$97,503
92
$104,905
14
$30,621
3
$104,433
59
$94,460
APPLICATIONS APPROVED, NOT ACCEPTED
1
$54,030
9
$135,506
38
$79,003
8
$37,329
0
$0
6
$43,355
APPLICATIONS DENIED
6
$85,388
13
$87,748
118
$66,258
51
$21,300
1
$157,630
27
$56,690
APPLICATIONS WITHDRAWN
7
$86,093
15
$102,759
49
$74,346
7
$18,459
1
$32,510
7
$60,527
FILES CLOSED FOR INCOMPLETENESS
1
$43,220
4
$37,845
16
$60,893
0
$0
0
$0
3
$50,000
Aggregated Statistics For Year 2000 (Based on 5 full and 16 partial tracts)
A) FHA, FSA/RHS & VA Home Purchase Loans
B) Conventional Home Purchase Loans
C) Refinancings
D) Home Improvement Loans
E) Loans on Dwellings For 5+ Families
F) Non-occupant Loans on < 5 Family Dwellings (A B C & D)
Number
Average Value
Number
Average Value
Number
Average Value
Number
Average Value
Number
Average Value
Number
Average Value
LOANS ORIGINATED
15
$62,295
54
$93,836
59
$74,687
15
$36,219
9
$176,168
30
$75,401
APPLICATIONS APPROVED, NOT ACCEPTED
2
$55,000
12
$77,430
34
$71,240
13
$22,272
1
$278,390
9
$58,018
APPLICATIONS DENIED
7
$71,051
28
$72,452
119
$68,020
41
$22,092
0
$0
16
$93,883
APPLICATIONS WITHDRAWN
2
$60,500
5
$69,314
56
$68,515
3
$11,500
1
$200,000
8
$60,284
FILES CLOSED FOR INCOMPLETENESS
2
$62,000
6
$49,613
22
$67,844
0
$0
0
$0
6
$55,823
Aggregated Statistics For Year 1999 (Based on 4 full and 8 partial tracts)
A) FHA, FSA/RHS & VA Home Purchase Loans
B) Conventional Home Purchase Loans
C) Refinancings
D) Home Improvement Loans
E) Loans on Dwellings For 5+ Families
F) Non-occupant Loans on < 5 Family Dwellings (A B C & D)
2002 - 2018 National Fire Incident Reporting System (NFIRS) incidents
Based on the data from the years 2002 - 2018 the average number of fire incidents per year is 66. The highest number of fire incidents - 195 took place in 2002, and the least - 0 in 2017. The data has a decreasing trend.
When looking into fire subcategories, the most incidents belonged to: Structure Fires (54.5%), and Outside Fires (23.4%).
Fire incident types reported to NFIRS in Zip Code 70113
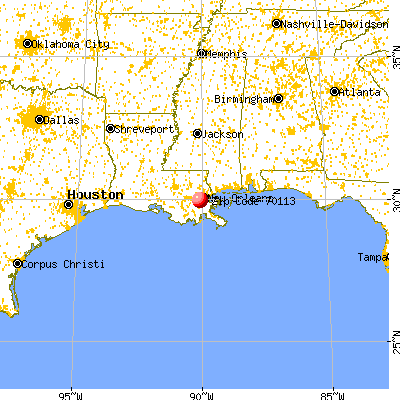


 Nearest zip codes: 70163, 70139, 70130, 70112, 70125, 70115.


 Based on the data from the years 2002 - 2018 the average number of fire incidents per year is 66. The highest number of fire incidents - 195 took place in 2002, and the least - 0 in 2017. The data has a decreasing trend.
 When looking into fire subcategories, the most incidents belonged to: Structure Fires (54.5%), and Outside Fires (23.4%).