Estimated zip code population in 2022: 892 Zip code population in 2010: 1,047 Zip code population in 2000: 1,008
Houses and condos: 346 Renter-occupied apartments: 30
% of renters here:
9%
State:
34%
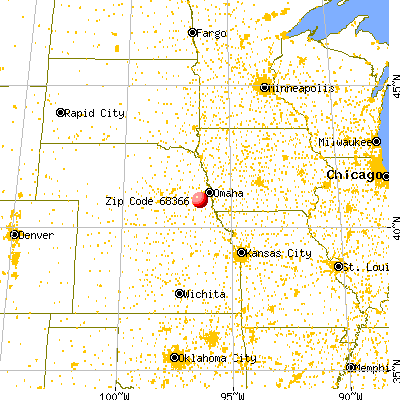
March 2022 cost of living index in zip code 68366: 74.7 (low, U.S. average is 100)
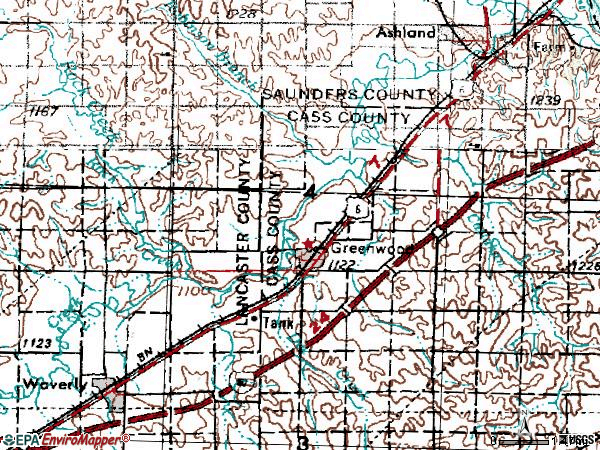
Land area: 51.9 sq. mi. Water area: 0.2 sq. mi.
Population density: 17 people per square mile
(very low).
OSM Map
General Map
Google Map
MSN Map
OSM Map
General Map
Google Map
MSN Map
OSM Map
General Map
Google Map
MSN Map
OSM Map
General Map
Google Map
MSN Map
Please wait while loading the map...
Real estate property taxes paid for housing units in 2022:
This zip code:
1.9% ($3,643)
Nebraska:
1.4% ($3,313)
Median real estate property taxes paid for housing units with mortgages in 2022: $3,267 (1.7%) Median real estate property taxes paid for housing units with no mortgage in 2022: $3,985 (2.1%)
Business Search- 14 Million verified businesses
Males: 481
(53.9%)
Females: 410
(46.1%)
For population 25 years and over in 68366:
High school or higher: 97.5%
Bachelor's degree or higher: 30.0%
Graduate or professional degree: 7.2%
Unemployed: 4.5%
Mean travel time to work (commute): 25.3 minutes
For population 15 years and over in 68366:
Never married: 26.4%
Now married: 59.5%
Separated: 1.6%
Widowed: 6.3%
Divorced: 6.2%
Zip code 68366 compared to state average:
Unemployed percentage above state average.
Black race population percentage significantly below state average.
Hispanic race population percentage significantly below state average.
Foreign-born population percentage significantly below state average.
Renting percentage significantly below state average.
Length of stay since moving in significantly above state average.
Averages for the 2020 tax year for zip code 68366, filed in 2021:
Average Adjusted Gross Income (AGI) in 2020: $76,485 (Individual Income Tax Returns)
Here:
$76,485
State:
$73,874
Salary/wage: $58,104 (reported on 89.1% of returns)
Here:
$58,104
State:
$58,268
(% of AGI for various income ranges: 1244.0% for AGIs below $25k, 3371.8% for AGIs $25k-50k, 7140.0% for AGIs $50k-75k, 8846.7% for AGIs $75k-100k, 20914.3% for AGIs $100k-200k)
Taxable interest for individuals: $1,445 (reported on 40.0% of returns)
This zip code:
$1,445
Nebraska:
$1,748
(% of AGI for various income ranges: 4.0% for AGIs below $25k, 18.2% for AGIs $25k-50k, 16.0% for AGIs $50k-75k, 13.3% for AGIs $75k-100k, 397.1% for AGIs $100k-200k)
Ordinary dividends: $1,983 (reported on 21.8% of returns)
Here:
$1,983
State:
$7,841
(% of AGI for various income ranges: 33.0% for AGIs below $25k, 80.0% for AGIs $50k-75k, 235.7% for AGIs $100k-200k)
Net capital gain/loss in AGI: +$6,238 (reported on 23.6% of returns)
Here:
+$6,238
State:
+$21,703
(% of AGI for various income ranges: 64.0% for AGIs below $25k, 246.0% for AGIs $50k-75k, 891.4% for AGIs $100k-200k)
Profit/loss from business: +$11,150 (reported on 14.5% of returns)
Here:
+$11,150
State:
+$11,239
(% of AGI for various income ranges: 308.2% for AGIs $25k-50k, 790.0% for AGIs $100k-200k)
Taxable individual retirement arrangement distribution: $21,750 (reported on 7.3% of returns)
68366:
$21,750
Nebraska:
$18,251
(% of AGI for various income ranges: 1740.0% for AGIs $50k-75k)
Total itemized deductions: $22,900 (reported on 5.5% of returns)
Here:
$22,900
State:
$37,704
(% of AGI for various income ranges: 1374.0% for AGIs $50k-75k)
Taxes paid: $5,733 (reported on 5.5% of returns)
68366:
$5,733
State:
$8,015
(% of AGI for various income ranges: 156.4% for AGIs $25k-50k)
Earned income credit: $2,560 (reported on 9.1% of returns)
Here:
$2,560
State:
$2,260
(% of AGI for various income ranges: 81.0% for AGIs below $25k, 42.7% for AGIs $25k-50k)
Percentage of individuals using paid preparers for their 2020 taxes: 98.2%
Here:
98%
State:
95%
(% for various income ranges: 100.0% for AGIs below $25k, 100.0% for AGIs $25k-50k, 87.5% for AGIs $50k-75k, 100.0% for AGIs $75k-100k, 100.0% for AGIs $100k-200k, 100.0% for AGIs over 200k)
Averages for the 2012 tax year for zip code 68366, filed in 2013:
Average Adjusted Gross Income (AGI) in 2012: $58,246 (Individual Income Tax Returns)
Here:
$58,246
State:
$60,572
Salary/wage: $46,018 (reported on 86.5% of returns)
Here:
$46,018
State:
$47,046
(% of AGI for various income ranges: 76.4% for AGIs below $25k, 78.5% for AGIs $25k-50k, 77.0% for AGIs $50k-75k, 73.3% for AGIs $75k-100k, 58.2% for AGIs $100k-200k)
Taxable interest for individuals: $775 (reported on 38.5% of returns)
This zip code:
$775
Nebraska:
$1,535
(% of AGI for various income ranges: 0.4% for AGIs below $25k, 0.4% for AGIs $25k-50k, 0.5% for AGIs $50k-75k, 1.1% for AGIs $75k-100k, 0.3% for AGIs $100k-200k)
Ordinary dividends: $1,433 (reported on 23.1% of returns)
Here:
$1,433
State:
$5,776
(% of AGI for various income ranges: 1.1% for AGIs below $25k, 0.1% for AGIs $50k-75k, 0.9% for AGIs $75k-100k, 0.7% for AGIs $100k-200k)
Net capital gain/loss in AGI: +$557 (reported on 13.5% of returns)
Here:
+$557
State:
+$16,171
(% of AGI for various income ranges: 0.6% for AGIs $100k-200k)
Profit/loss from business: +$7,400 (reported on 15.4% of returns)
Here:
+$7,400
State:
+$9,897
Taxable individual retirement arrangement distribution: $10,733 (reported on 11.5% of returns)
68366:
$10,733
Nebraska:
$12,804
Total itemized deductions: $20,478 (21% of AGI, reported on 34.6% of returns)
Here:
$20,478
State:
$23,343
Here:
21.5% of AGI
State:
18.7% of AGI
(% of AGI for various income ranges: 14.1% for AGIs $25k-50k, 13.2% for AGIs $50k-75k, 11.4% for AGIs $75k-100k, 13.1% for AGIs $100k-200k)
Charity contributions: $3,215 (reported on 25.0% of returns)
Here:
$3,215
State:
$4,921
(% of AGI for various income ranges: 1.5% for AGIs $50k-75k, 1.9% for AGIs $75k-100k, 1.8% for AGIs $100k-200k)
Taxes paid: $7,528 (reported on 34.6% of returns)
68366:
$7,528
State:
$9,758
(% of AGI for various income ranges: 2.8% for AGIs $25k-50k, 3.5% for AGIs $50k-75k, 5.1% for AGIs $75k-100k, 5.8% for AGIs $100k-200k)
Earned income credit: $2,038 (reported on 15.4% of returns)
Here:
$2,038
State:
$2,188
(% of AGI for various income ranges: 5.8% for AGIs below $25k, 1.4% for AGIs $25k-50k)
Percentage of individuals using paid preparers for their 2012 taxes: 59.6%
Here:
60%
State:
57%
(% for various income ranges: 50.0% for AGIs below $25k, 58.3% for AGIs $25k-50k, 66.7% for AGIs $50k-75k, 71.4% for AGIs $75k-100k, 62.5% for AGIs $100k-200k)
Averages for the 2004 tax year for zip code 68366, filed in 2005:
Average Adjusted Gross Income (AGI) in 2004: $43,431 (Individual Income Tax Returns)
Here:
$43,431
State:
$44,271
Salary/wage: $38,734 (reported on 86.4% of returns)
Here:
$38,734
State:
$38,230
(% of AGI for various income ranges: 90.0% for AGIs below $10k, 73.2% for AGIs $10k-25k, 83.6% for AGIs $25k-50k, 78.2% for AGIs $50k-75k, 76.9% for AGIs $75k-100k, 68.3% for AGIs over 100k)
Taxable interest for individuals: $1,211 (reported on 48.9% of returns)
This zip code:
$1,211
Nebraska:
$1,759
(% of AGI for various income ranges: 5.7% for AGIs below $10k, 2.8% for AGIs $10k-25k, 0.5% for AGIs $25k-50k, 2.1% for AGIs $50k-75k, 1.1% for AGIs $75k-100k, 0.6% for AGIs over 100k)
Taxable dividends: $702 (reported on 23.6% of returns)
Here:
$702
State:
$2,804
(% of AGI for various income ranges: 1.3% for AGIs $10k-25k, 0.3% for AGIs $25k-50k, 0.3% for AGIs $50k-75k, 0.3% for AGIs $75k-100k, 0.4% for AGIs over 100k)
Net capital gain/loss: +$4,279 (reported on 16.8% of returns)
Here:
+$4,279
State:
+$7,887
(% of AGI for various income ranges: 1.2% for AGIs $10k-25k, -0.2% for AGIs $25k-50k, 1.1% for AGIs $50k-75k, 2.0% for AGIs $75k-100k, 4.5% for AGIs over 100k)
Profit/loss from business: +$5,729 (reported on 16.6% of returns)
Here:
+$5,729
State:
+$7,743
(% of AGI for various income ranges: 1.3% for AGIs $10k-25k, 4.1% for AGIs $25k-50k, 5.8% for AGIs $50k-75k, -2.9% for AGIs $75k-100k)
IRA payment deduction: $2,917 (reported on 2.3% of returns)
68366:
$2,917
Nebraska:
$2,902
Total itemized deductions: $16,023 (23% of AGI, reported on 33.5% of returns)
Here:
$16,023
State:
$18,692
Here:
22.9% of AGI
State:
21.1% of AGI
(% of AGI for various income ranges: 8.9% for AGIs $10k-25k, 10.2% for AGIs $25k-50k, 14.6% for AGIs $50k-75k, 13.3% for AGIs $75k-100k, 13.2% for AGIs over 100k)
Charity contributions deductions: $2,300 (3% of AGI, reported on 27.3% of returns)
Here:
$2,300
State:
$3,500
Here:
3.1% of AGI
State:
3.8% of AGI
(% of AGI for various income ranges: 1.4% for AGIs $25k-50k, 1.4% for AGIs $50k-75k, 1.8% for AGIs $75k-100k, 1.9% for AGIs over 100k)
Total tax: $5,222 (reported on 78.9% of returns)
68366:
$5,222
State:
$6,550
(% of AGI for various income ranges: 2.2% for AGIs below $10k, 4.0% for AGIs $10k-25k, 6.6% for AGIs $25k-50k, 9.3% for AGIs $50k-75k, 9.7% for AGIs $75k-100k, 15.6% for AGIs over 100k)
Earned income credit: $1,615 (reported on 10.1% of returns)
Here:
$1,615
State:
$1,643
Percentage of individuals using paid preparers for their 2004 taxes: 63.5%
Here:
64%
State:
62%
(% for various income ranges: 46.8% for AGIs below $10k, 62.7% for AGIs $10k-25k, 65.4% for AGIs $25k-50k, 71.0% for AGIs $50k-75k, 72.9% for AGIs $75k-100k, 69.0% for AGIs over 100k)
Household received Food Stamps/SNAP in the past 12 months: 37 Household did not receive Food Stamps/SNAP in the past 12 months: 291
Women who had a birth in the past 12 months: 15 (16 now married, 0 unmarried) Women who did not have a birth in the past 12 months: 167 (90 now married, 76 unmarried)
Housing units in zip code 68366 with a mortgage: 172 (18 second mortgage, 18 both second mortgage and home equity loan) Houses without a mortgage: 3
Median monthly owner costs for units with a mortgage: $1,560 Median monthly owner costs for units without a mortgage: $598
Residents with income below the poverty level in 2022:
This zip code:
7.2%
Whole state:
11.2%
Residents with income below 50% of the poverty level in 2022:
This zip code:
5.0%
Whole state:
6.1%
Median number of rooms in houses and condos:
Here:
6.3
State:
7.1
Median number of rooms in apartments:
Here:
4.9
State:
4.2
Notable locations in this zip code not listed on our city pages
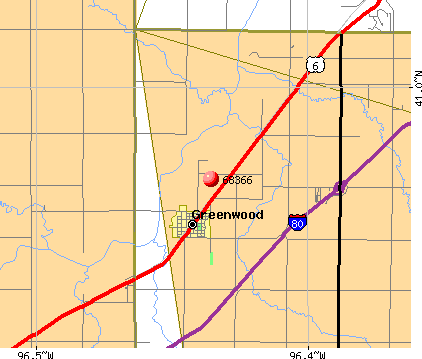
Notable locations in zip code 68366: Greenwood Farmers Cooperative Elevator (A), Pine Grove Holiday Trav-L-Park (B), Greenwood Depot Museum (C), Greenwood Volunteer Fire Department (D), Greenwood Public Library (E), Greenwood Volunteer Rescue Squad (F). Display/hide their locations on the map
Churches in zip code 68366 include: Cedar Hill Church (A), Greenwood Christian Church (B), Greenwood United Methodist Church (C), Saint Joseph Catholic Church (D). Display/hide their locations on the map
177 married couples with children.
30 single-parent households (5 men, 25 women).
97.2% of residents of 68366 zip code speak English at home.
1.8% of residents speak Spanish at home (73% very well, 20% well, 7% not well).
0.5% of residents speak other Indo-European language at home (50% very well, 50% not well).
0.5% of residents speak Asian or Pacific Island language at home (100% very well).
Foreign born population: 11 (1.2%) (83.0% of them are naturalized citizens)
This zip code:
1.2%
Whole state:
7.2%
55%Honduras
27%Thailand
30%German
27%American
11%English
7%Danish
5%European
4%Irish
2%Czech
Year of entry for the foreign-born population
22010 or later
02000 to 2009
121990 to 1999
12Before 1990
Facilities with environmental interests located in this zip code:
GREENWOOD FARMERS CO-OP (219 HIGHWAY 6 in GREENWOOD, NE)
AIR MINOR (AIRS/AFS) COMPLIANCE ACTIVITY (Tracking inspections of insecticide, fungicide, and rodenticide, and toxic substances) STATE MASTER (Nebraska tracking) - AIR PROGRAM, HAZARDOUS WASTE PROGRAM, EPCRA Business SIC classification: GRAIN AND FIELD BEANS Alternative names: GREENWOOD FARMERS COOP, GREENWOOD FARMERS COOP (DON DOWLAND), MEYER, BRIAN-GREENWOOD FARMERS COOP
WILLIAMS PIPELINE - GREENWOOD (18805 HIGHWAY 6 in GREENWOOD, NE)
AIR MINOR (AIRS/AFS) (Integrated Compliance Information System) - ICIS-07-1996-0189, FORMAL ENFORCEMENT ACTION STATE MASTER (Nebraska tracking) - AIR PROGRAM, HAZARDOUS WASTE PROGRAM, EPCRA Conditionally Exempt Small Quantity Generators, less than 100 kg/month of hazardous waste (Resource Conservation and Recovery Act (tracking hazardous waste)) - notification Business SIC classification: PIPELINES Organizations: WILLIAMS PIPELINE COMPANY (CONTACT/OWNER)
Alternative names: MAPCO AMMONIA PIPELINE, MID-AMERICA PIPE LINE COMPANY, RUSSEL EDWARDS, WILLIAMS PIPE LINE CO
GREENWOOD WASTEWATER TREATMENT (449 N BROAD ST in GREENWOOD, NE)
AIR MINOR (AIRS/AFS) STATE MASTER (Nebraska tracking) - OPERATOR CERTIFICATION, National Pollutant Discharge Elimination System Permit, WASTEWATER FACILITY National Pollutant Discharge Elimination System NON-MAJOR (Tracking pollutant discharge elimination systems) - permit Business SIC classification: SEWERAGE SYSTEMS; REFUSE SYSTEMS Organizations: KENNETH VANDEMAN,W/W OPERATOR (CONTACT/OPERATOR)
Alternative names: GREENWOOD WWTF
GREENWOOD FARMERS COOPERATIVE (426 HIGHWAY 6 in GREENWOOD, NE)
STATE MASTER (Nebraska tracking) - -082399-NM-0900, LEAKING STORAGE TANK Conditionally Exempt Small Quantity Generators, less than 100 kg/month of hazardous waste (Resource Conservation and Recovery Act (tracking hazardous waste)) Organizations: MIDWEST FARMERS COOP (CONTACT/OPERATOR)
, FARMER COOP (CONTACT/OWNER)
Alternative names: GREENWOOD FARMERS CO-OP
GREENWOOD INTERCHANGE SID WWTF (I-80& HWY 63 N in GREENWOOD, NE)
STATE MASTER (Nebraska tracking) - LEGAL SERVICES, OPERATOR CERTIFICATION, National Pollutant Discharge Elimination System Permit National Pollutant Discharge Elimination System NON-MAJOR (Tracking pollutant discharge elimination systems) - permit Business SIC classification: SEWERAGE SYSTEMS Organizations: GARY BUCK, OPERATOR (CONTACT/OPERATOR)
Alternative names: SID 2 CASS GREENWOOD INTRCHNGE, SID #2 CASS COUNTY/ GREENWOOD
GREENWOOD LANDFILL (4TH STREET in GREENWOOD, NE)
AIR MINOR (AIRS/AFS) STATE MASTER (Nebraska tracking) - AIR PROGRAM, REFUSE DISPOSAL, LEGAL SERVICES Business SIC classification: AIR AND WATER RESOURCE AND SOLID WASTE MANAGEMENT
GREENWOOD MUNICIPAL POWER PLNT (120 ELM STREET in GREENWOOD, NE)
AIR MINOR (AIRS/AFS) STATE MASTER (Nebraska tracking) - AIR PROGRAM Business SIC classification: ELECTRIC SERVICES Alternative names: VILLAGE OF GREENWOOD
GREENWOOD PROPANE TERMINAL (18805 HIGHWAY 6 in GREENWOOD, NE)
(Integrated Compliance Information System) - ICIS-07-2005-0070, FORMAL ENFORCEMENT ACTION, ICIS-07-2005-0081,
MID AMERICA 66 SERVICE (I 80 & GREENWOOD EXCHANGE in GREENWOOD, NE)
(Integrated Compliance Information System) - ICIS-07-1991-0210, FORMAL ENFORCEMENT ACTION Business SIC classification: GASOLINE SERVICE STATIONS
GREENWOOD ELEMENTARY SCHOOL (JCT 5TH & ELM STS in GREENWOOD, NE)
AIR MINOR (AIRS/AFS) Business SIC classification: REFUSE SYSTEMS
GREENWOOD ELEC DEPT (BOX 190 in GREENWOOD, NE)
COMPLIANCE ACTIVITY (Tracking inspections of insecticide, fungicide, and rodenticide, and toxic substances) Business SIC classification: ELECTRIC SERVICES
Housing units lacking complete plumbing facilities: 2.2% Housing units lacking complete kitchen facilities: 0.4%
52.4%Utility gas
28.2%Electricity
12.1%Bottled, tank, or LP gas
6.7%Wood
1.3%Fuel oil, kerosene, etc.
Population in 1990: 813. Population change in the 1990s: +195 (+24.0%).
Place of birth for U.S.-born residents:
This state: 645
Northeast: 31
Midwest: 94
South: 17
West: 71
57% of the 68366 zip code residents lived in the same house 5 years ago. Out of people who lived in different houses, 22% lived in this county. Out of people who lived in different counties, 50% lived in Nebraska.
101% of the 68366 zip code residents lived in the same house 1 year ago.
Private vs. public school enrollment:
Students in private schools in grades 1 to 8 (elementary and middle school):
Here:
0.0%
Nebraska:
14.1%
Students in private schools in grades 9 to 12 (high school): 4
Here:
4.0%
Nebraska:
12.5%
Students in private undergraduate colleges: 1
Here:
3.8%
Nebraska:
18.0%
Occupation by median earnings in the past 12 months ($)
131,990Computer and mathematical occupations
102,340Management occupations
89,061Health diagnosing and treating practitioners and other technical occupations
66,129Production occupations
60,657Office and administrative support occupations
60,196Transportation occupations
Companies with federal contracts located in this zip code:
LEROY DREWS (RR 1 BOX 69 in GREENWOOD, NE; small business)
$13,795 with U.S. Army Corps of Engineers - civil program financing only for Custodial Janitorial Services. Taking place in SD. Signed on 2001-03-22. Completion date: 2001-04-01.
Top industries in this zip code by the number of employees in 2005:
Wholesale Trade: Automobile and Other Motor Vehicle Merchant Wholesalers (10-19 employees: 1 establishment)
Mining: Natural Gas Liquid Extraction (5-9: 1)
Wholesale Trade: Grain and Field Bean Merchant Wholesalers (5-9: 1)
Fatal accident statistics in 2014:
Fatal accident count: 1
Vehicles involved in fatal accidents: 1
Fatal accidents caused by drunken drivers: 1
Fatalities: 1
Persons involved in fatal accidents: 1
Pedestrians involved in fatal accidents: 0
Fatal accident statistics in 2013:
Fatal accident count: 1
Vehicles involved in fatal accidents: 1
Fatal accidents caused by drunken drivers: 1
Fatalities: 1
Persons involved in fatal accidents: 1
Pedestrians involved in fatal accidents: 0
Home Mortgage Disclosure Act Aggregated Statistics For Year 2009 (Based on 2 partial tracts)
A) FHA, FSA/RHS & VA Home Purchase Loans
B) Conventional Home Purchase Loans
C) Refinancings
D) Home Improvement Loans
F) Non-occupant Loans on < 5 Family Dwellings (A B C & D)
Number
Average Value
Number
Average Value
Number
Average Value
Number
Average Value
Number
Average Value
LOANS ORIGINATED
8
$139,505
10
$133,026
57
$160,377
3
$27,003
2
$78,405
APPLICATIONS APPROVED, NOT ACCEPTED
0
$0
0
$0
4
$152,945
1
$30,900
0
$0
APPLICATIONS DENIED
0
$0
0
$0
9
$146,926
2
$37,690
0
$0
APPLICATIONS WITHDRAWN
1
$75,380
2
$144,595
10
$160,525
0
$0
0
$0
FILES CLOSED FOR INCOMPLETENESS
0
$0
0
$0
3
$157,643
0
$0
0
$0
Aggregated Statistics For Year 2008 (Based on 2 partial tracts)
A) FHA, FSA/RHS & VA Home Purchase Loans
B) Conventional Home Purchase Loans
C) Refinancings
D) Home Improvement Loans
F) Non-occupant Loans on < 5 Family Dwellings (A B C & D)
Number
Average Value
Number
Average Value
Number
Average Value
Number
Average Value
Number
Average Value
LOANS ORIGINATED
6
$151,240
11
$159,163
23
$168,874
4
$17,592
2
$122,045
APPLICATIONS APPROVED, NOT ACCEPTED
0
$0
1
$172,050
4
$215,065
1
$74,330
0
$0
APPLICATIONS DENIED
0
$0
1
$148,040
13
$153,902
4
$42,960
0
$0
APPLICATIONS WITHDRAWN
1
$120,270
1
$217,150
5
$172,218
1
$70,780
0
$0
FILES CLOSED FOR INCOMPLETENESS
0
$0
0
$0
1
$127,370
0
$0
0
$0
Aggregated Statistics For Year 2007 (Based on 2 partial tracts)
A) FHA, FSA/RHS & VA Home Purchase Loans
B) Conventional Home Purchase Loans
C) Refinancings
D) Home Improvement Loans
F) Non-occupant Loans on < 5 Family Dwellings (A B C & D)
Number
Average Value
Number
Average Value
Number
Average Value
Number
Average Value
Number
Average Value
LOANS ORIGINATED
2
$165,890
21
$151,728
21
$134,666
4
$37,322
3
$84,217
APPLICATIONS APPROVED, NOT ACCEPTED
0
$0
1
$144,280
2
$209,320
1
$40,090
0
$0
APPLICATIONS DENIED
0
$0
2
$140,730
12
$139,948
3
$42,387
0
$0
APPLICATIONS WITHDRAWN
0
$0
3
$116,997
5
$159,440
1
$13,990
0
$0
FILES CLOSED FOR INCOMPLETENESS
0
$0
0
$0
2
$106,175
0
$0
0
$0
Aggregated Statistics For Year 2006 (Based on 2 partial tracts)
A) FHA, FSA/RHS & VA Home Purchase Loans
B) Conventional Home Purchase Loans
C) Refinancings
D) Home Improvement Loans
F) Non-occupant Loans on < 5 Family Dwellings (A B C & D)
Number
Average Value
Number
Average Value
Number
Average Value
Number
Average Value
Number
Average Value
LOANS ORIGINATED
2
$188,025
24
$137,799
26
$121,770
6
$38,907
3
$127,090
APPLICATIONS APPROVED, NOT ACCEPTED
0
$0
1
$153,890
4
$144,750
1
$45,520
0
$0
APPLICATIONS DENIED
0
$0
4
$122,565
12
$138,295
1
$21,510
0
$0
APPLICATIONS WITHDRAWN
0
$0
3
$125,627
7
$134,050
0
$0
0
$0
FILES CLOSED FOR INCOMPLETENESS
0
$0
1
$155,760
1
$151,800
1
$63,480
0
$0
Aggregated Statistics For Year 2005 (Based on 2 partial tracts)
A) FHA, FSA/RHS & VA Home Purchase Loans
B) Conventional Home Purchase Loans
C) Refinancings
D) Home Improvement Loans
F) Non-occupant Loans on < 5 Family Dwellings (A B C & D)
Number
Average Value
Number
Average Value
Number
Average Value
Number
Average Value
Number
Average Value
LOANS ORIGINATED
3
$126,047
26
$114,157
33
$131,285
6
$31,007
2
$88,635
APPLICATIONS APPROVED, NOT ACCEPTED
0
$0
1
$148,250
4
$125,855
0
$0
0
$0
APPLICATIONS DENIED
0
$0
2
$124,340
18
$123,238
2
$26,725
0
$0
APPLICATIONS WITHDRAWN
0
$0
2
$219,555
11
$123,895
1
$30,480
0
$0
FILES CLOSED FOR INCOMPLETENESS
0
$0
0
$0
2
$154,410
0
$0
0
$0
Aggregated Statistics For Year 2004 (Based on 2 partial tracts)
A) FHA, FSA/RHS & VA Home Purchase Loans
B) Conventional Home Purchase Loans
C) Refinancings
D) Home Improvement Loans
F) Non-occupant Loans on < 5 Family Dwellings (A B C & D)
G) Loans On Manufactured Home Dwelling (A B C & D)
Number
Average Value
Number
Average Value
Number
Average Value
Number
Average Value
Number
Average Value
Number
Average Value
LOANS ORIGINATED
3
$109,410
19
$127,357
41
$132,955
5
$40,674
3
$76,490
1
$50,530
APPLICATIONS APPROVED, NOT ACCEPTED
0
$0
1
$190,430
5
$133,464
0
$0
0
$0
0
$0
APPLICATIONS DENIED
0
$0
2
$173,720
13
$114,374
2
$31,110
1
$91,040
0
$0
APPLICATIONS WITHDRAWN
0
$0
2
$66,710
7
$132,499
0
$0
0
$0
0
$0
FILES CLOSED FOR INCOMPLETENESS
0
$0
1
$71,200
4
$118,285
1
$107,740
0
$0
0
$0
Aggregated Statistics For Year 2003 (Based on 2 partial tracts)
A) FHA, FSA/RHS & VA Home Purchase Loans
B) Conventional Home Purchase Loans
C) Refinancings
D) Home Improvement Loans
F) Non-occupant Loans on < 5 Family Dwellings (A B C & D)
Number
Average Value
Number
Average Value
Number
Average Value
Number
Average Value
Number
Average Value
LOANS ORIGINATED
3
$121,453
16
$120,739
86
$125,375
6
$16,843
3
$82,060
APPLICATIONS APPROVED, NOT ACCEPTED
0
$0
1
$89,780
5
$108,826
0
$0
0
$0
APPLICATIONS DENIED
1
$78,300
2
$231,870
17
$109,976
2
$18,270
0
$0
APPLICATIONS WITHDRAWN
0
$0
1
$126,530
9
$130,314
0
$0
0
$0
FILES CLOSED FOR INCOMPLETENESS
0
$0
0
$0
3
$100,640
0
$0
0
$0
Aggregated Statistics For Year 2002 (Based on 2 partial tracts)
A) FHA, FSA/RHS & VA Home Purchase Loans
B) Conventional Home Purchase Loans
C) Refinancings
D) Home Improvement Loans
F) Non-occupant Loans on < 5 Family Dwellings (A B C & D)
Number
Average Value
Number
Average Value
Number
Average Value
Number
Average Value
Number
Average Value
LOANS ORIGINATED
3
$97,857
12
$131,927
55
$125,045
4
$10,752
3
$49,207
APPLICATIONS APPROVED, NOT ACCEPTED
0
$0
1
$179,990
6
$123,748
0
$0
0
$0
APPLICATIONS DENIED
0
$0
1
$97,510
9
$99,528
1
$27,770
1
$46,350
APPLICATIONS WITHDRAWN
0
$0
0
$0
9
$113,309
0
$0
0
$0
FILES CLOSED FOR INCOMPLETENESS
0
$0
0
$0
2
$79,865
0
$0
0
$0
Aggregated Statistics For Year 2001 (Based on 2 partial tracts)
A) FHA, FSA/RHS & VA Home Purchase Loans
B) Conventional Home Purchase Loans
C) Refinancings
D) Home Improvement Loans
F) Non-occupant Loans on < 5 Family Dwellings (A B C & D)
Number
Average Value
Number
Average Value
Number
Average Value
Number
Average Value
Number
Average Value
LOANS ORIGINATED
3
$80,877
11
$127,785
41
$102,078
6
$16,425
4
$61,388
APPLICATIONS APPROVED, NOT ACCEPTED
0
$0
1
$126,950
4
$95,160
1
$35,500
0
$0
APPLICATIONS DENIED
0
$0
1
$121,730
9
$84,936
1
$37,790
0
$0
APPLICATIONS WITHDRAWN
0
$0
1
$19,420
7
$90,410
1
$28,190
0
$0
FILES CLOSED FOR INCOMPLETENESS
0
$0
0
$0
3
$77,603
0
$0
0
$0
Aggregated Statistics For Year 2000 (Based on 2 partial tracts)
A) FHA, FSA/RHS & VA Home Purchase Loans
B) Conventional Home Purchase Loans
C) Refinancings
D) Home Improvement Loans
F) Non-occupant Loans on < 5 Family Dwellings (A B C & D)
Number
Average Value
Number
Average Value
Number
Average Value
Number
Average Value
Number
Average Value
LOANS ORIGINATED
2
$111,710
14
$122,089
13
$97,863
5
$9,020
2
$64,935
APPLICATIONS APPROVED, NOT ACCEPTED
0
$0
1
$116,930
2
$59,300
1
$19,840
0
$0
APPLICATIONS DENIED
0
$0
2
$55,960
5
$78,760
1
$26,730
0
$0
APPLICATIONS WITHDRAWN
0
$0
1
$86,650
3
$64,170
0
$0
0
$0
FILES CLOSED FOR INCOMPLETENESS
0
$0
0
$0
1
$112,960
0
$0
0
$0
Aggregated Statistics For Year 1999 (Based on 1 partial tract)
A) FHA, FSA/RHS & VA Home Purchase Loans
B) Conventional Home Purchase Loans
C) Refinancings
D) Home Improvement Loans
F) Non-occupant Loans on < 5 Family Dwellings (A B C & D)
Detailed PMIC statistics for the following Tracts:0101.00
2002 - 2018 National Fire Incident Reporting System (NFIRS) incidents
According to the data from the years 2002 - 2018 the average number of fires per year is 8. The highest number of fire incidents - 25 took place in 2005, and the least - 0 in 2008. The data has an increasing trend.
When looking into fire subcategories, the most reports belonged to: Outside Fires (51.1%), and Mobile Property/Vehicle Fires (29.3%).
Fire incident types reported to NFIRS in Zip Code 68366


 Nearest zip codes: 68462, 68304, 68003, 68042, 68527, 68033.


 According to the data from the years 2002 - 2018 the average number of fires per year is 8. The highest number of fire incidents - 25 took place in 2005, and the least - 0 in 2008. The data has an increasing trend.
 When looking into fire subcategories, the most reports belonged to: Outside Fires (51.1%), and Mobile Property/Vehicle Fires (29.3%).