Estimated median house/condo value in 2022: $240,979
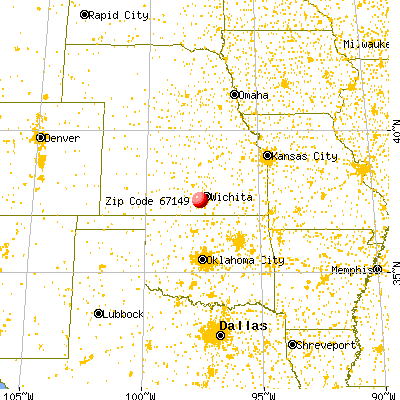
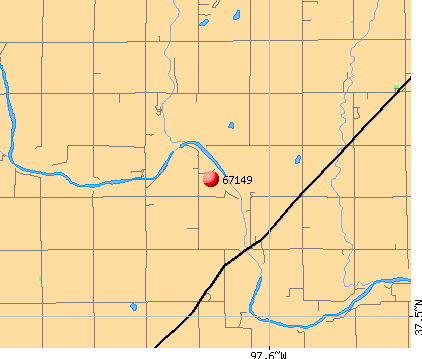
67149:
$240,979
Kansas:
$206,600
According to our research of Kansas and other state lists, there were 2 registered sex offenders living in 67149 zip code as of July 03, 2024. The ratio of all residents to sex offenders in zip code 67149 is 442 to 1. The ratio of registered sex offenders to all residents in this zip code is lower than the state average.
Median resident age:
This zip code:
42.0 years
Kansas median age:
37.6 years
Average household size:
This zip code:
3.0 people
Kansas:
2.4 people
Averages for the 2020 tax year for zip code 67149, filed in 2021:
Average Adjusted Gross Income (AGI) in 2020: $101,964 (Individual Income Tax Returns)
Here:
$101,964
State:
$72,721
Salary/wage: $63,305 (reported on 82.0% of returns)
Here:
$63,305
State:
$58,641
(% of AGI for various income ranges: 1142.2% for AGIs below $25k, 3532.9% for AGIs $25k-50k, 6081.7% for AGIs $50k-75k, 9484.0% for AGIs $75k-100k, 17715.0% for AGIs $100k-200k)
Taxable interest for individuals: $1,444 (reported on 50.0% of returns)
This zip code:
$1,444
Kansas:
$1,625
(% of AGI for various income ranges: 17.8% for AGIs below $25k, 28.6% for AGIs $25k-50k, 26.7% for AGIs $50k-75k, 10.0% for AGIs $75k-100k, 121.7% for AGIs $100k-200k)
Ordinary dividends: $4,329 (reported on 28.0% of returns)
Here:
$4,329
State:
$7,290
(% of AGI for various income ranges: 135.7% for AGIs $25k-50k, 268.3% for AGIs $50k-75k, 583.3% for AGIs $100k-200k)
Net capital gain/loss in AGI: +$22,354 (reported on 26.0% of returns)
Here:
+$22,354
State:
+$20,511
(% of AGI for various income ranges: 112.9% for AGIs $25k-50k, 128.3% for AGIs $50k-75k, 4583.3% for AGIs $100k-200k)
Profit/loss from business: +$8,150 (reported on 20.0% of returns)
Here:
+$8,150
State:
+$13,852
(% of AGI for various income ranges: 236.7% for AGIs below $25k, 326.7% for AGIs $50k-75k, 676.7% for AGIs $100k-200k)
Taxable individual retirement arrangement distribution: $19,967 (reported on 12.0% of returns)
67149:
$19,967
Kansas:
$19,921
(% of AGI for various income ranges: 182.2% for AGIs below $25k, 720.0% for AGIs $50k-75k, 1003.3% for AGIs $100k-200k)
Total itemized deductions: $39,700 (reported on 8.0% of returns)
Here:
$39,700
State:
$36,939
(% of AGI for various income ranges: 2646.7% for AGIs $100k-200k)
Charity contributions: $21,467 (reported on 6.0% of returns)
Here:
$21,467
State:
$15,443
(% of AGI for various income ranges: 1073.3% for AGIs $100k-200k)
Taxes paid: $7,700 (reported on 8.0% of returns)
67149:
$7,700
State:
$8,001
(% of AGI for various income ranges: 513.3% for AGIs $100k-200k)
Earned income credit: $1,967 (reported on 6.0% of returns)
Here:
$1,967
State:
$2,267
(% of AGI for various income ranges: 65.6% for AGIs below $25k)
Percentage of individuals using paid preparers for their 2020 taxes: 96.0%
Here:
96%
State:
95%
(% for various income ranges: 92.3% for AGIs below $25k, 100.0% for AGIs $25k-50k, 100.0% for AGIs $50k-75k, 85.7% for AGIs $75k-100k, 100.0% for AGIs $100k-200k, 100.0% for AGIs over 200k)
Averages for the 2012 tax year for zip code 67149, filed in 2013:
Average Adjusted Gross Income (AGI) in 2012: $73,620 (Individual Income Tax Returns)
Here:
$73,620
State:
$60,095
Salary/wage: $54,345 (reported on 82.4% of returns)
Here:
$54,345
State:
$48,770
(% of AGI for various income ranges: 77.4% for AGIs below $25k, 79.1% for AGIs $25k-50k, 75.3% for AGIs $50k-75k, 72.4% for AGIs $75k-100k, 50.5% for AGIs $100k-200k)
Taxable interest for individuals: $537 (reported on 52.9% of returns)
This zip code:
$537
Kansas:
$1,506
(% of AGI for various income ranges: 1.1% for AGIs below $25k, 0.3% for AGIs $25k-50k, 0.2% for AGIs $50k-75k, 0.2% for AGIs $75k-100k, 0.4% for AGIs $100k-200k)
Ordinary dividends: $1,533 (reported on 23.5% of returns)
Here:
$1,533
State:
$6,093
(% of AGI for various income ranges: 1.0% for AGIs $25k-50k, 0.2% for AGIs $75k-100k, 0.6% for AGIs $100k-200k)
Net capital gain/loss in AGI: +$1,611 (reported on 17.6% of returns)
Here:
+$1,611
State:
+$14,598
(% of AGI for various income ranges: 0.2% for AGIs $50k-75k, 0.7% for AGIs $100k-200k)
Profit/loss from business: +$12,038 (reported on 15.7% of returns)
Here:
+$12,038
State:
+$12,554
(% of AGI for various income ranges: 1.1% for AGIs below $25k, 8.9% for AGIs $50k-75k, 2.5% for AGIs $100k-200k)
Taxable individual retirement arrangement distribution: $9,057 (reported on 13.7% of returns)
67149:
$9,057
Kansas:
$14,098
Total itemized deductions: $21,943 (17% of AGI, reported on 41.2% of returns)
Here:
$21,943
State:
$23,678
Here:
17.2% of AGI
State:
18.9% of AGI
(% of AGI for various income ranges: 18.1% for AGIs $25k-50k, 10.4% for AGIs $50k-75k, 14.7% for AGIs $75k-100k, 12.3% for AGIs $100k-200k)
Charity contributions: $4,761 (reported on 35.3% of returns)
Here:
$4,761
State:
$5,321
(% of AGI for various income ranges: 1.4% for AGIs $25k-50k, 2.3% for AGIs $50k-75k, 2.3% for AGIs $75k-100k, 2.6% for AGIs $100k-200k)
Taxes paid: $8,519 (reported on 41.2% of returns)
67149:
$8,519
State:
$9,548
(% of AGI for various income ranges: 4.1% for AGIs $25k-50k, 3.3% for AGIs $50k-75k, 4.9% for AGIs $75k-100k, 5.6% for AGIs $100k-200k)
Earned income credit: $1,580 (reported on 9.8% of returns)
Here:
$1,580
State:
$2,212
(% of AGI for various income ranges: 3.8% for AGIs below $25k)
Percentage of individuals using paid preparers for their 2012 taxes: 66.7%
Here:
67%
State:
56%
(% for various income ranges: 61.1% for AGIs below $25k, 66.7% for AGIs $25k-50k, 71.4% for AGIs $50k-75k, 66.7% for AGIs $75k-100k, 72.7% for AGIs $100k-200k)
Averages for the 2004 tax year for zip code 67149, filed in 2005:
Average Adjusted Gross Income (AGI) in 2004: $45,346 (Individual Income Tax Returns)
Here:
$45,346
State:
$45,726
Salary/wage: $44,527 (reported on 82.7% of returns)
Here:
$44,527
State:
$40,112
(% of AGI for various income ranges: 111.9% for AGIs below $10k, 71.4% for AGIs $10k-25k, 74.9% for AGIs $25k-50k, 83.7% for AGIs $50k-75k, 92.6% for AGIs $75k-100k, 75.7% for AGIs over 100k)
Taxable interest for individuals: $1,030 (reported on 54.7% of returns)
This zip code:
$1,030
Kansas:
$1,749
(% of AGI for various income ranges: 6.4% for AGIs below $10k, 4.0% for AGIs $10k-25k, 1.2% for AGIs $25k-50k, 0.5% for AGIs $50k-75k, 0.6% for AGIs $75k-100k, 1.2% for AGIs over 100k)
Taxable dividends: $781 (reported on 28.2% of returns)
Here:
$781
State:
$3,066
(% of AGI for various income ranges: 1.2% for AGIs below $10k, 1.4% for AGIs $10k-25k, 1.1% for AGIs $25k-50k, 0.1% for AGIs $50k-75k, 0.1% for AGIs $75k-100k, 0.5% for AGIs over 100k)
Net capital gain/loss: +$1,446 (reported on 18.9% of returns)
Here:
+$1,446
State:
+$7,555
(% of AGI for various income ranges: 1.2% for AGIs $10k-25k, 0.7% for AGIs $25k-50k, 1.4% for AGIs $50k-75k, -0.1% for AGIs $75k-100k, 0.3% for AGIs over 100k)
Profit/loss from business: +$628 (reported on 17.7% of returns)
Here:
+$628
State:
+$9,571
(% of AGI for various income ranges: -1.5% for AGIs below $10k, 6.3% for AGIs $10k-25k, 1.4% for AGIs $25k-50k, 1.5% for AGIs $50k-75k, -4.1% for AGIs $75k-100k)
IRA payment deduction: $2,000 (reported on 2.3% of returns)
67149:
$2,000
Kansas:
$2,922
Total itemized deductions: $17,350 (22% of AGI, reported on 36.4% of returns)
Here:
$17,350
State:
$18,779
Here:
21.7% of AGI
State:
20.5% of AGI
(% of AGI for various income ranges: 16.0% for AGIs $10k-25k, 13.8% for AGIs $25k-50k, 13.1% for AGIs $50k-75k, 14.2% for AGIs $75k-100k, 14.8% for AGIs over 100k)
Charity contributions deductions: $3,151 (4% of AGI, reported on 31.3% of returns)
Here:
$3,151
State:
$3,892
Here:
3.8% of AGI
State:
4.0% of AGI
(% of AGI for various income ranges: 4.9% for AGIs below $10k, 2.2% for AGIs $25k-50k, 1.5% for AGIs $50k-75k, 2.3% for AGIs $75k-100k, 3.0% for AGIs over 100k)
Total tax: $6,256 (reported on 74.1% of returns)
67149:
$6,256
State:
$7,203
(% of AGI for various income ranges: 5.4% for AGIs below $10k, 3.9% for AGIs $10k-25k, 6.0% for AGIs $25k-50k, 8.3% for AGIs $50k-75k, 9.3% for AGIs $75k-100k, 16.6% for AGIs over 100k)
Earned income credit: $1,632 (reported on 7.8% of returns)
Here:
$1,632
State:
$1,674
Percentage of individuals using paid preparers for their 2004 taxes: 67.9%
Here:
68%
State:
63%
(% for various income ranges: 59.5% for AGIs below $10k, 70.7% for AGIs $10k-25k, 76.8% for AGIs $25k-50k, 66.7% for AGIs $50k-75k, 55.8% for AGIs $75k-100k, 81.0% for AGIs over 100k)
Notable locations in zip code 67149: Camp Hyde (A), Viola Wastewater Treatment Facility (B), Viola Township Library (C), Viola Fire Station 65 (D). Display/hide their locations on the map
Size of family households: 80 2-persons, 58 3-persons, 31 4-persons, 18 5-persons, 84 6-persons
Size of nonfamily households: 71 1-person, 65 2-persons
299 married couples with children.
0 single-parent households ().
96.1% of residents of 67149 zip code speak English at home.
4.2% of residents speak Spanish at home (100% very well).
Foreign born population: 101 (8.6%) (5.8% of them are naturalized citizens)
This zip code:
8.6%
Whole state:
7.1%
92%Honduras
5%France
32%American
18%German
16%Scottish
6%Irish
4%English
0%Italian
0%Swedish
Year of entry for the foreign-born population
522010 or later
02000 to 2009
01990 to 1999
44Before 1990
Facilities with environmental interests located in this zip code:
YOUNGER S & SONS MFG CO. INC. (19223 K42 HWY in VIOLA, KS)
STATE MASTER (Kansas Facility Profiler) - RTK-SG01127, EPCRA, WWT-C-AR37-NO05, WASTEWATER FACILITY National Pollutant Discharge Elimination System NON-MAJOR (Tracking pollutant discharge elimination systems) - permit Small Quantity Generators, between 100 kg and 1000 kg of hazardous waste/month (Resource Conservation and Recovery Act (tracking hazardous waste)) - notification Business SIC classification: INDUSTRIAL AND COMMERCIAL MACHINERY AND EQUIPMENT Organizations: WAYNE J YOUNGERS (CONTACT/OPERATOR)
, WAYNE J YOUNGERS (CONTACT/OWNER)
, YOUNGER'S & SONS MFG CO INC (CONTACT/OWNER)
, YOUNGERS & SONS MANUFACTURING CO (RTK PARENT ORGANIZATION)
Alternative names: YOUNGER'S & SONS MFG CO. INC
CLONMEL ESTATES MOBILE HOME PARK (6920 S 183RD ST W in VIOLA, KS)
STATE MASTER (Kansas Facility Profiler) - WWT-C-AR90-NO01, WASTEWATER FACILITY National Pollutant Discharge Elimination System NON-MAJOR (Tracking pollutant discharge elimination systems) - permit Business SIC classification: OPERATORS OF RESIDENTIAL MOBILE HOME SITES
CHARLIE KING SHOP (17720 W 55TH S in VIOLA, KS)
(Resource Conservation and Recovery Act (tracking hazardous waste))
VIOLA WASTE WATER TREATMENT FACILITY (NE/4, SEC 33, TOWNSHIP 29S, RA in VIOLA, KS)
National Pollutant Discharge Elimination System NON-MAJOR (Tracking pollutant discharge elimination systems) - permit Business SIC classification: SEWERAGE SYSTEMS Organizations: VIOLA, CITY OF (CONTACT/OWNER)
Alternative names: VIOLA WWTF
M & P AUTOMOTIVE (K42 & K49 JCT in VIOLA, KS)
(Resource Conservation and Recovery Act (tracking hazardous waste)) Organizations: MIKE CESSNA (CONTACT/OWNER)
BRIAN A COON (22730 WEST STATE ROAD 42 in VIOLA, KS)
National Pollutant Discharge Elimination System NON-MAJOR (Tracking pollutant discharge elimination systems) - permit Business SIC classification: ANIMAL SPECIALTIES Alternative names: COON, BRIAN A.
JERRY ZOGLMAN (19800 WEST 63RD STREET SOUTH in VIOLA, KS)
National Pollutant Discharge Elimination System NON-MAJOR (Tracking pollutant discharge elimination systems) - permit Business SIC classification: DAIRY FARMS Alternative names: ZOGLMAN, JERRY
JIM KLEIN (20400 WEST 55TH STREET SOUTH in VIOLA, KS)
National Pollutant Discharge Elimination System NON-MAJOR (Tracking pollutant discharge elimination systems) - permit Business SIC classification: DAIRY FARMS Alternative names: KLEIN, JIM
C & S IND INC (7420 S 199TH W (A) in VIOLA, KS)
Conditionally Exempt Small Quantity Generators, less than 100 kg/month of hazardous waste (Resource Conservation and Recovery Act (tracking hazardous waste)) - notification Organizations: HERBERT CHAMBERS (CONTACT/OWNER)
MCCONNELL (EX) TITAN II -13 (3 MILES W OF VIOLA STATE HWY 42 in VIOLA, KS)
SUPERFUND (Superfund database)
48.1%Electricity
38.8%Bottled, tank, or LP gas
8.0%Utility gas
5.7%Other fuel
Population in 1990: 1,330.
Place of birth for U.S.-born residents:
This state: 875
Northeast: 39
Midwest: 17
South: 139
West: 11
69% of the 67149 zip code residents lived in the same house 5 years ago. Out of people who lived in different houses, 75% lived in this county. Out of people who lived in different counties, 50% lived in Kansas.
99% of the 67149 zip code residents lived in the same house 1 year ago. Out of people who lived in different houses, 200% moved from this county.
Private vs. public school enrollment:
Students in private schools in grades 1 to 8 (elementary and middle school):
Here:
0.0%
Kansas:
14.1%
Students in private schools in grades 9 to 12 (high school):
Here:
0.0%
Kansas:
10.8%
Students in private undergraduate colleges: 30
Here:
84.8%
Kansas:
15.4%
Occupation by median earnings in the past 12 months ($)
109,061Management occupations
74,969Installation, maintenance, and repair occupations
74,070Production occupations
48,613Construction and extraction occupations
44,575Business and financial operations occupations
38,929Office and administrative support occupations
Companies with federal contracts located in this zip code:
MEADOWS, KASSIA (21321 W 55TH SOUTH in VIOLA, KS; small business) : $17,105 in 2 contractsin 2003
$22,076 with Navy for Nursing Services. Signed on 2003-06-13. Completion date: 2003-09-30.
-$4,971, same as above.Signed on 2003-06-13. Completion date: 2003-09-30.
Top industries in this zip code by the number of employees in 2005:
Wholesale Trade: Grain and Field Bean Merchant Wholesalers (10-19 employees: 1 establishment)
Construction: Poured Concrete Foundation and Structure Contractors (5-9: 1)
Construction: Electrical Contractors (5-9: 1)
Construction: New Single-Family Housing Construction (except Operative Builders) (1-4: 2)
Real Estate and Rental and Leasing: Other Commercial and Industrial Machinery and Equipment Rental and Leasing (1-4: 1)
Administrative and Support and Waste Management and Remediation Services: Security Systems Services (except Locksmiths) (1-4: 1)
Fatal accident statistics in 2014:
Fatal accident count: 1
Vehicles involved in fatal accidents: 1
Fatal accidents caused by drunken drivers: 0
Fatalities: 1
Persons involved in fatal accidents: 3
Pedestrians involved in fatal accidents: 0
Fatal accident statistics in 2012:
Fatal accident count: 1
Vehicles involved in fatal accidents: 1
Fatal accidents caused by drunken drivers: 0
Fatalities: 1
Persons involved in fatal accidents: 1
Pedestrians involved in fatal accidents: 0
Home Mortgage Disclosure Act Aggregated Statistics For Year 2009 (Based on 4 partial tracts)
A) FHA, FSA/RHS & VA Home Purchase Loans
B) Conventional Home Purchase Loans
C) Refinancings
D) Home Improvement Loans
E) Loans on Dwellings For 5+ Families
F) Non-occupant Loans on < 5 Family Dwellings (A B C & D)
G) Loans On Manufactured Home Dwelling (A B C & D)
Number
Average Value
Number
Average Value
Number
Average Value
Number
Average Value
Number
Average Value
Number
Average Value
Number
Average Value
LOANS ORIGINATED
43
$119,864
34
$104,152
175
$116,495
16
$26,579
1
$69,270
17
$48,051
12
$34,962
APPLICATIONS APPROVED, NOT ACCEPTED
2
$120,620
2
$166,205
9
$139,003
2
$67,355
0
$0
0
$0
0
$0
APPLICATIONS DENIED
4
$112,718
6
$83,792
48
$130,909
5
$24,580
0
$0
0
$0
5
$68,366
APPLICATIONS WITHDRAWN
4
$121,110
3
$117,280
38
$136,228
2
$58,830
0
$0
0
$0
1
$118,580
FILES CLOSED FOR INCOMPLETENESS
1
$37,940
1
$56,920
7
$134,760
0
$0
0
$0
0
$0
1
$73,360
Aggregated Statistics For Year 2008 (Based on 4 partial tracts)
A) FHA, FSA/RHS & VA Home Purchase Loans
B) Conventional Home Purchase Loans
C) Refinancings
D) Home Improvement Loans
E) Loans on Dwellings For 5+ Families
F) Non-occupant Loans on < 5 Family Dwellings (A B C & D)
G) Loans On Manufactured Home Dwelling (A B C & D)
Number
Average Value
Number
Average Value
Number
Average Value
Number
Average Value
Number
Average Value
Number
Average Value
Number
Average Value
LOANS ORIGINATED
44
$116,143
86
$112,225
95
$112,365
28
$29,639
1
$133,440
17
$67,864
13
$60,621
APPLICATIONS APPROVED, NOT ACCEPTED
1
$136,440
4
$71,718
10
$129,426
4
$16,458
0
$0
1
$27,830
2
$61,290
APPLICATIONS DENIED
8
$118,896
12
$72,391
38
$126,279
14
$50,059
0
$0
1
$105,030
3
$71,890
APPLICATIONS WITHDRAWN
2
$123,510
5
$143,478
21
$145,206
2
$127,665
0
$0
1
$12,650
0
$0
FILES CLOSED FOR INCOMPLETENESS
2
$100,235
1
$61,600
4
$116,818
2
$28,030
0
$0
0
$0
1
$71,460
Aggregated Statistics For Year 2007 (Based on 4 partial tracts)
A) FHA, FSA/RHS & VA Home Purchase Loans
B) Conventional Home Purchase Loans
C) Refinancings
D) Home Improvement Loans
E) Loans on Dwellings For 5+ Families
F) Non-occupant Loans on < 5 Family Dwellings (A B C & D)
G) Loans On Manufactured Home Dwelling (A B C & D)
Number
Average Value
Number
Average Value
Number
Average Value
Number
Average Value
Number
Average Value
Number
Average Value
Number
Average Value
LOANS ORIGINATED
30
$115,915
111
$110,268
81
$104,941
25
$30,144
1
$87,270
13
$56,342
13
$55,802
APPLICATIONS APPROVED, NOT ACCEPTED
1
$138,910
10
$105,921
20
$121,380
3
$21,497
0
$0
0
$0
1
$85,930
APPLICATIONS DENIED
4
$102,058
13
$102,186
55
$102,415
21
$56,009
0
$0
2
$73,590
5
$53,056
APPLICATIONS WITHDRAWN
2
$92,555
7
$124,456
19
$126,912
5
$76,064
0
$0
1
$67,760
1
$47,740
FILES CLOSED FOR INCOMPLETENESS
0
$0
1
$72,690
7
$125,251
1
$6,780
0
$0
0
$0
0
$0
Aggregated Statistics For Year 2006 (Based on 4 partial tracts)
A) FHA, FSA/RHS & VA Home Purchase Loans
B) Conventional Home Purchase Loans
C) Refinancings
D) Home Improvement Loans
E) Loans on Dwellings For 5+ Families
F) Non-occupant Loans on < 5 Family Dwellings (A B C & D)
G) Loans On Manufactured Home Dwelling (A B C & D)
Number
Average Value
Number
Average Value
Number
Average Value
Number
Average Value
Number
Average Value
Number
Average Value
Number
Average Value
LOANS ORIGINATED
23
$114,852
114
$94,403
92
$86,948
26
$33,933
0
$0
20
$56,875
9
$52,221
APPLICATIONS APPROVED, NOT ACCEPTED
1
$108,720
8
$68,635
13
$105,169
2
$54,600
0
$0
1
$53,520
4
$59,075
APPLICATIONS DENIED
0
$0
22
$93,977
57
$106,490
18
$47,182
1
$23,100
2
$38,680
7
$52,563
APPLICATIONS WITHDRAWN
1
$86,640
8
$86,428
32
$99,138
5
$63,722
0
$0
1
$60,460
1
$98,870
FILES CLOSED FOR INCOMPLETENESS
0
$0
1
$112,420
11
$114,678
1
$3,160
0
$0
1
$25,300
0
$0
Aggregated Statistics For Year 2005 (Based on 4 partial tracts)
A) FHA, FSA/RHS & VA Home Purchase Loans
B) Conventional Home Purchase Loans
C) Refinancings
D) Home Improvement Loans
E) Loans on Dwellings For 5+ Families
F) Non-occupant Loans on < 5 Family Dwellings (A B C & D)
G) Loans On Manufactured Home Dwelling (A B C & D)
Number
Average Value
Number
Average Value
Number
Average Value
Number
Average Value
Number
Average Value
Number
Average Value
Number
Average Value
LOANS ORIGINATED
20
$110,624
100
$87,084
98
$98,533
28
$44,061
1
$1,094,800
10
$53,237
8
$63,705
APPLICATIONS APPROVED, NOT ACCEPTED
1
$129,360
17
$87,164
20
$107,436
1
$30,490
0
$0
1
$87,400
2
$72,860
APPLICATIONS DENIED
3
$93,027
21
$63,470
70
$105,313
15
$30,492
0
$0
2
$102,190
11
$59,274
APPLICATIONS WITHDRAWN
1
$113,200
11
$79,200
44
$114,989
6
$116,663
0
$0
1
$72,690
2
$90,265
FILES CLOSED FOR INCOMPLETENESS
0
$0
4
$69,195
7
$122,771
1
$12,650
0
$0
0
$0
0
$0
Aggregated Statistics For Year 2004 (Based on 4 partial tracts)
A) FHA, FSA/RHS & VA Home Purchase Loans
B) Conventional Home Purchase Loans
C) Refinancings
D) Home Improvement Loans
F) Non-occupant Loans on < 5 Family Dwellings (A B C & D)
G) Loans On Manufactured Home Dwelling (A B C & D)
Number
Average Value
Number
Average Value
Number
Average Value
Number
Average Value
Number
Average Value
Number
Average Value
LOANS ORIGINATED
23
$104,761
76
$92,688
124
$99,735
24
$29,607
13
$62,015
7
$53,527
APPLICATIONS APPROVED, NOT ACCEPTED
2
$83,785
8
$104,390
18
$101,383
2
$15,710
1
$56,670
4
$67,830
APPLICATIONS DENIED
1
$95,480
20
$80,568
76
$95,213
12
$33,003
1
$32,880
13
$40,612
APPLICATIONS WITHDRAWN
2
$99,740
4
$119,618
39
$106,900
4
$76,008
1
$80,590
1
$131,540
FILES CLOSED FOR INCOMPLETENESS
0
$0
1
$113,960
14
$109,910
0
$0
0
$0
0
$0
Aggregated Statistics For Year 2003 (Based on 4 partial tracts)
A) FHA, FSA/RHS & VA Home Purchase Loans
B) Conventional Home Purchase Loans
C) Refinancings
D) Home Improvement Loans
F) Non-occupant Loans on < 5 Family Dwellings (A B C & D)
Number
Average Value
Number
Average Value
Number
Average Value
Number
Average Value
Number
Average Value
LOANS ORIGINATED
18
$96,663
58
$90,198
273
$95,304
24
$18,482
16
$55,674
APPLICATIONS APPROVED, NOT ACCEPTED
0
$0
5
$95,604
26
$105,729
2
$12,540
1
$36,340
APPLICATIONS DENIED
2
$72,330
14
$71,978
76
$92,040
11
$21,739
2
$93,450
APPLICATIONS WITHDRAWN
1
$103,490
11
$97,166
50
$97,527
2
$27,720
2
$47,940
FILES CLOSED FOR INCOMPLETENESS
1
$73,000
2
$134,275
11
$93,546
0
$0
0
$0
Aggregated Statistics For Year 2002 (Based on 4 partial tracts)
A) FHA, FSA/RHS & VA Home Purchase Loans
B) Conventional Home Purchase Loans
C) Refinancings
D) Home Improvement Loans
F) Non-occupant Loans on < 5 Family Dwellings (A B C & D)
Number
Average Value
Number
Average Value
Number
Average Value
Number
Average Value
Number
Average Value
LOANS ORIGINATED
24
$92,574
72
$83,697
168
$96,587
22
$19,040
12
$43,892
APPLICATIONS APPROVED, NOT ACCEPTED
1
$93,320
11
$62,007
21
$84,058
3
$36,290
1
$62,830
APPLICATIONS DENIED
1
$125,310
12
$58,302
50
$88,529
8
$30,726
2
$58,430
APPLICATIONS WITHDRAWN
0
$0
5
$77,608
21
$90,268
3
$16,370
0
$0
FILES CLOSED FOR INCOMPLETENESS
0
$0
1
$54,210
7
$102,533
0
$0
0
$0
Aggregated Statistics For Year 2001 (Based on 4 partial tracts)
A) FHA, FSA/RHS & VA Home Purchase Loans
B) Conventional Home Purchase Loans
C) Refinancings
D) Home Improvement Loans
F) Non-occupant Loans on < 5 Family Dwellings (A B C & D)
Number
Average Value
Number
Average Value
Number
Average Value
Number
Average Value
Number
Average Value
LOANS ORIGINATED
27
$94,847
61
$86,895
164
$147,873
40
$18,678
12
$71,047
APPLICATIONS APPROVED, NOT ACCEPTED
2
$72,535
7
$86,764
13
$76,674
5
$14,984
0
$0
APPLICATIONS DENIED
0
$0
14
$55,064
52
$74,308
13
$12,682
0
$0
APPLICATIONS WITHDRAWN
2
$70,190
5
$136,810
40
$95,378
4
$28,352
2
$65,605
FILES CLOSED FOR INCOMPLETENESS
0
$0
1
$86,550
7
$99,496
0
$0
1
$79,050
Aggregated Statistics For Year 2000 (Based on 4 partial tracts)
A) FHA, FSA/RHS & VA Home Purchase Loans
B) Conventional Home Purchase Loans
C) Refinancings
D) Home Improvement Loans
F) Non-occupant Loans on < 5 Family Dwellings (A B C & D)
Number
Average Value
Number
Average Value
Number
Average Value
Number
Average Value
Number
Average Value
LOANS ORIGINATED
18
$87,669
63
$77,986
59
$74,515
30
$17,162
15
$35,498
APPLICATIONS APPROVED, NOT ACCEPTED
1
$87,470
8
$67,421
10
$75,573
4
$21,475
1
$26,880
APPLICATIONS DENIED
1
$36,340
22
$60,855
33
$69,758
13
$17,482
1
$97,170
APPLICATIONS WITHDRAWN
1
$26,560
6
$68,310
22
$75,608
2
$24,845
1
$61,290
FILES CLOSED FOR INCOMPLETENESS
0
$0
2
$147,460
3
$47,553
0
$0
0
$0
Aggregated Statistics For Year 1999 (Based on 2 partial tracts)
A) FHA, FSA/RHS & VA Home Purchase Loans
B) Conventional Home Purchase Loans
C) Refinancings
D) Home Improvement Loans
F) Non-occupant Loans on < 5 Family Dwellings (A B C & D)
Detailed PMIC statistics for the following Tracts:0096.00
, 0107.00
2002 - 2018 National Fire Incident Reporting System (NFIRS) incidents
Based on the data from the years 2002 - 2018 the average number of fires per year is 11. The highest number of reported fires - 19 took place in 2014, and the least - 6 in 2004. The data has a dropping trend.
When looking into fire subcategories, the most incidents belonged to: Outside Fires (69.6%), and Structure Fires (18.2%).
Fire incident types reported to NFIRS in Zip Code 67149


 Nearest zip codes: 67052, 67026, 67031, 67050, 67106, 67227.


 Based on the data from the years 2002 - 2018 the average number of fires per year is 11. The highest number of reported fires - 19 took place in 2014, and the least - 6 in 2004. The data has a dropping trend.
 When looking into fire subcategories, the most incidents belonged to: Outside Fires (69.6%), and Structure Fires (18.2%).