Estimated zip code population in 2022: 22,942 Zip code population in 2010: 23,344 Zip code population in 2000: 23,816
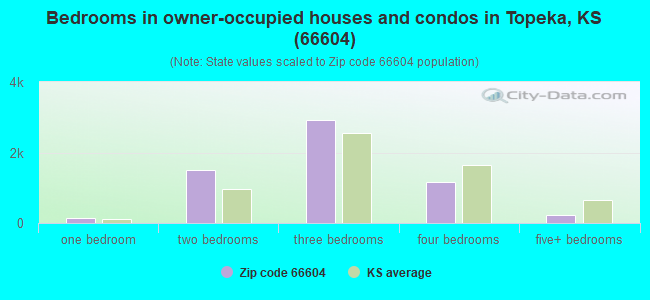
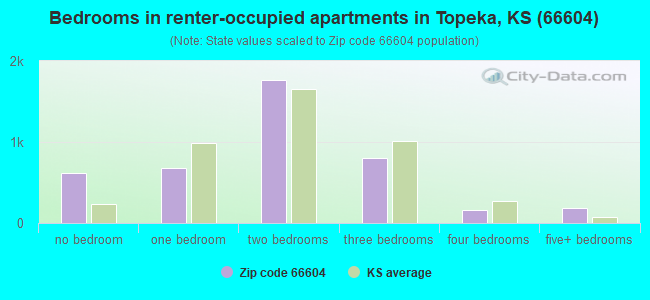
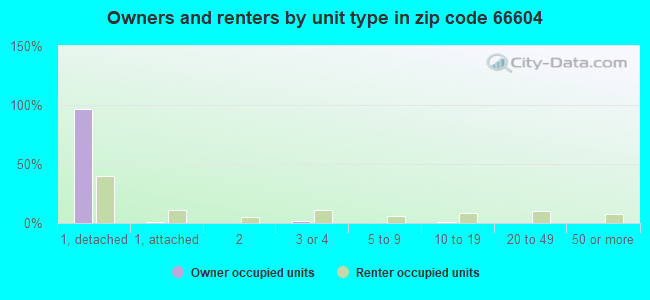
Houses and condos: 11,088 Renter-occupied apartments: 4,213
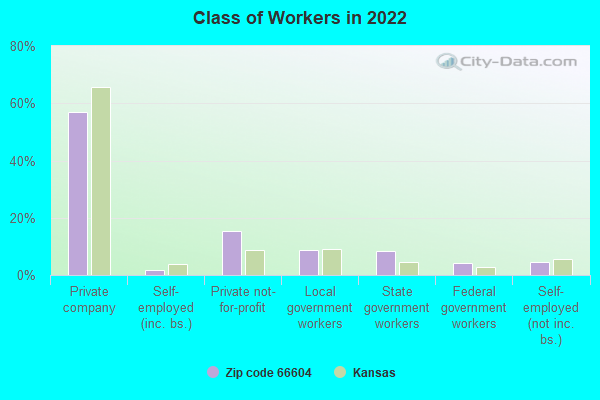
% of renters here:
41%
State:
32%
March 2022 cost of living index in zip code 66604: 81.2 (low, U.S. average is 100)
Land area: 6.6 sq. mi. Water area: 0.0 sq. mi.
Population density: 3,467 people per square mile
(average).
OSM Map
General Map
Google Map
MSN Map
OSM Map
General Map
Google Map
MSN Map
OSM Map
General Map
Google Map
MSN Map
OSM Map
General Map
Google Map
MSN Map
Please wait while loading the map...
Real estate property taxes paid for housing units in 2022:
This zip code:
1.5% ($1,926)
Kansas:
1.2% ($2,578)
Median real estate property taxes paid for housing units with mortgages in 2022: $1,924 (1.4%) Median real estate property taxes paid for housing units with no mortgage in 2022: $1,928 (1.6%)
Estimated median house/condo value in 2022: $129,330
66604:
$129,330
Kansas:
$206,600
According to our research of Kansas and other state lists, there were 98 registered sex offenders living in 66604 zip code as of July 03, 2024. The ratio of all residents to sex offenders in zip code 66604 is 236 to 1. The ratio of registered sex offenders to all residents in this zip code is near the state average.
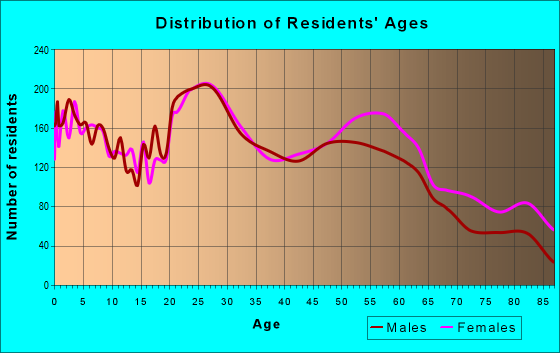
Median resident age:
This zip code:
39.6 years
Kansas median age:
37.6 years
Average household size:
This zip code:
2.2 people
Kansas:
2.4 people
Averages for the 2020 tax year for zip code 66604, filed in 2021:
Average Adjusted Gross Income (AGI) in 2020: $50,438 (Individual Income Tax Returns)
Here:
$50,438
State:
$72,721
Salary/wage: $43,262 (reported on 81.4% of returns)
Here:
$43,262
State:
$58,641
(% of AGI for various income ranges: 1145.5% for AGIs below $25k, 3809.2% for AGIs $25k-50k, 6520.7% for AGIs $50k-75k, 9723.9% for AGIs $75k-100k, 16756.1% for AGIs $100k-200k, 71021.7% for AGIs over 200k)
Taxable interest for individuals: $1,309 (reported on 28.4% of returns)
This zip code:
$1,309
Kansas:
$1,625
(% of AGI for various income ranges: 16.0% for AGIs below $25k, 18.4% for AGIs $25k-50k, 50.5% for AGIs $50k-75k, 102.1% for AGIs $75k-100k, 186.5% for AGIs $100k-200k, 1823.3% for AGIs over 200k)
Ordinary dividends: $6,659 (reported on 15.9% of returns)
Here:
$6,659
State:
$7,290
(% of AGI for various income ranges: 19.7% for AGIs below $25k, 26.9% for AGIs $25k-50k, 82.2% for AGIs $50k-75k, 197.5% for AGIs $75k-100k, 493.1% for AGIs $100k-200k, 10148.3% for AGIs over 200k)
Net capital gain/loss in AGI: +$11,113 (reported on 13.5% of returns)
Here:
+$11,113
State:
+$20,511
(% of AGI for various income ranges: 7.1% for AGIs below $25k, 22.3% for AGIs $25k-50k, 82.3% for AGIs $50k-75k, 184.9% for AGIs $75k-100k, 741.8% for AGIs $100k-200k, 17513.3% for AGIs over 200k)
Profit/loss from business: +$11,619 (reported on 9.8% of returns)
Here:
+$11,619
State:
+$13,852
(% of AGI for various income ranges: 57.4% for AGIs below $25k, 54.1% for AGIs $25k-50k, 108.3% for AGIs $50k-75k, 230.2% for AGIs $75k-100k, 792.7% for AGIs $100k-200k, 5320.0% for AGIs over 200k)
Taxable individual retirement arrangement distribution: $16,322 (reported on 10.1% of returns)
66604:
$16,322
Kansas:
$19,921
(% of AGI for various income ranges: 58.2% for AGIs below $25k, 83.3% for AGIs $25k-50k, 225.2% for AGIs $50k-75k, 413.8% for AGIs $75k-100k, 1073.1% for AGIs $100k-200k, 6981.7% for AGIs over 200k)
Self-employed (Keogh) retirement plans: $16,525 (reported on 0.4% of returns)
66604:
$16,525
Kansas:
$25,388
(% of AGI for various income ranges: 134.9% for AGIs $100k-200k)
Total itemized deductions: $35,258 (reported on 3.9% of returns)
Here:
$35,258
State:
$36,939
(% of AGI for various income ranges: 38.0% for AGIs below $25k, 62.2% for AGIs $25k-50k, 152.3% for AGIs $50k-75k, 355.1% for AGIs $75k-100k, 803.9% for AGIs $100k-200k, 8413.3% for AGIs over 200k)
Charity contributions: $15,905 (reported on 3.2% of returns)
Here:
$15,905
State:
$15,443
(% of AGI for various income ranges: 1.6% for AGIs below $25k, 10.8% for AGIs $25k-50k, 33.7% for AGIs $50k-75k, 109.0% for AGIs $75k-100k, 272.7% for AGIs $100k-200k, 5211.7% for AGIs over 200k)
Taxes paid: $6,413 (reported on 3.9% of returns)
66604:
$6,413
State:
$8,001
(% of AGI for various income ranges: 2.2% for AGIs below $25k, 6.7% for AGIs $25k-50k, 24.9% for AGIs $50k-75k, 83.1% for AGIs $75k-100k, 195.3% for AGIs $100k-200k, 1443.3% for AGIs over 200k)
Earned income credit: $2,022 (reported on 18.7% of returns)
Here:
$2,022
State:
$2,267
(% of AGI for various income ranges: 88.4% for AGIs below $25k, 61.3% for AGIs $25k-50k, 1.0% for AGIs $50k-75k)
Percentage of individuals using paid preparers for their 2020 taxes: 94.6%
Here:
95%
State:
95%
(% for various income ranges: 93.9% for AGIs below $25k, 95.3% for AGIs $25k-50k, 94.5% for AGIs $50k-75k, 94.7% for AGIs $75k-100k, 94.6% for AGIs $100k-200k, 95.5% for AGIs over 200k)
Averages for the 2012 tax year for zip code 66604, filed in 2013:
Average Adjusted Gross Income (AGI) in 2012: $46,282 (Individual Income Tax Returns)
Here:
$46,282
State:
$60,095
Salary/wage: $38,102 (reported on 81.9% of returns)
Here:
$38,102
State:
$48,770
(% of AGI for various income ranges: 73.6% for AGIs below $25k, 81.4% for AGIs $25k-50k, 75.9% for AGIs $50k-75k, 74.8% for AGIs $75k-100k, 65.6% for AGIs $100k-200k, 36.2% for AGIs over 200k)
Taxable interest for individuals: $1,399 (reported on 31.6% of returns)
This zip code:
$1,399
Kansas:
$1,506
(% of AGI for various income ranges: 1.4% for AGIs below $25k, 0.6% for AGIs $25k-50k, 0.9% for AGIs $50k-75k, 0.8% for AGIs $75k-100k, 1.0% for AGIs $100k-200k, 1.3% for AGIs over 200k)
Ordinary dividends: $6,028 (reported on 18.1% of returns)
Here:
$6,028
State:
$6,093
(% of AGI for various income ranges: 1.6% for AGIs below $25k, 0.9% for AGIs $25k-50k, 1.1% for AGIs $50k-75k, 1.6% for AGIs $75k-100k, 2.6% for AGIs $100k-200k, 6.1% for AGIs over 200k)
Net capital gain/loss in AGI: +$6,920 (reported on 13.0% of returns)
Here:
+$6,920
State:
+$14,598
(% of AGI for various income ranges: 0.2% for AGIs $25k-50k, 0.4% for AGIs $50k-75k, 1.1% for AGIs $75k-100k, 2.2% for AGIs $100k-200k, 7.0% for AGIs over 200k)
Profit/loss from business: +$9,510 (reported on 11.1% of returns)
Here:
+$9,510
State:
+$12,554
(% of AGI for various income ranges: 3.8% for AGIs below $25k, 1.3% for AGIs $25k-50k, 2.0% for AGIs $50k-75k, 1.9% for AGIs $75k-100k, 2.8% for AGIs $100k-200k, 2.6% for AGIs over 200k)
Taxable individual retirement arrangement distribution: $12,031 (reported on 11.7% of returns)
66604:
$12,031
Kansas:
$14,098
(% of AGI for various income ranges: 3.1% for AGIs below $25k, 2.1% for AGIs $25k-50k, 2.7% for AGIs $50k-75k, 3.0% for AGIs $75k-100k, 4.8% for AGIs $100k-200k, 3.0% for AGIs over 200k)
Self-employment retirement plans: $11,260 (reported on 0.4% of returns)
66604:
$11,260
Kansas:
$19,780
Total itemized deductions: $19,797 (20% of AGI, reported on 24.8% of returns)
Here:
$19,797
State:
$23,678
Here:
20.4% of AGI
State:
18.9% of AGI
(% of AGI for various income ranges: 10.2% for AGIs below $25k, 7.8% for AGIs $25k-50k, 9.0% for AGIs $50k-75k, 10.7% for AGIs $75k-100k, 13.1% for AGIs $100k-200k, 13.5% for AGIs over 200k)
Charity contributions: $4,287 (reported on 19.9% of returns)
Here:
$4,287
State:
$5,321
(% of AGI for various income ranges: 0.9% for AGIs below $25k, 0.9% for AGIs $25k-50k, 1.5% for AGIs $50k-75k, 1.8% for AGIs $75k-100k, 3.3% for AGIs $100k-200k, 2.7% for AGIs over 200k)
Taxes paid: $7,327 (reported on 24.7% of returns)
66604:
$7,327
State:
$9,548
(% of AGI for various income ranges: 1.6% for AGIs below $25k, 2.4% for AGIs $25k-50k, 3.0% for AGIs $50k-75k, 3.8% for AGIs $75k-100k, 5.7% for AGIs $100k-200k, 6.5% for AGIs over 200k)
Earned income credit: $1,976 (reported on 20.4% of returns)
Here:
$1,976
State:
$2,212
(% of AGI for various income ranges: 5.9% for AGIs below $25k, 0.9% for AGIs $25k-50k)
Percentage of individuals using paid preparers for their 2012 taxes: 45.6%
Here:
46%
State:
56%
(% for various income ranges: 40.9% for AGIs below $25k, 43.3% for AGIs $25k-50k, 50.6% for AGIs $50k-75k, 54.1% for AGIs $75k-100k, 60.3% for AGIs $100k-200k, 87.5% for AGIs over 200k)
Averages for the 2004 tax year for zip code 66604, filed in 2005:
Average Adjusted Gross Income (AGI) in 2004: $38,619 (Individual Income Tax Returns)
Here:
$38,619
State:
$45,726
Salary/wage: $34,867 (reported on 82.8% of returns)
Here:
$34,867
State:
$40,112
(% of AGI for various income ranges: 107.1% for AGIs below $10k, 73.0% for AGIs $10k-25k, 81.0% for AGIs $25k-50k, 78.6% for AGIs $50k-75k, 77.0% for AGIs $75k-100k, 62.2% for AGIs over 100k)
Taxable interest for individuals: $1,922 (reported on 42.2% of returns)
This zip code:
$1,922
Kansas:
$1,749
(% of AGI for various income ranges: 7.0% for AGIs below $10k, 3.3% for AGIs $10k-25k, 1.8% for AGIs $25k-50k, 1.8% for AGIs $50k-75k, 1.5% for AGIs $75k-100k, 2.0% for AGIs over 100k)
Taxable dividends: $4,423 (reported on 22.3% of returns)
Here:
$4,423
State:
$3,066
(% of AGI for various income ranges: 3.7% for AGIs below $10k, 1.4% for AGIs $10k-25k, 0.9% for AGIs $25k-50k, 1.4% for AGIs $50k-75k, 1.7% for AGIs $75k-100k, 6.1% for AGIs over 100k)
Net capital gain/loss: +$4,194 (reported on 16.7% of returns)
Here:
+$4,194
State:
+$7,555
(% of AGI for various income ranges: -0.8% for AGIs below $10k, -0.0% for AGIs $10k-25k, 0.3% for AGIs $25k-50k, 0.8% for AGIs $50k-75k, 1.4% for AGIs $75k-100k, 5.6% for AGIs over 100k)
Profit/loss from business: +$8,981 (reported on 11.6% of returns)
Here:
+$8,981
State:
+$9,571
(% of AGI for various income ranges: 2.3% for AGIs below $10k, 2.5% for AGIs $10k-25k, 1.7% for AGIs $25k-50k, 2.0% for AGIs $50k-75k, 2.2% for AGIs $75k-100k, 4.8% for AGIs over 100k)
IRA payment deduction: $2,495 (reported on 1.9% of returns)
66604:
$2,495
Kansas:
$2,922
(% of AGI for various income ranges: 0.1% for AGIs $10k-25k, 0.2% for AGIs $25k-50k, 0.1% for AGIs $50k-75k, 0.1% for AGIs $75k-100k, 0.0% for AGIs over 100k)
Self-employed pension: $11,918 (reported on 0.5% of returns)
Here:
$11,918
Kansas:
$14,209
(% of AGI for various income ranges: 0.1% for AGIs $50k-75k, 0.2% for AGIs $75k-100k, 0.5% for AGIs over 100k)
Total itemized deductions: $16,021 (21% of AGI, reported on 28.1% of returns)
Here:
$16,021
State:
$18,779
Here:
21.4% of AGI
State:
20.5% of AGI
(% of AGI for various income ranges: 15.3% for AGIs below $10k, 8.5% for AGIs $10k-25k, 9.7% for AGIs $25k-50k, 11.4% for AGIs $50k-75k, 13.1% for AGIs $75k-100k, 14.3% for AGIs over 100k)
Charity contributions deductions: $3,452 (4% of AGI, reported on 24.2% of returns)
Here:
$3,452
State:
$3,892
Here:
4.3% of AGI
State:
4.0% of AGI
(% of AGI for various income ranges: 0.8% for AGIs below $10k, 1.2% for AGIs $10k-25k, 1.4% for AGIs $25k-50k, 2.1% for AGIs $50k-75k, 2.5% for AGIs $75k-100k, 3.4% for AGIs over 100k)
Total tax: $5,780 (reported on 72.9% of returns)
66604:
$5,780
State:
$7,203
(% of AGI for various income ranges: 1.8% for AGIs below $10k, 4.0% for AGIs $10k-25k, 7.2% for AGIs $25k-50k, 9.4% for AGIs $50k-75k, 10.8% for AGIs $75k-100k, 20.1% for AGIs over 100k)
Earned income credit: $1,516 (reported on 17.2% of returns)
Here:
$1,516
State:
$1,674
Percentage of individuals using paid preparers for their 2004 taxes: 58.5%
Here:
58%
State:
63%
(% for various income ranges: 54.9% for AGIs below $10k, 61.4% for AGIs $10k-25k, 56.9% for AGIs $25k-50k, 58.6% for AGIs $50k-75k, 56.4% for AGIs $75k-100k, 70.1% for AGIs over 100k)
Likely homosexual households (counted as self-reported same-sex unmarried-partner households)
Lesbian couples: 0.4% of all households
Gay men: 0.2% of all households
Household received Food Stamps/SNAP in the past 12 months: 1,218 Household did not receive Food Stamps/SNAP in the past 12 months: 9,004
Women who had a birth in the past 12 months: 382 (213 now married, 167 unmarried) Women who did not have a birth in the past 12 months: 4,582 (1,802 now married, 2,783 unmarried)
Housing units in zip code 66604 with a mortgage: 3,558 (174 second mortgage, 6 home equity loan, 157 both second mortgage and home equity loan) Houses without a mortgage: 129
Median monthly owner costs for units with a mortgage: $1,161 Median monthly owner costs for units without a mortgage: $498
Residents with income below the poverty level in 2022:
This zip code:
17.1%
Whole state:
12.0%
Residents with income below 50% of the poverty level in 2022:
This zip code:
11.0%
Whole state:
6.4%
Median number of rooms in houses and condos:
Here:
6.6
State:
6.9
Median number of rooms in apartments:
Here:
4.3
State:
4.4
Notable locations in this zip code not listed on our city pages
Notable locations in zip code 66604: Corporate Hill (A), Elmhurst Plaza (B), Kansas Neurological Institute (C), Kansas Neurological Institute Wheatland Rehabilitation Center (D), Central Community Center - Community Police Office (E), Kansas Neurological Institute Sunflower Lodge (F), Kansas Neurological Institute Pleasantview Building (G), Kansas Neurological Institute Meadowlark Lodge (H), Kansas Neurological Institute Honeybee Lodge (I), Kansas Neurological Institute Flinthills Lodge (J), Kansas Neurological Institute Cottonwood Lodge (K), Topeka Fire Department Station 7 (L), Plaza West Regional Health Center Nursing Home (M), Central Park Community Center (N), United Methodist Home Assisted Living Facility (O), Topeka and Shawnee County Public Library (P), Alice C Sabatini Gallery (Q), Lexington Park Nursing and Post Acute Care Center (R), Lexington Park Assisted Living Facility (S), Homestead Assisted Living Facility (T). Display/hide their locations on the map
Churches in zip code 66604 include: Topeka Reformed Latter Day Saints Central Church (A), Allegheny Wesleyan Methodist Church (B), Central Church of Christ (C), Central Park Christian Church (D), Central United Presbyterian Church (E), Emmanuel Church (F), Fairlawn Heights Wesleyan Church (G), Faith Lutheran Church (H), First Christian Church (I). Display/hide their locations on the map
Parks in zip code 66604 include: Central Park (1), Chesney Park (2), Westboro Park (3), Sims Park (4), Theodore Granville Barcus Wildlife Area (5), Hillsdale Park (6), Washburn Park (7), Collins Parkway (8). Display/hide their locations on the map
2,653 married couples with children.
1,655 single-parent households (595 men, 1,060 women).
93.5% of residents of 66604 zip code speak English at home.
4.4% of residents speak Spanish at home (73% very well, 9% well, 12% not well, 7% not at all).
0.8% of residents speak other Indo-European language at home (55% very well, 9% well, 36% not well).
1.3% of residents speak Asian or Pacific Island language at home (73% very well, 27% well).
0.2% of residents speak other language at home (100% very well).
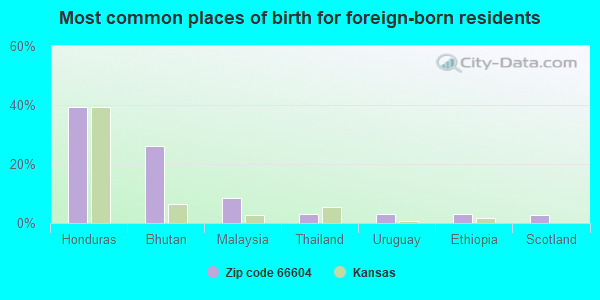
Foreign born population: 784 (3.4%) (35.3% of them are naturalized citizens)
Major facilities with environmental interests located in this zip code:
TOPEKA TRUCK PLAZA INC (1235 SOUTHWEST WANAMAKER ROAD in TOPEKA, KS)
(Integrated Compliance Information System) - ICIS-07-1997-0254, FORMAL ENFORCEMENT ACTION STATE MASTER (Kansas Facility Profiler) - TANKS-02582, UNDERGROUND STORAGE TANK PROGRAM USED OIL PROGRAM (Resource Conservation and Recovery Act (tracking hazardous waste)) (Resource Conservation and Recovery Act (tracking hazardous waste)) Organizations: RICK REUST (CONTACT/OPERATOR)
, CORPORATION (CONTACT/OWNER)
, TOPEKA TRAVEL PLAZA INC (CONTACT/OWNER)
Alternative names: TOPEKA TRAVEL PLAZA, TOPEKA TRUCK PLZ INC, TOPEKA TRUCK PLZ INC
LIVINGSTONS INC (5240 SW 17TH in TOPEKA, KS)
AIR MINOR (AIRS/AFS) STATE MASTER (Kansas Facility Profiler) - DRYCLEAN-0209, DRYCLEAN-0345 Conditionally Exempt Small Quantity Generators, less than 100 kg/month of hazardous waste (Resource Conservation and Recovery Act (tracking hazardous waste)) - notification Business SIC classification: DRYCLEANING PLANTS, EXCEPT RUG CLEANING Organizations: SHAFERS, INC., LIVINGSTONS TUXEDO & BRIDAL GALLEY (CONTACT/OPERATOR)
, HILLSDALE LLC---DON BARRY (CONTACT/OWNER)
, HILLSDALE SHOPPING CTR (CONTACT/OWNER)
, HILSDALE SHOPPING CTR. (CONTACT/OWNER)
Alternative names: LIVINGSTONS TUXEDO & BRIDAL GALLERY
USD #501 - TOPEKA WEST HIGH SC (2001 SW FAIRLAWN RD in TOPEKA, KS)
STATE MASTER (Kansas Facility Profiler) - TANKS-09209, UNDERGROUND STORAGE TANK PROGRAM (National Center for Education Statistics) - STATE ID-8540 Organizations: USD #501 - %JOHN NESBITT (OWNER/OPERATOR)
, TOPEKA PUBLIC SCHOOLS (SCHOOL DISTRICT)
KANSAS NEUROLOGICAL INSTITUTE (3107 W 21ST ST in TOPEKA, KS)
STATE MASTER (Kansas Facility Profiler) - TANKS-06190, UNDERGROUND STORAGE TANK PROGRAM, ISL-C408971281, STATE CLEANUP SITE COMPLIANCE ACTIVITY (Tracking inspections of insecticide, fungicide, and rodenticide, and toxic substances) (Resource Conservation and Recovery Act (tracking hazardous waste)) Organizations: STATE OF KANSAS (CONTACT/OWNER)
Alternative names: KNI
U.S. CLEANERS (1570 SW WANAMAKER RD STE 110 in TOPEKA, KS)
STATE MASTER (Kansas Facility Profiler) - DRYCLEAN-0248, DRYCLEAN-0310, DRYCLEAN-0404, ISTEPS-17700224, AIR PROGRAM Conditionally Exempt Small Quantity Generators, less than 100 kg/month of hazardous waste (Resource Conservation and Recovery Act (tracking hazardous waste)) - notification Business SIC classification: DRYCLEANING PLANTS, EXCEPT RUG CLEANING Organizations: WH CLEANERS (CONTACT/OWNER)
, CHRIS DUSTER (CONTACT/OWNER)
, W H CLEANERS (CONTACT/OWNER)
, TBSH,LLC (CONTACT/OWNER)
, CREATIVE MARKETING DEV (DRY CLEANER EQUIPMENT OWNER)
, BARGAIN CLEANERS, INC (DRY CLEANER EQUIPMENT OWNER)
Alternative names: US $1.89 CLEANERS, US $1.89 CLNRS, US $1.99 CLEANERS
MOUNT HOPE CEMETERY (4700 SOUTHWEST 17TH STREET in TOPEKA, KS)
AIR MINOR (AIRS/AFS) STATE MASTER (Kansas Facility Profiler) - ISTEPS-17700172, AIR PROGRAM, TANKS-28978, UNDERGROUND STORAGE TANK PROGRAM Conditionally Exempt Small Quantity Generators, less than 100 kg/month of hazardous waste (Resource Conservation and Recovery Act (tracking hazardous waste)) - notification Business SIC classification: FUNERAL SERVICE AND CREMATORIES Business NAICS classification: FUNERAL HOMES AND FUNERAL SERVICES. Organizations: THE MOUNT HOPE CEMETERY COMPAN (OWNER/OPERATOR)
KAW AREA VOCATIONAL TECH SCHOO (5724 SW HUNTOON STREET in TOPEKA, KS)
STATE MASTER (Kansas Facility Profiler) - TANKS-28202, UNDERGROUND STORAGE TANK PROGRAM (Resource Conservation and Recovery Act (tracking hazardous waste)) Business NAICS classification: OTHER TECHNICAL AND TRADE SCHOOLS. Organizations: KAW AREA TECHNICAL SCHOOL (CONTACT/OPERATOR)
, USD #501 (CONTACT/OWNER)
Alternative names: KAW AREA TECH SCHL, KAW AREA VOTECH SCHOOL
KAW VALLEY ELECTRIC COOPERATIV (5715 SW 21ST ST in TOPEKA, KS)
STATE MASTER (Kansas Facility Profiler) - TANKS-23669, UNDERGROUND STORAGE TANK PROGRAM COMPLIANCE ACTIVITY (Tracking inspections of insecticide, fungicide, and rodenticide, and toxic substances) (Resource Conservation and Recovery Act (tracking hazardous waste)) Organizations: KAW VALLEY COOPERATIVE (CONTACT/OWNER)
Alternative names: KAW VALLEY ELEC COOP
TOPEKA TRANSMISSION SERVICE (2201 SW 10TH (A) in TOPEKA, KS)
STATE MASTER (Kansas Facility Profiler) - TANKS-12019, UNDERGROUND STORAGE TANK PROGRAM (Resource Conservation and Recovery Act (tracking hazardous waste)) Organizations: BOB JOHNSON (CONTACT/OWNER)
KELLY EXPRESS (1001 WANAMAKER ROAD in TOPEKA, KS)
STATE MASTER (Kansas Facility Profiler) - TANKS-28682, UNDERGROUND STORAGE TANK PROGRAM (Resource Conservation and Recovery Act (tracking hazardous waste)) Organizations: WANAMAKER SVC #2 (CONTACT/OWNER)
, KELLY EXPRESS LLC (OWNER/OPERATOR)
Alternative names: WANAMAKER SVC #2
UNITED RENTALS NORTHWEST (5830 SOUTHWEST 19TH TER in TOPEKA, KS)
STATE MASTER (Kansas Facility Profiler) - TANKS-43380, UNDERGROUND STORAGE TANK PROGRAM Conditionally Exempt Small Quantity Generators, less than 100 kg/month of hazardous waste (Resource Conservation and Recovery Act (tracking hazardous waste)) Organizations: UNITED RENTALS INC (CONTACT/OWNER)
, US RENTALS (OWNER/OPERATOR)
Alternative names: US RENTALS
WHITSON ELEM (1725 SW ARNOLD AVE in TOPEKA, KS)
(National Center for Education Statistics) - STATE ID-8512 Organizations: TOPEKA PUBLIC SCHOOLS (SCHOOL DISTRICT)
LOWMAN HILL ELEM (1101 SW GARFIELD AVE in TOPEKA, KS)
(National Center for Education Statistics) - STATE ID-8472 Organizations: TOPEKA PUBLIC SCHOOLS (SCHOOL DISTRICT)
Housing units lacking complete plumbing facilities: 2.2% Housing units lacking complete kitchen facilities: 2.8%
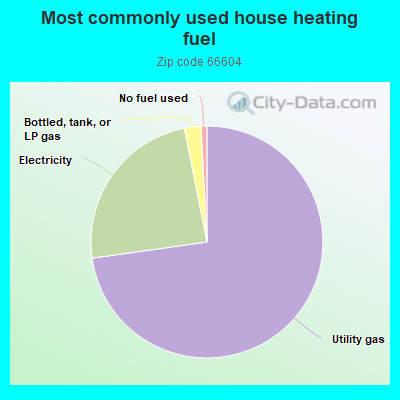
72.2%Utility gas
23.9%Electricity
2.3%Bottled, tank, or LP gas
0.8%No fuel used
Population in 1990: 23,913.
Place of birth for U.S.-born residents:
This state: 15,679
Northeast: 373
Midwest: 2,577
South: 1,634
West: 1,732
53% of the 66604 zip code residents lived in the same house 5 years ago. Out of people who lived in different houses, 65% lived in this county. Out of people who lived in different counties, 50% lived in Kansas.
85% of the 66604 zip code residents lived in the same house 1 year ago. Out of people who lived in different houses, 55% moved from this county. Out of people who lived in different houses, 20% moved from different county within same state. Out of people who lived in different houses, 23% moved from different state. Out of people who lived in different houses, 0% moved from abroad.
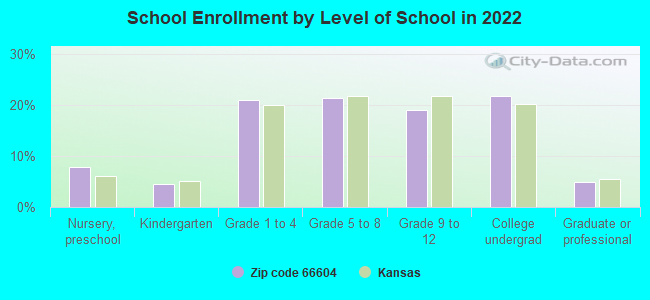
Private vs. public school enrollment:
Students in private schools in grades 1 to 8 (elementary and middle school): 448
Here:
22.2%
Kansas:
14.1%
Students in private schools in grades 9 to 12 (high school): 139
Here:
15.6%
Kansas:
10.8%
Students in private undergraduate colleges: 129
Here:
12.6%
Kansas:
15.4%
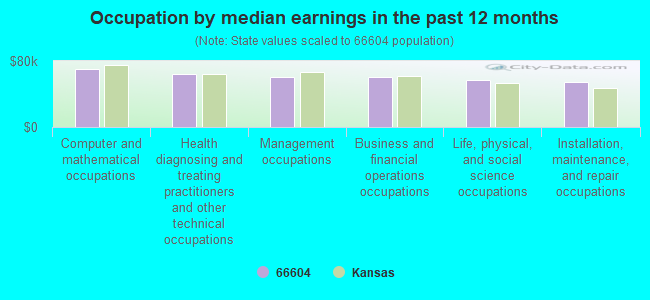
Occupation by median earnings in the past 12 months ($)
70,106Computer and mathematical occupations
64,629Health diagnosing and treating practitioners and other technical occupations
61,050Management occupations
60,638Business and financial operations occupations
56,548Life, physical, and social science occupations
55,053Installation, maintenance, and repair occupations
Companies with biggest federal contracts located in this zip code (TOPEKA, KS):
KOSS CONSTRUCTION COMPANY (5830 S W DRURY LANE) : $9,476,149 in 2 contractsfrom 2004 to 2005
$9,446,149 with Army for Maintenance, Repair or Alteration of Real Property -- Airport Runways. Signed on 2004-01-12. Completion date: 2004-12-30.
$30,000, same as above.Signed on 2005-08-24. Completion date: 2004-12-30.
STORMONT-VAIL HEALTHCARE, INC (1500 SW 10TH AVE) : $332,483 in 16 contractsfrom 2000 to 2005
Contracts for General Health Care Services, Pathology Services, Gynecology Services, Other Medical Services, and moreby U.S. Marshals Service, Public Health Service, Army, Drug Enforcement Administration, and others Signed by year:2000: $75,000; 2001: $0; 2002: $0; 2003: $67,200; 2004: $11,002; 2005: $179,281; 2006: $0.
Biggest contracts:
$75,000 with U.S. Marshals Service for General Health Care Services. Signed on 2000-10-15. Completion date: 2001-09-15.
$45,000 with Public Health Service for Pathology Services. Signed on 2005-01-03. Completion date: 2005-03-31.
$41,900 with Army for Gynecology Services. Signed on 2005-10-20. Completion date: 2006-09-30.
$36,400 with Army for Other Medical Services. Signed on 2004-11-03. Completion date: 2003-09-30.
BOSSLER/BROWN & ASSOCIATES INC (2611 SW 17TH ST; small business) : $91,145 in 8 contractsfrom 2000 to 2004
Contracts for Food Services, Pharmacology Services by Army, Department of Veterans Affairs Signed by year:2000: $6,000; 2001: $34,000; 2002: $4,000; 2003: $22,533; 2004: $24,612; 2005: $0; 2006: $0.
Biggest contracts:
$24,612 with Army for Food Services. Signed on 2004-10-01. Completion date: 2004-10-31.
$22,533, same as above.Signed on 2003-10-16. Completion date: 2003-11-13.
$11,000 with Department of Veterans Affairs for Pharmacology Services. Signed on 2001-10-15. Completion date: 2001-12-15.
$10,000, same as above.Signed on 2001-01-15. Completion date: 2001-03-15.
WALTER MENNINGER (PO BOX 4406)
$36,000 with Offices, Boards and Divisions (includes Attorney General, Deputy Attorney General, etc.) for Expert Witness. Signed on 2005-06-30. Completion date: 2005-09-30.
NARAYANA INC (1510 SW WANAMAKER RD; small business)
$33,638 with Army for Lodging - Hotel/Motel. Signed on 2003-11-17. Completion date: 2003-12-18.
BOBS JANITORIAL SERVICE & SUPP (5711 SW 21ST ST; small business) : $28,908 in 7 contractsfrom 2001 to 2003
Contracts for Custodial Janitorial Services by U.S. Army Corps of Engineers - civil program financing only, Army Signed by year:2000: $0; 2001: $10,776; 2002: $2,772; 2003: $15,360; 2004: $0; 2005: $0; 2006: $0.
Biggest contracts:
$10,776 with U.S. Army Corps of Engineers - civil program financing only for Custodial Janitorial Services. Signed on 2001-10-01. Completion date: 2002-09-30.
$5,760 with Army for Custodial Janitorial Services. Signed on 2003-10-15. Completion date: 2003-03-01.
$5,760 with U.S. Army Corps of Engineers - civil program financing only for Custodial Janitorial Services. Signed on 2003-10-15. Completion date: 2003-03-01.
$3,840, same as above.Signed on 2003-02-27. Completion date: 2003-03-01.
UNITED RENTALS (NORTH AMERICA) (5830 SW 19TH TER) : $17,197 in 4 contractsin 2004
$10,550 with Army for Lease or Rental of Equipment -- Construction, Mining, Excavating, and Highway Maintenance Equipment. Signed on 2004-06-30. Completion date: 2004-07-12.
$9,126 with Army for Warehouse Trucks and Tractors, Self-Propelled. Signed on 2004-09-02. Completion date: 2004-11-05.
$276 with Army for Lease or Rental of Equipment -- Construction, Mining, Excavating, and Highway Maintenance Equipment. Signed on 2004-07-27. Completion date: 2004-07-12.
-$2,755, same as above.Signed on 2004-07-21. Completion date: 2004-07-12.
STRYKER SERVICES, INC (1401 SW LANE; small business)
$12,023 with Army for Maintenance, Repair and Rebuilding of Equipment -- Refrigeration, Air Conditioning, and Air Circulating Equipment. Signed on 2006-06-20. Completion date: 2006-07-20.
KANSAS AUDIO VIDEO INC (4010 SW 21ST ST; small business) : $11,653 in 2 contractsfrom 2005 to 2006
$7,624 with Army for Radio and Television Communication Equipment, Except Airborne. Signed on 2006-02-02. Completion date: 2006-03-04.
$4,029 with Army for Fiber Optic Cable Assemblies and Harnesses. Signed on 2005-05-06. Completion date: 2005-06-05.
DRAPERIES BY DOROTHY (1215 GAGE STE D; small business)
$7,600 with Army for Draperies, Awnings, and Shades. Signed on 2002-09-27. Completion date: 2002-10-27.
Top industries in this zip code by the number of employees in 2005:
Health Care and Social Assistance: Specialty (except Psychiatric and Substance Abuse) Hospitals (500-999: 1)
Other Services (except Public Administration): Religious Organizations (50-99: 3, 20-49: 4, 10-19: 4, 5-9: 5, 1-4: 19)
Health Care and Social Assistance: Nursing Care Facilities (100-249: 2)
Administrative and Support and Waste Management and Remediation Services: Temporary Help Services (100-249: 1, 50-99: 1, 20-49: 1, 10-19: 1, 5-9: 1, 1-4: 1)
People in group quarters in 2010:
301 people in nursing facilities/skilled-nursing facilities
167 people in residential treatment centers for adults
63 people in college/university student housing
21 people in group homes intended for adults
7 people in group homes for juveniles (non-correctional)
People in group quarters in 2000:
341 people in nursing homes
271 people in college dormitories (includes college quarters off campus)
195 people in mental (psychiatric) hospitals or wards
194 people in schools, hospitals, or wards for the intellectually disabled
53 people in homes for the mentally ill
34 people in hospitals or wards for drug/alcohol abuse
16 people in other noninstitutional group quarters
5 people in homes or halfway houses for drug/alcohol abuse
2 people in religious group quarters
Fatal accident statistics in 2014:
Fatal accident count: 1
Vehicles involved in fatal accidents: 2
Fatal accidents caused by drunken drivers: 0
Fatalities: 1
Persons involved in fatal accidents: 3
Pedestrians involved in fatal accidents: 0
Fatal accident statistics in 2011:
Fatal accident count: 2
Vehicles involved in fatal accidents: 5
Fatal accidents caused by drunken drivers: 2
Fatalities: 2
Persons involved in fatal accidents: 7
Pedestrians involved in fatal accidents: 0
Home Mortgage Disclosure Act Aggregated Statistics For Year 2009 (Based on 4 full and 16 partial tracts)
A) FHA, FSA/RHS & VA Home Purchase Loans
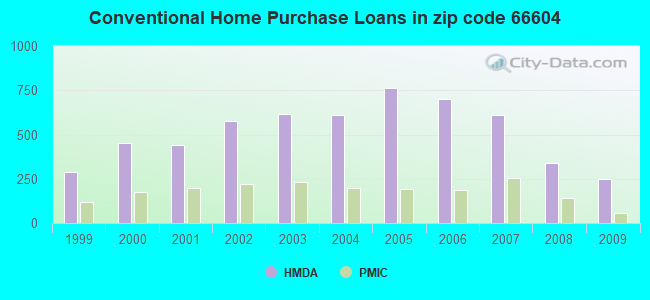
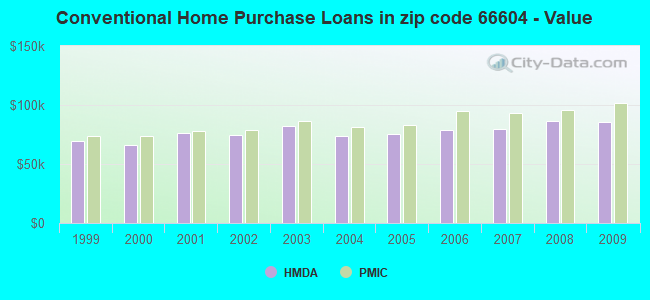
B) Conventional Home Purchase Loans
C) Refinancings
D) Home Improvement Loans
E) Loans on Dwellings For 5+ Families
F) Non-occupant Loans on < 5 Family Dwellings (A B C & D)
Number
Average Value
Number
Average Value
Number
Average Value
Number
Average Value
Number
Average Value
Number
Average Value
LOANS ORIGINATED
258
$94,284
249
$85,921
485
$99,292
56
$28,399
8
$972,252
155
$74,605
APPLICATIONS APPROVED, NOT ACCEPTED
7
$71,996
20
$92,834
52
$100,069
10
$28,666
0
$0
5
$72,324
APPLICATIONS DENIED
23
$77,901
40
$64,825
194
$97,858
22
$21,870
2
$660,715
27
$80,931
APPLICATIONS WITHDRAWN
16
$98,549
22
$73,975
145
$96,373
10
$44,049
0
$0
13
$48,876
FILES CLOSED FOR INCOMPLETENESS
0
$0
2
$76,960
17
$84,426
0
$0
0
$0
2
$42,865
Aggregated Statistics For Year 2008 (Based on 4 full and 16 partial tracts)
A) FHA, FSA/RHS & VA Home Purchase Loans
B) Conventional Home Purchase Loans
C) Refinancings
D) Home Improvement Loans
E) Loans on Dwellings For 5+ Families
F) Non-occupant Loans on < 5 Family Dwellings (A B C & D)
G) Loans On Manufactured Home Dwelling (A B C & D)
Number
Average Value
Number
Average Value
Number
Average Value
Number
Average Value
Number
Average Value
Number
Average Value
Number
Average Value
LOANS ORIGINATED
189
$91,704
340
$86,326
377
$88,104
93
$30,954
13
$416,766
235
$66,683
0
$0
APPLICATIONS APPROVED, NOT ACCEPTED
7
$76,353
20
$100,628
47
$80,009
16
$19,650
0
$0
10
$52,682
1
$44,420
APPLICATIONS DENIED
13
$102,642
36
$73,519
247
$89,115
89
$32,182
4
$845,695
35
$47,789
3
$47,517
APPLICATIONS WITHDRAWN
11
$81,604
33
$81,561
138
$104,243
10
$51,057
0
$0
8
$63,902
0
$0
FILES CLOSED FOR INCOMPLETENESS
4
$95,572
4
$70,110
19
$106,348
6
$33,748
0
$0
4
$56,325
0
$0
Aggregated Statistics For Year 2007 (Based on 4 full and 16 partial tracts)
A) FHA, FSA/RHS & VA Home Purchase Loans
B) Conventional Home Purchase Loans
C) Refinancings
D) Home Improvement Loans
E) Loans on Dwellings For 5+ Families
F) Non-occupant Loans on < 5 Family Dwellings (A B C & D)
G) Loans On Manufactured Home Dwelling (A B C & D)
Number
Average Value
Number
Average Value
Number
Average Value
Number
Average Value
Number
Average Value
Number
Average Value
Number
Average Value
LOANS ORIGINATED
131
$90,840
609
$79,454
472
$88,857
127
$33,818
9
$954,808
272
$56,597
3
$80,453
APPLICATIONS APPROVED, NOT ACCEPTED
2
$162,195
55
$84,171
71
$92,016
19
$23,510
0
$0
13
$68,618
0
$0
APPLICATIONS DENIED
26
$81,663
98
$75,954
351
$92,398
115
$41,699
0
$0
28
$63,279
0
$0
APPLICATIONS WITHDRAWN
9
$98,069
40
$94,872
149
$90,146
23
$70,558
0
$0
16
$57,267
0
$0
FILES CLOSED FOR INCOMPLETENESS
2
$163,000
7
$103,120
27
$89,352
2
$17,025
0
$0
2
$117,920
0
$0
Aggregated Statistics For Year 2006 (Based on 4 full and 16 partial tracts)
A) FHA, FSA/RHS & VA Home Purchase Loans
B) Conventional Home Purchase Loans
C) Refinancings
D) Home Improvement Loans
E) Loans on Dwellings For 5+ Families
F) Non-occupant Loans on < 5 Family Dwellings (A B C & D)
G) Loans On Manufactured Home Dwelling (A B C & D)
Number
Average Value
Number
Average Value
Number
Average Value
Number
Average Value
Number
Average Value
Number
Average Value
Number
Average Value
LOANS ORIGINATED
171
$81,945
699
$78,875
540
$88,884
127
$33,590
10
$4,008,482
327
$71,976
3
$51,167
APPLICATIONS APPROVED, NOT ACCEPTED
2
$71,775
52
$65,712
72
$85,693
12
$41,978
0
$0
27
$64,471
0
$0
APPLICATIONS DENIED
14
$79,646
92
$57,943
432
$86,520
115
$41,339
0
$0
66
$66,618
6
$100,797
APPLICATIONS WITHDRAWN
13
$84,728
44
$75,451
243
$90,233
25
$115,373
0
$0
27
$88,620
0
$0
FILES CLOSED FOR INCOMPLETENESS
5
$101,790
17
$81,657
63
$86,902
1
$42,440
0
$0
8
$78,362
0
$0
Aggregated Statistics For Year 2005 (Based on 4 full and 16 partial tracts)
A) FHA, FSA/RHS & VA Home Purchase Loans
B) Conventional Home Purchase Loans
C) Refinancings
D) Home Improvement Loans
E) Loans on Dwellings For 5+ Families
F) Non-occupant Loans on < 5 Family Dwellings (A B C & D)
G) Loans On Manufactured Home Dwelling (A B C & D)
Number
Average Value
Number
Average Value
Number
Average Value
Number
Average Value
Number
Average Value
Number
Average Value
Number
Average Value
LOANS ORIGINATED
124
$82,156
763
$75,788
550
$78,904
139
$35,191
15
$898,375
256
$56,359
8
$31,884
APPLICATIONS APPROVED, NOT ACCEPTED
5
$101,184
50
$68,910
74
$76,964
17
$31,199
0
$0
17
$50,165
0
$0
APPLICATIONS DENIED
9
$82,400
100
$63,752
568
$88,868
126
$35,252
0
$0
95
$86,063
8
$54,990
APPLICATIONS WITHDRAWN
7
$101,956
76
$83,640
367
$89,872
38
$97,778
0
$0
40
$93,021
2
$17,025
FILES CLOSED FOR INCOMPLETENESS
0
$0
27
$60,918
74
$83,985
1
$60,330
0
$0
6
$40,627
0
$0
Aggregated Statistics For Year 2004 (Based on 4 full and 16 partial tracts)
A) FHA, FSA/RHS & VA Home Purchase Loans
B) Conventional Home Purchase Loans
C) Refinancings
D) Home Improvement Loans
E) Loans on Dwellings For 5+ Families
F) Non-occupant Loans on < 5 Family Dwellings (A B C & D)
G) Loans On Manufactured Home Dwelling (A B C & D)
Number
Average Value
Number
Average Value
Number
Average Value
Number
Average Value
Number
Average Value
Number
Average Value
Number
Average Value
LOANS ORIGINATED
141
$80,265
610
$73,589
669
$78,830
147
$41,129
12
$694,280
205
$54,423
1
$20,840
APPLICATIONS APPROVED, NOT ACCEPTED
2
$91,910
45
$81,353
107
$74,417
12
$30,450
0
$0
26
$54,882
1
$68,430
APPLICATIONS DENIED
8
$67,115
95
$67,407
484
$76,478
135
$28,611
0
$0
39
$73,056
4
$41,938
APPLICATIONS WITHDRAWN
13
$78,125
63
$77,277
248
$82,568
28
$63,973
0
$0
18
$47,816
0
$0
FILES CLOSED FOR INCOMPLETENESS
2
$103,745
13
$76,008
127
$86,063
2
$59,820
0
$0
10
$76,032
0
$0
Aggregated Statistics For Year 2003 (Based on 4 full and 16 partial tracts)
A) FHA, FSA/RHS & VA Home Purchase Loans
B) Conventional Home Purchase Loans
C) Refinancings
D) Home Improvement Loans
E) Loans on Dwellings For 5+ Families
F) Non-occupant Loans on < 5 Family Dwellings (A B C & D)
Number
Average Value
Number
Average Value
Number
Average Value
Number
Average Value
Number
Average Value
Number
Average Value
LOANS ORIGINATED
164
$76,092
613
$82,535
1,375
$75,805
82
$24,840
12
$290,823
239
$59,678
APPLICATIONS APPROVED, NOT ACCEPTED
2
$99,000
33
$96,331
131
$74,992
13
$16,950
0
$0
8
$64,010
APPLICATIONS DENIED
4
$68,278
59
$223,851
447
$73,450
66
$14,145
0
$0
30
$56,600
APPLICATIONS WITHDRAWN
14
$83,777
55
$81,335
270
$76,266
11
$16,989
0
$0
20
$60,433
FILES CLOSED FOR INCOMPLETENESS
1
$31,000
8
$143,241
49
$75,910
2
$29,745
0
$0
3
$59,063
Aggregated Statistics For Year 2002 (Based on 4 full and 14 partial tracts)
A) FHA, FSA/RHS & VA Home Purchase Loans
B) Conventional Home Purchase Loans
C) Refinancings
D) Home Improvement Loans
E) Loans on Dwellings For 5+ Families
F) Non-occupant Loans on < 5 Family Dwellings (A B C & D)
Number
Average Value
Number
Average Value
Number
Average Value
Number
Average Value
Number
Average Value
Number
Average Value
LOANS ORIGINATED
200
$73,405
576
$74,955
840
$77,436
96
$21,159
7
$320,183
182
$56,812
APPLICATIONS APPROVED, NOT ACCEPTED
0
$0
42
$64,979
125
$68,176
10
$16,878
0
$0
19
$48,177
APPLICATIONS DENIED
9
$58,447
69
$60,246
280
$63,868
57
$10,319
0
$0
20
$41,300
APPLICATIONS WITHDRAWN
12
$67,138
49
$62,638
224
$69,415
14
$46,616
0
$0
11
$49,594
FILES CLOSED FOR INCOMPLETENESS
0
$0
12
$68,040
129
$80,832
2
$27,830
0
$0
11
$60,367
Aggregated Statistics For Year 2001 (Based on 4 full and 14 partial tracts)
A) FHA, FSA/RHS & VA Home Purchase Loans
B) Conventional Home Purchase Loans
C) Refinancings
D) Home Improvement Loans
E) Loans on Dwellings For 5+ Families
F) Non-occupant Loans on < 5 Family Dwellings (A B C & D)
Number
Average Value
Number
Average Value
Number
Average Value
Number
Average Value
Number
Average Value
Number
Average Value
LOANS ORIGINATED
196
$72,023
442
$76,371
691
$71,224
128
$16,052
9
$211,249
199
$57,440
APPLICATIONS APPROVED, NOT ACCEPTED
2
$61,625
37
$56,809
65
$66,504
11
$17,433
0
$0
6
$47,957
APPLICATIONS DENIED
8
$70,704
87
$43,704
346
$56,889
60
$14,073
0
$0
36
$37,047
APPLICATIONS WITHDRAWN
5
$67,520
24
$70,999
210
$65,180
16
$15,820
0
$0
11
$45,970
FILES CLOSED FOR INCOMPLETENESS
7
$55,093
2
$81,910
62
$59,668
1
$26,130
0
$0
3
$37,770
Aggregated Statistics For Year 2000 (Based on 4 full and 14 partial tracts)
A) FHA, FSA/RHS & VA Home Purchase Loans
B) Conventional Home Purchase Loans
C) Refinancings
D) Home Improvement Loans
E) Loans on Dwellings For 5+ Families
F) Non-occupant Loans on < 5 Family Dwellings (A B C & D)
Number
Average Value
Number
Average Value
Number
Average Value
Number
Average Value
Number
Average Value
Number
Average Value
LOANS ORIGINATED
205
$66,877
450
$65,876
225
$60,819
138
$16,332
9
$79,616
175
$45,112
APPLICATIONS APPROVED, NOT ACCEPTED
2
$53,810
33
$52,191
43
$61,474
28
$12,885
0
$0
11
$35,220
APPLICATIONS DENIED
5
$48,884
110
$44,611
225
$47,130
95
$16,669
0
$0
30
$43,007
APPLICATIONS WITHDRAWN
13
$61,914
31
$68,173
107
$49,573
16
$15,352
0
$0
2
$25,535
FILES CLOSED FOR INCOMPLETENESS
0
$0
2
$182,690
29
$66,411
0
$0
0
$0
3
$31,083
Aggregated Statistics For Year 1999 (Based on 4 full and 8 partial tracts)
A) FHA, FSA/RHS & VA Home Purchase Loans
B) Conventional Home Purchase Loans
C) Refinancings
D) Home Improvement Loans
E) Loans on Dwellings For 5+ Families
F) Non-occupant Loans on < 5 Family Dwellings (A B C & D)
2002 - 2018 National Fire Incident Reporting System (NFIRS) incidents
Based on the data from the years 2002 - 2018 the average number of fire incidents per year is 134. The highest number of fires - 196 took place in 2002, and the least - 86 in 2015. The data has a decreasing trend.
When looking into fire subcategories, the most incidents belonged to: Outside Fires (44.2%), and Structure Fires (39.7%).
Fire incident types reported to NFIRS in Zip Code 66604
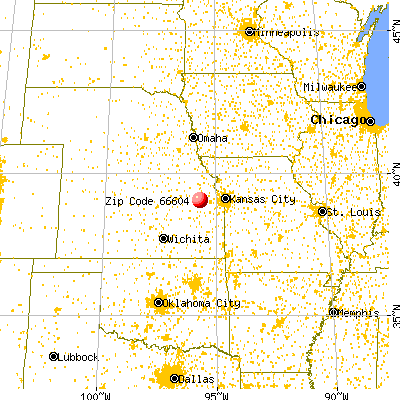


 Nearest zip codes: 66622, 66606, 66621, 66611, 66612, 66603.


 Based on the data from the years 2002 - 2018 the average number of fire incidents per year is 134. The highest number of fires - 196 took place in 2002, and the least - 86 in 2015. The data has a decreasing trend.
 When looking into fire subcategories, the most incidents belonged to: Outside Fires (44.2%), and Structure Fires (39.7%).