Estimated zip code population in 2022: 4,926 Zip code population in 2010: 5,027 Zip code population in 2000: 3,914
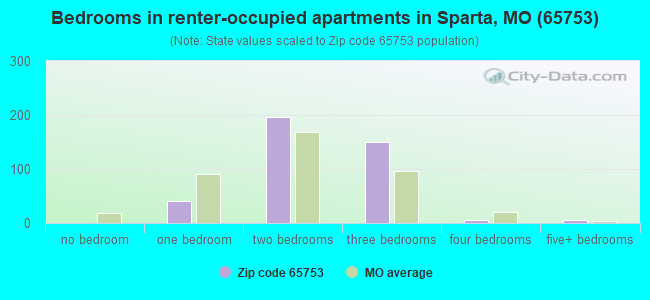
Houses and condos: 2,097 Renter-occupied apartments: 398
% of renters here:
20%
State:
32%
March 2022 cost of living index in zip code 65753: 76.6 (low, U.S. average is 100)
Land area: 69.8 sq. mi. Water area: 0.2 sq. mi.
Population density: 71 people per square mile
(very low).
OSM Map
General Map
Google Map
MSN Map
OSM Map
General Map
Google Map
MSN Map
OSM Map
General Map
Google Map
MSN Map
OSM Map
General Map
Google Map
MSN Map
Please wait while loading the map...
Real estate property taxes paid for housing units in 2022:
This zip code:
0.6% ($1,253)
Missouri:
0.8% ($1,810)
Median real estate property taxes paid for housing units with mortgages in 2022: $1,199 (0.6%) Median real estate property taxes paid for housing units with no mortgage in 2022: $1,343 (0.6%)
Business Search- 14 Million verified businesses
Males: 2,352
(47.7%)
Females: 2,574
(52.3%)
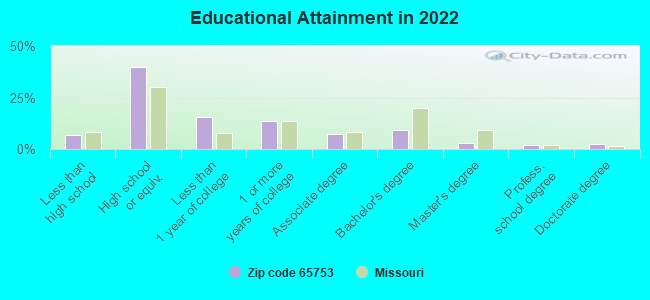
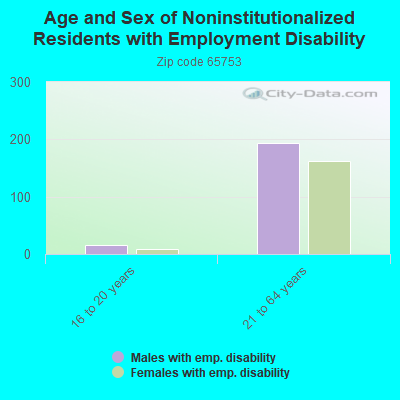
For population 25 years and over in 65753:
High school or higher: 92.6%
Bachelor's degree or higher: 16.4%
Graduate or professional degree: 7.1%
Unemployed: 3.2%
Mean travel time to work (commute): 33.4 minutes
For population 15 years and over in 65753:
Never married: 17.0%
Now married: 67.0%
Separated: 1.6%
Widowed: 5.1%
Divorced: 9.3%
Zip code 65753 compared to state average:
Black race population percentage significantly below state average.
Hispanic race population percentage significantly below state average.
Median age above state average.
Foreign-born population percentage significantly below state average.
Renting percentage below state average.
House age below state average.
Percentage of population with a bachelor's degree or higher below state average.
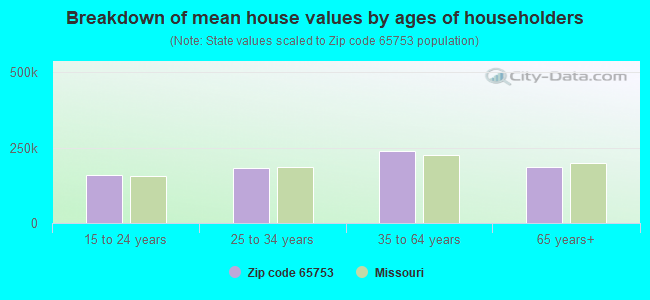
Estimated median house/condo value in 2022: $209,663
65753:
$209,663
Missouri:
$221,200
According to our research of Missouri and other state lists, there were 15 registered sex offenders living in 65753 zip code as of June 02, 2024. The ratio of all residents to sex offenders in zip code 65753 is 331 to 1. The ratio of registered sex offenders to all residents in this zip code is near the state average.
Median resident age:
This zip code:
45.1 years
Missouri median age:
39.1 years
Average household size:
This zip code:
2.5 people
Missouri:
2.4 people
Averages for the 2020 tax year for zip code 65753, filed in 2021:
Average Adjusted Gross Income (AGI) in 2020: $52,317 (Individual Income Tax Returns)
Here:
$52,317
State:
$68,151
Salary/wage: $46,659 (reported on 82.1% of returns)
Here:
$46,659
State:
$56,131
(% of AGI for various income ranges: 1198.1% for AGIs below $25k, 3565.5% for AGIs $25k-50k, 6712.5% for AGIs $50k-75k, 9307.3% for AGIs $75k-100k, 13479.3% for AGIs $100k-200k)
Taxable interest for individuals: $728 (reported on 25.5% of returns)
This zip code:
$728
Missouri:
$1,586
(% of AGI for various income ranges: 14.3% for AGIs below $25k, 21.9% for AGIs $25k-50k, 29.6% for AGIs $50k-75k, 22.7% for AGIs $75k-100k, 44.7% for AGIs $100k-200k)
Ordinary dividends: $2,427 (reported on 10.4% of returns)
Here:
$2,427
State:
$10,947
(% of AGI for various income ranges: 8.0% for AGIs below $25k, 18.1% for AGIs $25k-50k, 35.4% for AGIs $50k-75k, 34.7% for AGIs $75k-100k, 179.3% for AGIs $100k-200k)
Net capital gain/loss in AGI: +$13,445 (reported on 10.4% of returns)
Here:
+$13,445
State:
+$18,453
(% of AGI for various income ranges: 15.6% for AGIs below $25k, 23.4% for AGIs $25k-50k, 100.4% for AGIs $50k-75k, 112.0% for AGIs $75k-100k, 894.0% for AGIs $100k-200k)
Profit/loss from business: +$11,853 (reported on 17.9% of returns)
Here:
+$11,853
State:
+$12,260
(% of AGI for various income ranges: 190.2% for AGIs below $25k, 184.7% for AGIs $25k-50k, 487.9% for AGIs $50k-75k, 133.3% for AGIs $75k-100k, 825.3% for AGIs $100k-200k)
Taxable individual retirement arrangement distribution: $13,987 (reported on 7.1% of returns)
65753:
$13,987
Missouri:
$19,719
(% of AGI for various income ranges: 49.6% for AGIs below $25k, 77.7% for AGIs $25k-50k, 149.6% for AGIs $50k-75k, 192.0% for AGIs $75k-100k, 545.3% for AGIs $100k-200k)
Total itemized deductions: $31,188 (reported on 3.8% of returns)
Here:
$31,188
State:
$36,651
(% of AGI for various income ranges: 165.1% for AGIs $25k-50k, 1146.0% for AGIs $100k-200k)
Charity contributions: $11,917 (reported on 2.8% of returns)
Here:
$11,917
State:
$15,671
(% of AGI for various income ranges: 20.9% for AGIs below $25k, 401.3% for AGIs $100k-200k)
Taxes paid: $6,412 (reported on 3.8% of returns)
65753:
$6,412
State:
$7,608
(% of AGI for various income ranges: 26.6% for AGIs $25k-50k, 258.7% for AGIs $100k-200k)
Earned income credit: $2,493 (reported on 21.7% of returns)
Here:
$2,493
State:
$2,315
(% of AGI for various income ranges: 123.7% for AGIs below $25k, 99.1% for AGIs $25k-50k, 5.4% for AGIs $50k-75k)
Percentage of individuals using paid preparers for their 2020 taxes: 94.3%
Here:
94%
State:
93%
(% for various income ranges: 91.9% for AGIs below $25k, 94.8% for AGIs $25k-50k, 97.1% for AGIs $50k-75k, 95.0% for AGIs $75k-100k, 95.5% for AGIs $100k-200k, 100.0% for AGIs over 200k)
Averages for the 2012 tax year for zip code 65753, filed in 2013:
Average Adjusted Gross Income (AGI) in 2012: $40,248 (Individual Income Tax Returns)
Here:
$40,248
State:
$55,896
Salary/wage: $34,196 (reported on 84.2% of returns)
Here:
$34,196
State:
$46,205
(% of AGI for various income ranges: 79.1% for AGIs below $25k, 81.2% for AGIs $25k-50k, 79.1% for AGIs $50k-75k, 70.1% for AGIs $75k-100k, 52.1% for AGIs $100k-200k)
Taxable interest for individuals: $671 (reported on 27.4% of returns)
This zip code:
$671
Missouri:
$1,559
(% of AGI for various income ranges: 1.2% for AGIs below $25k, 0.6% for AGIs $25k-50k, 0.3% for AGIs $50k-75k, 0.3% for AGIs $75k-100k, 0.1% for AGIs $100k-200k)
Ordinary dividends: $1,850 (reported on 10.5% of returns)
Here:
$1,850
State:
$7,410
(% of AGI for various income ranges: 1.0% for AGIs below $25k, 0.4% for AGIs $25k-50k, 0.2% for AGIs $50k-75k, 0.8% for AGIs $75k-100k, 0.3% for AGIs $100k-200k)
Net capital gain/loss in AGI: +$11,717 (reported on 9.5% of returns)
Here:
+$11,717
State:
+$11,579
(% of AGI for various income ranges: 0.6% for AGIs $25k-50k, 1.2% for AGIs $50k-75k, 0.7% for AGIs $75k-100k, 9.2% for AGIs $100k-200k)
Profit/loss from business: +$9,009 (reported on 17.9% of returns)
Here:
+$9,009
State:
+$11,688
(% of AGI for various income ranges: 9.7% for AGIs below $25k, 3.0% for AGIs $25k-50k, 1.9% for AGIs $50k-75k, 2.9% for AGIs $75k-100k, 4.2% for AGIs $100k-200k)
Taxable individual retirement arrangement distribution: $14,215 (reported on 6.8% of returns)
65753:
$14,215
Missouri:
$14,773
(% of AGI for various income ranges: 1.8% for AGIs below $25k, 1.5% for AGIs $25k-50k, 1.8% for AGIs $50k-75k, 8.7% for AGIs $75k-100k)
Total itemized deductions: $21,344 (25% of AGI, reported on 18.9% of returns)
Here:
$21,344
State:
$22,730
Here:
25.2% of AGI
State:
19.2% of AGI
(% of AGI for various income ranges: 5.8% for AGIs below $25k, 9.1% for AGIs $25k-50k, 9.0% for AGIs $50k-75k, 10.2% for AGIs $75k-100k, 14.4% for AGIs $100k-200k)
Charity contributions: $4,068 (reported on 13.2% of returns)
Here:
$4,068
State:
$4,745
(% of AGI for various income ranges: 0.4% for AGIs below $25k, 0.6% for AGIs $25k-50k, 1.2% for AGIs $50k-75k, 2.0% for AGIs $75k-100k, 2.3% for AGIs $100k-200k)
Taxes paid: $4,678 (reported on 18.9% of returns)
65753:
$4,678
State:
$8,399
(% of AGI for various income ranges: 1.2% for AGIs below $25k, 1.0% for AGIs $25k-50k, 1.8% for AGIs $50k-75k, 2.7% for AGIs $75k-100k, 4.0% for AGIs $100k-200k)
Earned income credit: $2,422 (reported on 26.3% of returns)
Here:
$2,422
State:
$2,288
(% of AGI for various income ranges: 7.9% for AGIs below $25k, 1.9% for AGIs $25k-50k)
Percentage of individuals using paid preparers for their 2012 taxes: 59.5%
Here:
59%
State:
55%
(% for various income ranges: 55.1% for AGIs below $25k, 58.3% for AGIs $25k-50k, 67.9% for AGIs $50k-75k, 71.4% for AGIs $75k-100k, 63.6% for AGIs $100k-200k)
Averages for the 2004 tax year for zip code 65753, filed in 2005:
Average Adjusted Gross Income (AGI) in 2004: $32,064 (Individual Income Tax Returns)
Here:
$32,064
State:
$44,591
Salary/wage: $29,869 (reported on 85.6% of returns)
Here:
$29,869
State:
$38,941
(% of AGI for various income ranges: 176.3% for AGIs below $10k, 79.2% for AGIs $10k-25k, 85.1% for AGIs $25k-50k, 85.5% for AGIs $50k-75k, 77.1% for AGIs $75k-100k, 46.9% for AGIs over 100k)
Taxable interest for individuals: $1,267 (reported on 33.9% of returns)
This zip code:
$1,267
Missouri:
$1,801
(% of AGI for various income ranges: 11.6% for AGIs below $10k, 1.7% for AGIs $10k-25k, 1.0% for AGIs $25k-50k, 0.6% for AGIs $50k-75k, 1.1% for AGIs $75k-100k, 1.9% for AGIs over 100k)
Taxable dividends: $847 (reported on 11.6% of returns)
Here:
$847
State:
$3,677
(% of AGI for various income ranges: 1.0% for AGIs below $10k, 0.3% for AGIs $10k-25k, 0.3% for AGIs $25k-50k, 0.3% for AGIs $50k-75k, 0.4% for AGIs $75k-100k, 0.2% for AGIs over 100k)
Net capital gain/loss: +$15,558 (reported on 12.9% of returns)
Here:
+$15,558
State:
+$8,915
(% of AGI for various income ranges: 3.4% for AGIs below $10k, 1.9% for AGIs $10k-25k, 1.3% for AGIs $25k-50k, 0.9% for AGIs $50k-75k, 4.3% for AGIs $75k-100k, 33.8% for AGIs over 100k)
Profit/loss from business: +$6,182 (reported on 18.6% of returns)
Here:
+$6,182
State:
+$9,793
(% of AGI for various income ranges: 26.4% for AGIs below $10k, 7.9% for AGIs $10k-25k, 2.6% for AGIs $25k-50k, 3.3% for AGIs $50k-75k, 2.1% for AGIs $75k-100k)
IRA payment deduction: $2,828 (reported on 1.7% of returns)
65753:
$2,828
Missouri:
$2,972
Total itemized deductions: $15,148 (25% of AGI, reported on 20.5% of returns)
Here:
$15,148
State:
$18,261
Here:
24.5% of AGI
State:
20.5% of AGI
(% of AGI for various income ranges: 7.8% for AGIs $10k-25k, 7.3% for AGIs $25k-50k, 9.8% for AGIs $50k-75k, 16.4% for AGIs $75k-100k, 12.7% for AGIs over 100k)
Charity contributions deductions: $3,919 (6% of AGI, reported on 15.4% of returns)
Here:
$3,919
State:
$3,665
Here:
5.8% of AGI
State:
3.9% of AGI
(% of AGI for various income ranges: 0.8% for AGIs $10k-25k, 1.0% for AGIs $25k-50k, 1.7% for AGIs $50k-75k, 2.8% for AGIs $75k-100k, 5.0% for AGIs over 100k)
Total tax: $3,582 (reported on 69.7% of returns)
65753:
$3,582
State:
$6,999
(% of AGI for various income ranges: 6.3% for AGIs below $10k, 3.9% for AGIs $10k-25k, 5.6% for AGIs $25k-50k, 8.2% for AGIs $50k-75k, 10.0% for AGIs $75k-100k, 14.5% for AGIs over 100k)
Earned income credit: $1,850 (reported on 24.5% of returns)
Here:
$1,850
State:
$1,728
Percentage of individuals using paid preparers for their 2004 taxes: 65.2%
Here:
65%
State:
62%
(% for various income ranges: 61.5% for AGIs below $10k, 62.8% for AGIs $10k-25k, 68.9% for AGIs $25k-50k, 64.8% for AGIs $50k-75k, 70.3% for AGIs $75k-100k, 74.5% for AGIs over 100k)
Likely homosexual households (counted as self-reported same-sex unmarried-partner households)
Lesbian couples: 0.2% of all households
Gay men: 0.0% of all households
Household received Food Stamps/SNAP in the past 12 months: 181 Household did not receive Food Stamps/SNAP in the past 12 months: 1,773
Women who had a birth in the past 12 months: 91 (26 now married, 69 unmarried) Women who did not have a birth in the past 12 months: 841 (510 now married, 327 unmarried)
Housing units in zip code 65753 with a mortgage: 851 (62 second mortgage, 13 both second mortgage and home equity loan) Median monthly owner costs for units with a mortgage: $1,213 Median monthly owner costs for units without a mortgage: $483
Residents with income below the poverty level in 2022:
This zip code:
8.1%
Whole state:
13.2%
Residents with income below 50% of the poverty level in 2022:
This zip code:
4.0%
Whole state:
6.8%
Median number of rooms in houses and condos:
Here:
5.5
State:
6.4
Median number of rooms in apartments:
Here:
4.2
State:
4.4
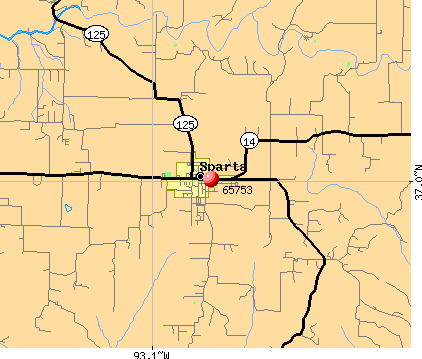
Notable locations in this zip code not listed on our city pages
Notable locations in zip code 65753: Ozark Fire Protection District Station 4 (A), Sparta Fire Protection District (B), Chadwick Rural Fire Department (C). Display/hide their locations on the map
Churches in zip code 65753 include: Full Gospel Church (A), Fairview Church (B), Shady Grove Church (C), Linden Chapel (D), La Rose Church (E), Monger Church (F), Mount Zion Church (G). Display/hide their locations on the map
Cemeteries: Farmer Cemetery (1), Martin Cemetery (2), Fairview Cemetery (3), Gardner Cemetery (4), Roberts Cemetery (5), Shipman Cemetery (6), Friend Cemetery (7). Display/hide their locations on the map
Size of family households: 922 2-persons, 201 3-persons, 258 4-persons, 123 5-persons, 63 6-persons, 11 7-or-more-persons
Size of nonfamily households: 253 1-person, 112 2-persons, 2 3-persons
600 married couples with children.
186 single-parent households (83 men, 103 women).
97.7% of residents of 65753 zip code speak English at home.
2.1% of residents speak Spanish at home (58% very well, 42% well).
0.3% of residents speak other Indo-European language at home (69% not well, 31% not at all).
Foreign born population: 81 (1.7%) (27.6% of them are naturalized citizens)
This zip code:
1.7%
Whole state:
4.1%
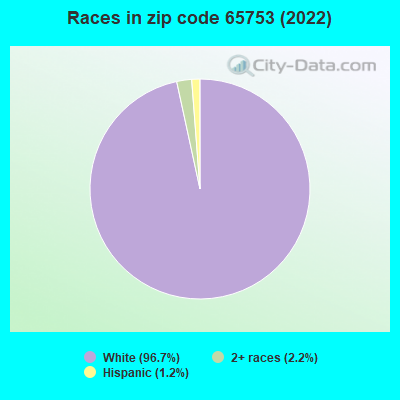
37%Brazil
30%France
6%Albania
6%Serbia
4%Romania
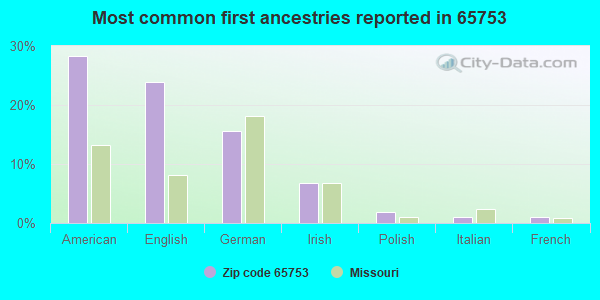
28%American
24%English
16%German
7%Irish
2%Polish
1%Italian
1%French
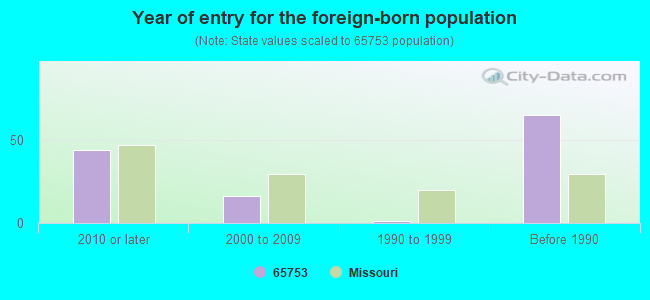
Year of entry for the foreign-born population
442010 or later
162000 to 2009
11990 to 1999
65Before 1990
Facilities with environmental interests located in this zip code:
J&J AUTO SUPPLY (HWY 14 in SPARTA, MO)
(Integrated Compliance Information System) - ICIS-07-1996-0301, FORMAL ENFORCEMENT ACTION STATE MASTER (Missouri monitoring and compilance) - ICIS-34609, ENFORCEMENT/COMPLIANCE ACTIVITY Business SIC classification: AUTO AND HOME SUPPLY STORES
CIRCLE M READY MIX (P.O. BOX 177 in SPARTA, MO)
AIR MINOR (AIRS/AFS) National Pollutant Discharge Elimination System NON-MAJOR (Tracking pollutant discharge elimination systems) - permit National Pollutant Discharge Elimination System NON-MAJOR (Tracking pollutant discharge elimination systems) - permit Business SIC classification: HEAVY CONSTRUCTION; CONCRETE PRODUCTS, EXCEPT BLOCK AND BRICK; READY-MIXED CONCRETE Organizations: CIRCLE M READY MIX INC (CONTACT/OWNER)
, DAVID MUILENBURG (CONTACT/OWNER)
Alternative names: DAVID MUILENBURG
J & J AUTO SUPPLY (PO BOX 338 in SPARTA, MO)
AIR MINOR (AIRS/AFS) STATE MASTER (Missouri monitoring and compilance) - AIRS/AFS-MO0926931, AIR MINOR Business SIC classification: MOTOR VEHICLE PARTS, USED
AENWOOD SUBDIVISION (MILLBROOKE DR in SPARTA, MO)
National Pollutant Discharge Elimination System NON-MAJOR (Tracking pollutant discharge elimination systems) - permit Business SIC classification: HEAVY CONSTRUCTION Organizations: TREEL CONSTRUCTION (CONTACT/OWNER)
Alternative names: TREEL CONSTRUCTION
ANCHOR HILL RANCH PHASE 3 (LIBERTY RD in SPARTA, MO)
National Pollutant Discharge Elimination System NON-MAJOR (Tracking pollutant discharge elimination systems) - permit Business SIC classification: HEAVY CONSTRUCTION Organizations: JOHN PRICE, PRICE SPRINGF (CONTACT/OWNER)
Alternative names: JOHN PRICE, PRICE SPRINGF
PARK HEIGHTS SUBDIVISION (DIVISION STREET in SPARTA, MO)
National Pollutant Discharge Elimination System NON-MAJOR (Tracking pollutant discharge elimination systems) - permit Business SIC classification: HEAVY CONSTRUCTION Organizations: BWP DEVELOPMENT, LLC (CONTACT/OWNER)
Alternative names: BWP DEVELOPMENT, LLC
JENKINS PROPERTY DEVELOPM (JENKINS RIDGE ROAD in SPARTA, MO)
National Pollutant Discharge Elimination System NON-MAJOR (Tracking pollutant discharge elimination systems) - permit Business SIC classification: HEAVY CONSTRUCTION Alternative names: JENKINS ESTATES
Housing units lacking complete plumbing facilities: 2.6% Housing units lacking complete kitchen facilities: 2.8%
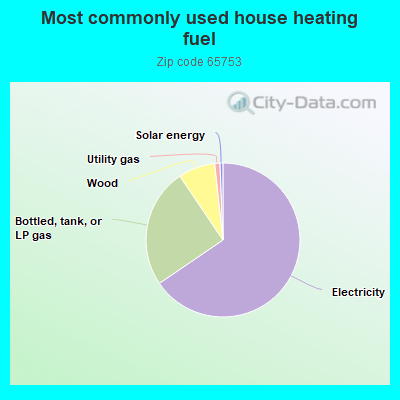
65.1%Electricity
24.9%Bottled, tank, or LP gas
7.7%Wood
1.1%Utility gas
0.6%Solar energy
Population in 1990: 1,879. Population change in the 1990s: +2,035 (+108.3%).
Place of birth for U.S.-born residents:
This state: 3,004
Northeast: 62
Midwest: 532
South: 533
West: 690
52% of the 65753 zip code residents lived in the same house 5 years ago. Out of people who lived in different houses, 48% lived in this county. Out of people who lived in different counties, 50% lived in Missouri.
96% of the 65753 zip code residents lived in the same house 1 year ago. Out of people who lived in different houses, 36% moved from this county. Out of people who lived in different houses, 33% moved from different county within same state. Out of people who lived in different houses, 40% moved from different state. Out of people who lived in different houses, 1% moved from abroad.
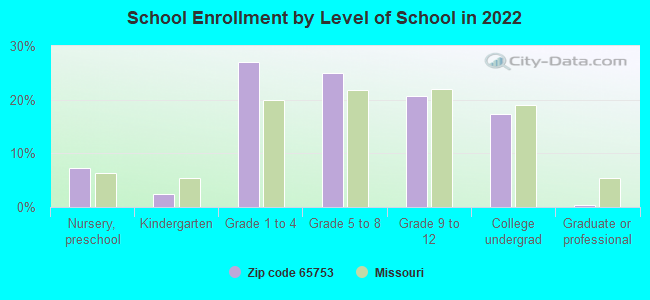
Private vs. public school enrollment:
Students in private schools in grades 1 to 8 (elementary and middle school): 93
Here:
20.4%
Missouri:
15.4%
Students in private schools in grades 9 to 12 (high school): 28
Here:
15.3%
Missouri:
13.9%
Students in private undergraduate colleges: 15
Here:
9.7%
Missouri:
22.6%
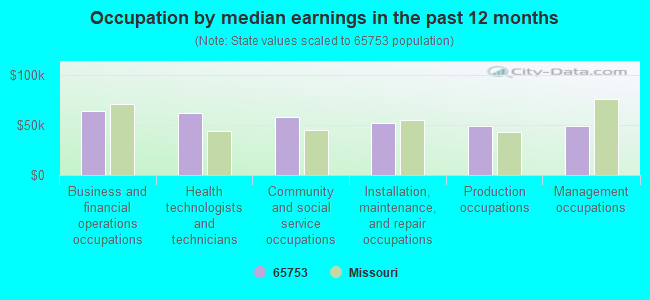
Occupation by median earnings in the past 12 months ($)
63,959Business and financial operations occupations
62,294Health technologists and technicians
57,960Community and social service occupations
51,846Installation, maintenance, and repair occupations
49,200Production occupations
48,461Management occupations
Top industries in this zip code by the number of employees in 2005:
Health Care and Social Assistance: Child Day Care Services (10-19 employees: 2 establishments)
Accommodation and Food Services: Full-Service Restaurants (10-19: 1, 5-9: 2)
Finance and Insurance: Commercial Banking (10-19: 1)
Health Care and Social Assistance: Offices of Physicians (except Mental Health Specialists) (10-19: 1)
Construction: Masonry Contractors (5-9: 1)
Fatal accident statistics in 2014:
Fatal accident count: 1
Vehicles involved in fatal accidents: 2
Fatal accidents caused by drunken drivers: 0
Fatalities: 1
Persons involved in fatal accidents: 3
Pedestrians involved in fatal accidents: 0
Fatal accident statistics in 2011:
Fatal accident count: 2
Vehicles involved in fatal accidents: 2
Fatal accidents caused by drunken drivers: 0
Fatalities: 2
Persons involved in fatal accidents: 2
Pedestrians involved in fatal accidents: 0
Home Mortgage Disclosure Act Aggregated Statistics For Year 2009 (Based on 6 partial tracts)
A) FHA, FSA/RHS & VA Home Purchase Loans
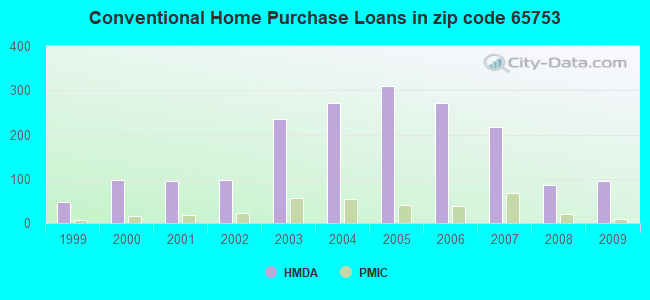
B) Conventional Home Purchase Loans
C) Refinancings
D) Home Improvement Loans
F) Non-occupant Loans on < 5 Family Dwellings (A B C & D)
G) Loans On Manufactured Home Dwelling (A B C & D)
Number
Average Value
Number
Average Value
Number
Average Value
Number
Average Value
Number
Average Value
Number
Average Value
LOANS ORIGINATED
84
$122,773
96
$128,140
317
$161,193
13
$44,093
34
$96,079
9
$65,979
APPLICATIONS APPROVED, NOT ACCEPTED
4
$151,165
2
$176,000
23
$135,533
0
$0
2
$120,790
1
$57,930
APPLICATIONS DENIED
16
$100,144
19
$115,775
99
$136,480
8
$52,648
3
$28,810
6
$43,298
APPLICATIONS WITHDRAWN
6
$148,757
8
$131,459
60
$148,466
4
$49,395
3
$91,683
2
$15,840
FILES CLOSED FOR INCOMPLETENESS
4
$112,732
0
$0
5
$126,880
1
$33,650
0
$0
0
$0
Aggregated Statistics For Year 2008 (Based on 6 partial tracts)
A) FHA, FSA/RHS & VA Home Purchase Loans
B) Conventional Home Purchase Loans
C) Refinancings
D) Home Improvement Loans
E) Loans on Dwellings For 5+ Families
F) Non-occupant Loans on < 5 Family Dwellings (A B C & D)
G) Loans On Manufactured Home Dwelling (A B C & D)
Number
Average Value
Number
Average Value
Number
Average Value
Number
Average Value
Number
Average Value
Number
Average Value
Number
Average Value
LOANS ORIGINATED
57
$122,027
87
$127,333
236
$143,874
22
$67,930
1
$560,820
42
$110,829
13
$58,469
APPLICATIONS APPROVED, NOT ACCEPTED
3
$87,433
5
$105,646
21
$137,355
1
$4,310
0
$0
1
$125,820
1
$4,310
APPLICATIONS DENIED
5
$104,068
21
$156,267
93
$144,296
27
$72,210
0
$0
4
$147,210
8
$96,178
APPLICATIONS WITHDRAWN
4
$102,918
9
$164,159
33
$139,470
1
$118,200
0
$0
4
$100,925
1
$36,210
FILES CLOSED FOR INCOMPLETENESS
1
$99,220
1
$120,790
7
$149,233
1
$27,160
0
$0
1
$190,090
0
$0
Aggregated Statistics For Year 2007 (Based on 6 partial tracts)
A) FHA, FSA/RHS & VA Home Purchase Loans
B) Conventional Home Purchase Loans
C) Refinancings
D) Home Improvement Loans
E) Loans on Dwellings For 5+ Families
F) Non-occupant Loans on < 5 Family Dwellings (A B C & D)
G) Loans On Manufactured Home Dwelling (A B C & D)
Number
Average Value
Number
Average Value
Number
Average Value
Number
Average Value
Number
Average Value
Number
Average Value
Number
Average Value
LOANS ORIGINATED
32
$108,922
218
$119,645
281
$140,352
37
$54,101
1
$366,690
53
$103,147
14
$68,950
APPLICATIONS APPROVED, NOT ACCEPTED
0
$0
19
$138,301
45
$109,634
5
$18,820
0
$0
4
$136,208
5
$71,510
APPLICATIONS DENIED
4
$106,290
46
$140,198
171
$130,531
43
$70,113
0
$0
15
$202,524
13
$77,305
APPLICATIONS WITHDRAWN
1
$62,460
19
$131,292
64
$146,538
4
$52,600
1
$181,040
5
$106,988
4
$71,962
FILES CLOSED FOR INCOMPLETENESS
1
$47,450
3
$116,900
24
$145,324
2
$38,045
0
$0
1
$124,240
0
$0
Aggregated Statistics For Year 2006 (Based on 6 partial tracts)
A) FHA, FSA/RHS & VA Home Purchase Loans
B) Conventional Home Purchase Loans
C) Refinancings
D) Home Improvement Loans
E) Loans on Dwellings For 5+ Families
F) Non-occupant Loans on < 5 Family Dwellings (A B C & D)
G) Loans On Manufactured Home Dwelling (A B C & D)
Number
Average Value
Number
Average Value
Number
Average Value
Number
Average Value
Number
Average Value
Number
Average Value
Number
Average Value
LOANS ORIGINATED
36
$107,560
271
$117,089
292
$129,683
32
$40,164
2
$2,139,745
50
$109,451
21
$47,790
APPLICATIONS APPROVED, NOT ACCEPTED
3
$125,020
38
$91,753
46
$142,238
4
$56,445
0
$0
5
$129,592
7
$52,906
APPLICATIONS DENIED
3
$100,220
84
$111,863
169
$131,222
28
$59,359
0
$0
7
$147,933
23
$67,575
APPLICATIONS WITHDRAWN
4
$94,528
41
$104,713
96
$132,361
8
$91,499
0
$0
6
$98,077
3
$50,660
FILES CLOSED FOR INCOMPLETENESS
1
$119,930
13
$140,822
29
$143,548
1
$9,050
0
$0
1
$223,470
1
$50,690
Aggregated Statistics For Year 2005 (Based on 6 partial tracts)
A) FHA, FSA/RHS & VA Home Purchase Loans
B) Conventional Home Purchase Loans
C) Refinancings
D) Home Improvement Loans
E) Loans on Dwellings For 5+ Families
F) Non-occupant Loans on < 5 Family Dwellings (A B C & D)
G) Loans On Manufactured Home Dwelling (A B C & D)
Number
Average Value
Number
Average Value
Number
Average Value
Number
Average Value
Number
Average Value
Number
Average Value
Number
Average Value
LOANS ORIGINATED
56
$100,439
310
$104,511
272
$111,307
26
$46,390
1
$375,660
67
$96,975
18
$50,205
APPLICATIONS APPROVED, NOT ACCEPTED
0
$0
27
$97,613
37
$104,236
9
$58,216
0
$0
1
$25,350
5
$69,886
APPLICATIONS DENIED
8
$117,532
74
$112,993
195
$110,082
25
$36,298
0
$0
12
$95,000
24
$53,024
APPLICATIONS WITHDRAWN
2
$97,065
37
$183,769
107
$118,237
13
$146,691
0
$0
8
$126,168
6
$85,692
FILES CLOSED FOR INCOMPLETENESS
0
$0
7
$112,284
19
$149,661
0
$0
0
$0
0
$0
0
$0
Aggregated Statistics For Year 2004 (Based on 6 partial tracts)
A) FHA, FSA/RHS & VA Home Purchase Loans
B) Conventional Home Purchase Loans
C) Refinancings
D) Home Improvement Loans
F) Non-occupant Loans on < 5 Family Dwellings (A B C & D)
G) Loans On Manufactured Home Dwelling (A B C & D)
Number
Average Value
Number
Average Value
Number
Average Value
Number
Average Value
Number
Average Value
Number
Average Value
LOANS ORIGINATED
69
$103,461
272
$102,254
278
$112,250
35
$33,969
57
$86,070
37
$49,536
APPLICATIONS APPROVED, NOT ACCEPTED
2
$84,555
34
$78,015
38
$109,165
6
$37,453
4
$73,660
5
$65,898
APPLICATIONS DENIED
4
$101,935
66
$82,413
148
$99,025
22
$34,010
8
$76,805
25
$49,120
APPLICATIONS WITHDRAWN
2
$93,840
37
$99,346
74
$99,045
7
$47,106
11
$98,115
6
$63,515
FILES CLOSED FOR INCOMPLETENESS
0
$0
4
$79,305
20
$87,570
4
$39,525
0
$0
1
$49,790
Aggregated Statistics For Year 2003 (Based on 6 partial tracts)
A) FHA, FSA/RHS & VA Home Purchase Loans
B) Conventional Home Purchase Loans
C) Refinancings
D) Home Improvement Loans
E) Loans on Dwellings For 5+ Families
F) Non-occupant Loans on < 5 Family Dwellings (A B C & D)
Number
Average Value
Number
Average Value
Number
Average Value
Number
Average Value
Number
Average Value
Number
Average Value
LOANS ORIGINATED
67
$95,348
235
$93,289
557
$102,440
15
$14,734
2
$630,830
57
$61,885
APPLICATIONS APPROVED, NOT ACCEPTED
3
$81,930
21
$79,763
54
$95,480
4
$36,070
0
$0
4
$101,080
APPLICATIONS DENIED
4
$99,528
49
$83,859
154
$100,999
15
$16,413
0
$0
13
$92,161
APPLICATIONS WITHDRAWN
7
$93,430
27
$95,050
85
$98,625
4
$16,775
0
$0
6
$104,540
FILES CLOSED FOR INCOMPLETENESS
2
$96,405
11
$69,791
23
$126,740
0
$0
0
$0
0
$0
Aggregated Statistics For Year 2002 (Based on 4 partial tracts)
A) FHA, FSA/RHS & VA Home Purchase Loans
B) Conventional Home Purchase Loans
C) Refinancings
D) Home Improvement Loans
F) Non-occupant Loans on < 5 Family Dwellings (A B C & D)
Number
Average Value
Number
Average Value
Number
Average Value
Number
Average Value
Number
Average Value
LOANS ORIGINATED
24
$85,240
97
$95,989
263
$104,545
11
$18,351
15
$68,614
APPLICATIONS APPROVED, NOT ACCEPTED
1
$73,320
14
$76,684
26
$100,268
3
$19,913
2
$67,435
APPLICATIONS DENIED
2
$80,565
24
$65,061
68
$79,564
5
$17,018
3
$63,363
APPLICATIONS WITHDRAWN
3
$51,293
11
$80,727
33
$99,682
0
$0
1
$131,250
FILES CLOSED FOR INCOMPLETENESS
1
$46,170
0
$0
8
$115,979
1
$22,630
0
$0
Aggregated Statistics For Year 2001 (Based on 4 partial tracts)
A) FHA, FSA/RHS & VA Home Purchase Loans
B) Conventional Home Purchase Loans
C) Refinancings
D) Home Improvement Loans
E) Loans on Dwellings For 5+ Families
F) Non-occupant Loans on < 5 Family Dwellings (A B C & D)
Number
Average Value
Number
Average Value
Number
Average Value
Number
Average Value
Number
Average Value
Number
Average Value
LOANS ORIGINATED
24
$83,542
94
$73,138
235
$85,570
15
$21,544
1
$593,810
28
$52,825
APPLICATIONS APPROVED, NOT ACCEPTED
0
$0
10
$54,493
18
$73,924
3
$12,673
0
$0
0
$0
APPLICATIONS DENIED
2
$83,730
22
$45,136
73
$73,210
9
$24,943
0
$0
2
$39,830
APPLICATIONS WITHDRAWN
1
$55,220
6
$112,547
39
$73,693
4
$8,600
0
$0
1
$84,180
FILES CLOSED FOR INCOMPLETENESS
0
$0
1
$105,000
15
$86,779
0
$0
0
$0
0
$0
Aggregated Statistics For Year 2000 (Based on 4 partial tracts)
A) FHA, FSA/RHS & VA Home Purchase Loans
B) Conventional Home Purchase Loans
C) Refinancings
D) Home Improvement Loans
F) Non-occupant Loans on < 5 Family Dwellings (A B C & D)
Number
Average Value
Number
Average Value
Number
Average Value
Number
Average Value
Number
Average Value
LOANS ORIGINATED
16
$78,413
97
$64,698
74
$74,080
18
$21,322
22
$60,566
APPLICATIONS APPROVED, NOT ACCEPTED
2
$42,995
14
$62,006
22
$67,684
6
$13,880
1
$4,530
APPLICATIONS DENIED
3
$60,347
73
$48,323
47
$65,136
12
$20,442
3
$66,080
APPLICATIONS WITHDRAWN
2
$59,745
9
$77,444
21
$61,166
2
$15,390
3
$21,120
FILES CLOSED FOR INCOMPLETENESS
0
$0
3
$51,597
2
$87,350
0
$0
0
$0
Aggregated Statistics For Year 1999 (Based on 2 partial tracts)
A) FHA, FSA/RHS & VA Home Purchase Loans
B) Conventional Home Purchase Loans
C) Refinancings
D) Home Improvement Loans
F) Non-occupant Loans on < 5 Family Dwellings (A B C & D)
Detailed PMIC statistics for the following Tracts:0203.02
, 0204.00
2002 - 2018 National Fire Incident Reporting System (NFIRS) incidents
According to the data from the years 2002 - 2018 the average number of fire incidents per year is 23. The highest number of fires - 55 took place in 2010, and the least - 2 in 2002. The data has an increasing trend.
When looking into fire subcategories, the most reports belonged to: Outside Fires (55.8%), and Structure Fires (30.5%).
Fire incident types reported to NFIRS in Zip Code 65753

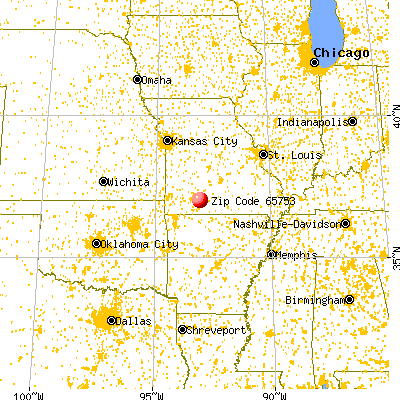


 Nearest zip codes: 65620, 65720, 65629, 65742, 65652, 65721.
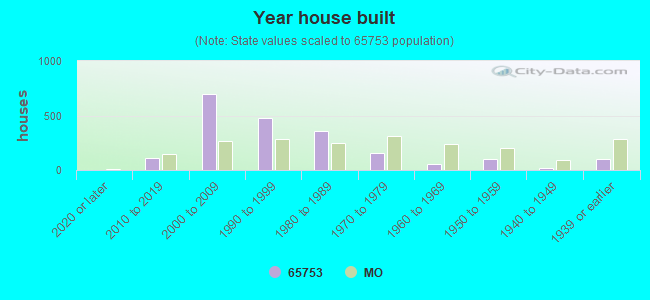


 According to the data from the years 2002 - 2018 the average number of fire incidents per year is 23. The highest number of fires - 55 took place in 2010, and the least - 2 in 2002. The data has an increasing trend.
 When looking into fire subcategories, the most reports belonged to: Outside Fires (55.8%), and Structure Fires (30.5%).