Estimated zip code population in 2022: 907 Zip code population in 2010: 737 Zip code population in 2000: 744
Houses and condos: 367 Renter-occupied apartments: 60
% of renters here:
19%
State:
32%
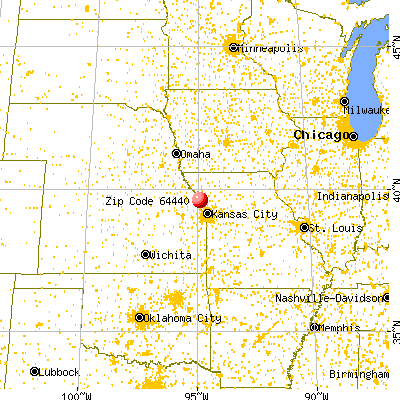
March 2022 cost of living index in zip code 64440: 76.3 (low, U.S. average is 100)
Land area: 37.7 sq. mi. Water area: 0.0 sq. mi.
Population density: 24 people per square mile
(very low).
OSM Map
General Map
Google Map
MSN Map
OSM Map
General Map
Google Map
MSN Map
OSM Map
General Map
Google Map
MSN Map
OSM Map
General Map
Google Map
MSN Map
Please wait while loading the map...
Real estate property taxes paid for housing units in 2022:
This zip code:
0.6% ($1,283)
Missouri:
0.8% ($1,810)
Median real estate property taxes paid for housing units with mortgages in 2022: $914 (0.5%) Median real estate property taxes paid for housing units with no mortgage in 2022: $1,514 (0.6%)
Business Search- 14 Million verified businesses
Males: 455
(50.1%)
Females: 452
(49.9%)
For population 25 years and over in 64440:
High school or higher: 89.5%
Bachelor's degree or higher: 17.9%
Graduate or professional degree: 3.7%
Mean travel time to work (commute): 29.4 minutes
For population 15 years and over in 64440:
Never married: 31.6%
Now married: 56.3%
Separated: 1.2%
Widowed: 3.7%
Divorced: 7.2%
Zip code 64440 compared to state average:
Unemployed percentage significantly below state average.
Black race population percentage significantly below state average.
Hispanic race population percentage significantly below state average.
Foreign-born population percentage significantly below state average.
Renting percentage below state average.
Length of stay since moving in significantly above state average.
Number of college students significantly below state average.
Percentage of population with a bachelor's degree or higher below state average.
Averages for the 2020 tax year for zip code 64440, filed in 2021:
Average Adjusted Gross Income (AGI) in 2020: $65,623 (Individual Income Tax Returns)
Here:
$65,623
State:
$68,151
Salary/wage: $55,834 (reported on 82.9% of returns)
Here:
$55,834
State:
$56,131
(% of AGI for various income ranges: 1158.0% for AGIs below $25k, 3312.9% for AGIs $25k-50k, 7102.5% for AGIs $50k-75k, 9526.7% for AGIs $75k-100k, 15190.0% for AGIs $100k-200k)
Taxable interest for individuals: $483 (reported on 34.3% of returns)
This zip code:
$483
Missouri:
$1,586
(% of AGI for various income ranges: 22.9% for AGIs $25k-50k, 42.5% for AGIs $50k-75k, 50.0% for AGIs $100k-200k)
Ordinary dividends: $3,575 (reported on 11.4% of returns)
Here:
$3,575
State:
$10,947
(% of AGI for various income ranges: 86.0% for AGIs below $25k, 333.3% for AGIs $75k-100k)
Net capital gain/loss in AGI: +$4,425 (reported on 11.4% of returns)
Here:
+$4,425
State:
+$18,453
(% of AGI for various income ranges: 442.5% for AGIs $50k-75k)
Profit/loss from business: +$5,633 (reported on 17.1% of returns)
Here:
+$5,633
State:
+$12,260
(% of AGI for various income ranges: 582.0% for AGIs below $25k, 117.5% for AGIs $50k-75k)
Taxable individual retirement arrangement distribution: $12,267 (reported on 8.6% of returns)
64440:
$12,267
Missouri:
$19,719
(% of AGI for various income ranges: 525.7% for AGIs $25k-50k)
Earned income credit: $1,825 (reported on 11.4% of returns)
Here:
$1,825
State:
$2,315
(% of AGI for various income ranges: 104.3% for AGIs $25k-50k)
Percentage of individuals using paid preparers for their 2020 taxes: 97.1%
Here:
97%
State:
93%
(% for various income ranges: 100.0% for AGIs below $25k, 88.9% for AGIs $25k-50k, 100.0% for AGIs $50k-75k, 100.0% for AGIs $75k-100k, 100.0% for AGIs $100k-200k)
Averages for the 2012 tax year for zip code 64440, filed in 2013:
Average Adjusted Gross Income (AGI) in 2012: $53,900 (Individual Income Tax Returns)
Here:
$53,900
State:
$55,896
Salary/wage: $47,689 (reported on 80.0% of returns)
Here:
$47,689
State:
$46,205
(% of AGI for various income ranges: 80.6% for AGIs below $25k, 85.9% for AGIs $25k-50k, 79.7% for AGIs $50k-75k, 73.9% for AGIs $75k-100k, 58.5% for AGIs $100k-200k)
Taxable interest for individuals: $662 (reported on 37.1% of returns)
This zip code:
$662
Missouri:
$1,559
(% of AGI for various income ranges: 2.0% for AGIs below $25k, 0.2% for AGIs $25k-50k, 0.4% for AGIs $75k-100k, 0.5% for AGIs $100k-200k)
Ordinary dividends: $433 (reported on 8.6% of returns)
Here:
$433
State:
$7,410
Net capital gain/loss in AGI: +$1,225 (reported on 11.4% of returns)
Here:
+$1,225
State:
+$11,579
Profit/loss from business: +$2,250 (reported on 11.4% of returns)
Here:
+$2,250
State:
+$11,688
Taxable individual retirement arrangement distribution: $12,000 (reported on 8.6% of returns)
64440:
$12,000
Missouri:
$14,773
Total itemized deductions: $21,443 (19% of AGI, reported on 20.0% of returns)
Here:
$21,443
State:
$22,730
Here:
19.3% of AGI
State:
19.2% of AGI
Charity contributions: $3,867 (reported on 17.1% of returns)
Here:
$3,867
State:
$4,745
(% of AGI for various income ranges: 2.9% for AGIs $25k-50k, 1.7% for AGIs $100k-200k)
Taxes paid: $5,538 (reported on 22.9% of returns)
64440:
$5,538
State:
$8,399
Earned income credit: $2,280 (reported on 14.3% of returns)
Here:
$2,280
State:
$2,288
(% of AGI for various income ranges: 8.9% for AGIs below $25k)
Percentage of individuals using paid preparers for their 2012 taxes: 62.9%
Here:
63%
State:
55%
(% for various income ranges: 58.3% for AGIs below $25k, 55.6% for AGIs $25k-50k, 60.0% for AGIs $50k-75k, 75.0% for AGIs $75k-100k, 80.0% for AGIs $100k-200k)
Averages for the 2004 tax year for zip code 64440, filed in 2005:
Average Adjusted Gross Income (AGI) in 2004: $39,761 (Individual Income Tax Returns)
Here:
$39,761
State:
$44,591
Salary/wage: $39,992 (reported on 80.3% of returns)
Here:
$39,992
State:
$38,941
(% of AGI for various income ranges: 70.0% for AGIs below $10k, 60.0% for AGIs $10k-25k, 81.0% for AGIs $25k-50k, 79.8% for AGIs $50k-75k, 88.2% for AGIs $75k-100k, 86.2% for AGIs over 100k)
Taxable interest for individuals: $1,029 (reported on 44.9% of returns)
This zip code:
$1,029
Missouri:
$1,801
(% of AGI for various income ranges: 4.5% for AGIs below $10k, 5.5% for AGIs $10k-25k, 0.8% for AGIs $25k-50k, 1.1% for AGIs $50k-75k, 0.4% for AGIs $75k-100k)
Taxable dividends: $370 (reported on 15.1% of returns)
Here:
$370
State:
$3,677
(% of AGI for various income ranges: 2.4% for AGIs below $10k, 0.1% for AGIs $25k-50k, 0.1% for AGIs $50k-75k, 0.1% for AGIs $75k-100k)
Net capital gain/loss: +$29 (reported on 11.1% of returns)
Here:
+$29
State:
+$8,915
Profit/loss from business: +$2,341 (reported on 13.4% of returns)
Here:
+$2,341
State:
+$9,793
Total itemized deductions: $15,513 (23% of AGI, reported on 25.6% of returns)
Here:
$15,513
State:
$18,261
Here:
23.4% of AGI
State:
20.5% of AGI
(% of AGI for various income ranges: 46.8% for AGIs below $10k, 8.2% for AGIs $25k-50k, 8.0% for AGIs $50k-75k, 10.6% for AGIs $75k-100k, 14.8% for AGIs over 100k)
Charity contributions deductions: $2,345 (3% of AGI, reported on 18.0% of returns)
Here:
$2,345
State:
$3,665
Here:
3.3% of AGI
State:
3.9% of AGI
(% of AGI for various income ranges: 1.9% for AGIs $10k-25k, 1.3% for AGIs $50k-75k, 1.2% for AGIs $75k-100k, 1.9% for AGIs over 100k)
Total tax: $4,485 (reported on 77.7% of returns)
64440:
$4,485
State:
$6,999
(% of AGI for various income ranges: 1.8% for AGIs below $10k, 4.5% for AGIs $10k-25k, 6.9% for AGIs $25k-50k, 8.4% for AGIs $50k-75k, 9.7% for AGIs $75k-100k, 14.9% for AGIs over 100k)
Earned income credit: $1,667 (reported on 11.8% of returns)
Here:
$1,667
State:
$1,728
Percentage of individuals using paid preparers for their 2004 taxes: 71.1%
Here:
71%
State:
62%
(% for various income ranges: 54.0% for AGIs below $10k, 70.2% for AGIs $10k-25k, 79.5% for AGIs $25k-50k, 75.8% for AGIs $50k-75k, 65.4% for AGIs $75k-100k, 92.9% for AGIs over 100k)
Household received Food Stamps/SNAP in the past 12 months: 13 Household did not receive Food Stamps/SNAP in the past 12 months: 307
Women who had a birth in the past 12 months: 10 (10 now married, 0 unmarried) Women who did not have a birth in the past 12 months: 178 (88 now married, 89 unmarried)
Housing units in zip code 64440 with a mortgage: 113 (14 second mortgage, 13 both second mortgage and home equity loan) Houses without a mortgage: 1
Median monthly owner costs for units with a mortgage: $1,166 Median monthly owner costs for units without a mortgage: $563
Residents with income below the poverty level in 2022:
This zip code:
12.3%
Whole state:
13.2%
Residents with income below 50% of the poverty level in 2022:
This zip code:
5.3%
Whole state:
6.8%
Median number of rooms in houses and condos:
Here:
6.2
State:
6.4
Median number of rooms in apartments:
Here:
5.1
State:
4.4
Notable locations in this zip code not listed on our city pages
Size of family households: 112 2-persons, 36 3-persons, 53 4-persons, 28 5-persons, 9 6-persons, 4 7-or-more-persons
Size of nonfamily households: 40 1-person, 34 2-persons
149 married couples with children.
108 single-parent households (46 men, 62 women).
99.9% of residents of 64440 zip code speak English at home.
0.1% of residents speak other Indo-European language at home (100% very well).
Foreign born population: 0 (0.0%)
:
0.0%
Whole state:
4.1%
50%American
22%Irish
10%European
8%English
5%German
3%Polish
2%Swedish
Facilities with environmental interests located in this zip code:
BUCHANAN COUNTY R-4 SCH DISTRICT (702 MAIN ST in DE KALB, MO)
(Integrated Compliance Information System) - ICIS-07-1999-0083, FORMAL ENFORCEMENT ACTION STATE MASTER (Missouri monitoring and compilance) - ICIS-26744, ENFORCEMENT/COMPLIANCE ACTIVITY
BUCHANAN COUNTY R-4 (P.O. BOX 48 in DE KALB, MO)
STATE MASTER (Missouri monitoring and compilance) - NCDB-C07#07-98-T-254, COMPLIANCE ACTIVITY, NCDB-I07#19980512N7015 1, COMPLIANCE ACTIVITY (Tracking inspections of insecticide, fungicide, and rodenticide, and toxic substances)
REDDICK FARMS - DAVE REDDICK (P.O. BOX 1065 in DEKALB, MO)
STATE MASTER (Missouri monitoring and compilance) - NCDB-C07#20020717N70191B, COMPLIANCE ACTIVITY COMPLIANCE ACTIVITY (Tracking inspections of insecticide, fungicide, and rodenticide, and toxic substances)
Housing units lacking complete plumbing facilities: 1.5% Housing units lacking complete kitchen facilities: 5.2%
52.7%Electricity
34.7%Bottled, tank, or LP gas
9.0%Wood
1.3%Fuel oil, kerosene, etc.
1.0%Utility gas
1.0%Other fuel
1.0%No fuel used
Population in 1990: 584. Population change in the 1990s: +160 (+27.4%).
Place of birth for U.S.-born residents:
This state: 655
Northeast: 4
Midwest: 203
South: 24
West: 20
65% of the 64440 zip code residents lived in the same house 5 years ago. Out of people who lived in different houses, 55% lived in this county. Out of people who lived in different counties, 50% lived in Missouri.
95% of the 64440 zip code residents lived in the same house 1 year ago. Out of people who lived in different houses, 71% moved from this county. Out of people who lived in different houses, 18% moved from different county within same state. Out of people who lived in different houses, 7% moved from different state.
Private vs. public school enrollment:
Students in private schools in grades 1 to 8 (elementary and middle school):
Here:
0.0%
Missouri:
15.4%
Students in private schools in grades 9 to 12 (high school):
Here:
0.0%
Missouri:
13.9%
Students in private undergraduate colleges:
Here:
31.8%
Missouri:
22.6%
Occupation by median earnings in the past 12 months ($)
67,961Installation, maintenance, and repair occupations
63,617Management occupations
62,933Transportation occupations
57,747Construction and extraction occupations
54,725Production occupations
50,935Business and financial operations occupations
Top industries in this zip code by the number of employees in 2005:
Finance and Insurance: Insurance Agencies and Brokerages (1-4 employees: 2 establishments)
Accommodation and Food Services: Full-Service Restaurants (1-4: 1)
Administrative and Support and Waste Management and Remediation Services: Janitorial Services (1-4: 1)
Construction: New Single-Family Housing Construction (except Operative Builders) (1-4: 1)
Professional, Scientific, and Technical Services: Marketing Consulting Services (1-4: 1)
Other Services (except Public Administration): Religious Organizations (1-4: 1)
Finance and Insurance: Sales Financing (1-4: 1)
Fatal accident statistics in 2012:
Fatal accident count: 1
Vehicles involved in fatal accidents: 1
Fatal accidents caused by drunken drivers: 0
Fatalities: 1
Persons involved in fatal accidents: 1
Pedestrians involved in fatal accidents: 0
Home Mortgage Disclosure Act Aggregated Statistics For Year 2009 (Based on 2 partial tracts)
A) FHA, FSA/RHS & VA Home Purchase Loans
B) Conventional Home Purchase Loans
C) Refinancings
D) Home Improvement Loans
E) Loans on Dwellings For 5+ Families
F) Non-occupant Loans on < 5 Family Dwellings (A B C & D)
G) Loans On Manufactured Home Dwelling (A B C & D)
Number
Average Value
Number
Average Value
Number
Average Value
Number
Average Value
Number
Average Value
Number
Average Value
Number
Average Value
LOANS ORIGINATED
3
$118,410
9
$104,374
32
$128,799
1
$73,910
1
$220,640
6
$136,613
2
$44,955
APPLICATIONS APPROVED, NOT ACCEPTED
1
$74,470
1
$8,270
3
$120,983
0
$0
0
$0
1
$8,270
1
$68,950
APPLICATIONS DENIED
0
$0
2
$20,135
20
$97,468
3
$57,000
0
$0
1
$7,170
4
$76,398
APPLICATIONS WITHDRAWN
2
$115,285
2
$45,505
15
$113,556
2
$58,195
0
$0
1
$27,580
1
$93,770
FILES CLOSED FOR INCOMPLETENESS
1
$48,540
0
$0
1
$131,280
1
$86,600
0
$0
0
$0
1
$53,510
Aggregated Statistics For Year 2008 (Based on 2 partial tracts)
A) FHA, FSA/RHS & VA Home Purchase Loans
B) Conventional Home Purchase Loans
C) Refinancings
D) Home Improvement Loans
F) Non-occupant Loans on < 5 Family Dwellings (A B C & D)
G) Loans On Manufactured Home Dwelling (A B C & D)
Number
Average Value
Number
Average Value
Number
Average Value
Number
Average Value
Number
Average Value
Number
Average Value
LOANS ORIGINATED
3
$97,633
10
$97,744
25
$123,228
10
$41,039
6
$81,637
6
$47,345
APPLICATIONS APPROVED, NOT ACCEPTED
0
$0
1
$77,220
6
$116,203
1
$10,480
1
$38,060
0
$0
APPLICATIONS DENIED
1
$98,740
2
$40,265
26
$113,863
4
$29,788
1
$81,640
2
$70,880
APPLICATIONS WITHDRAWN
0
$0
2
$110,870
7
$184,471
1
$19,860
1
$75,570
1
$95,980
FILES CLOSED FOR INCOMPLETENESS
0
$0
0
$0
0
$0
0
$0
0
$0
0
$0
Aggregated Statistics For Year 2007 (Based on 2 partial tracts)
A) FHA, FSA/RHS & VA Home Purchase Loans
B) Conventional Home Purchase Loans
C) Refinancings
D) Home Improvement Loans
F) Non-occupant Loans on < 5 Family Dwellings (A B C & D)
G) Loans On Manufactured Home Dwelling (A B C & D)
Number
Average Value
Number
Average Value
Number
Average Value
Number
Average Value
Number
Average Value
Number
Average Value
LOANS ORIGINATED
3
$112,710
15
$102,119
20
$92,834
6
$26,202
6
$79,890
7
$58,233
APPLICATIONS APPROVED, NOT ACCEPTED
0
$0
2
$150,310
4
$155,412
1
$74,470
0
$0
3
$57,367
APPLICATIONS DENIED
1
$144,520
4
$75,155
24
$119,835
6
$63,985
2
$55,160
5
$74,576
APPLICATIONS WITHDRAWN
0
$0
1
$22,060
8
$86,808
0
$0
1
$44,680
1
$22,060
FILES CLOSED FOR INCOMPLETENESS
0
$0
1
$174,310
2
$137,350
1
$27,580
1
$27,580
0
$0
Aggregated Statistics For Year 2006 (Based on 2 partial tracts)
A) FHA, FSA/RHS & VA Home Purchase Loans
B) Conventional Home Purchase Loans
C) Refinancings
D) Home Improvement Loans
F) Non-occupant Loans on < 5 Family Dwellings (A B C & D)
G) Loans On Manufactured Home Dwelling (A B C & D)
Number
Average Value
Number
Average Value
Number
Average Value
Number
Average Value
Number
Average Value
Number
Average Value
LOANS ORIGINATED
3
$93,587
21
$81,295
28
$111,778
7
$30,023
7
$78,406
2
$52,400
APPLICATIONS APPROVED, NOT ACCEPTED
0
$0
2
$73,365
8
$86,256
4
$28,820
0
$0
0
$0
APPLICATIONS DENIED
1
$13,240
15
$85,351
35
$91,660
6
$44,403
1
$77,220
3
$27,030
APPLICATIONS WITHDRAWN
0
$0
3
$84,027
8
$135,625
2
$54,335
1
$38,610
1
$38,610
FILES CLOSED FOR INCOMPLETENESS
0
$0
1
$48,540
2
$78,325
0
$0
0
$0
0
$0
Aggregated Statistics For Year 2005 (Based on 2 partial tracts)
A) FHA, FSA/RHS & VA Home Purchase Loans
B) Conventional Home Purchase Loans
C) Refinancings
D) Home Improvement Loans
F) Non-occupant Loans on < 5 Family Dwellings (A B C & D)
G) Loans On Manufactured Home Dwelling (A B C & D)
Number
Average Value
Number
Average Value
Number
Average Value
Number
Average Value
Number
Average Value
Number
Average Value
LOANS ORIGINATED
2
$70,055
11
$84,094
32
$92,479
3
$26,660
6
$52,678
4
$77,225
APPLICATIONS APPROVED, NOT ACCEPTED
1
$10,480
1
$30,340
8
$80,120
1
$54,060
1
$36,960
1
$29,790
APPLICATIONS DENIED
0
$0
7
$53,269
31
$98,950
6
$44,772
2
$108,665
2
$52,125
APPLICATIONS WITHDRAWN
1
$50,750
2
$83,290
23
$100,367
4
$137,488
0
$0
1
$41,370
FILES CLOSED FOR INCOMPLETENESS
0
$0
0
$0
3
$102,230
0
$0
0
$0
0
$0
Aggregated Statistics For Year 2004 (Based on 2 partial tracts)
A) FHA, FSA/RHS & VA Home Purchase Loans
B) Conventional Home Purchase Loans
C) Refinancings
D) Home Improvement Loans
F) Non-occupant Loans on < 5 Family Dwellings (A B C & D)
G) Loans On Manufactured Home Dwelling (A B C & D)
Number
Average Value
Number
Average Value
Number
Average Value
Number
Average Value
Number
Average Value
Number
Average Value
LOANS ORIGINATED
1
$36,960
9
$93,772
39
$85,357
4
$17,650
2
$157,205
4
$61,090
APPLICATIONS APPROVED, NOT ACCEPTED
0
$0
2
$105,080
8
$94,806
1
$7,170
0
$0
1
$39,720
APPLICATIONS DENIED
0
$0
4
$72,260
32
$72,794
4
$21,788
2
$58,745
2
$45,505
APPLICATIONS WITHDRAWN
0
$0
1
$277,450
22
$91,064
2
$23,995
1
$71,710
2
$69,775
FILES CLOSED FOR INCOMPLETENESS
0
$0
1
$97,080
3
$132,017
0
$0
0
$0
0
$0
Aggregated Statistics For Year 2003 (Based on 2 partial tracts)
A) FHA, FSA/RHS & VA Home Purchase Loans
B) Conventional Home Purchase Loans
C) Refinancings
D) Home Improvement Loans
F) Non-occupant Loans on < 5 Family Dwellings (A B C & D)
Number
Average Value
Number
Average Value
Number
Average Value
Number
Average Value
Number
Average Value
LOANS ORIGINATED
2
$63,435
9
$96,591
48
$76,983
4
$42,335
4
$50,058
APPLICATIONS APPROVED, NOT ACCEPTED
1
$70,600
2
$51,575
4
$64,400
0
$0
0
$0
APPLICATIONS DENIED
1
$24,820
10
$61,393
23
$78,639
2
$23,995
1
$78,880
APPLICATIONS WITHDRAWN
1
$31,990
4
$94,322
19
$91,536
0
$0
1
$11,580
FILES CLOSED FOR INCOMPLETENESS
0
$0
1
$59,020
1
$76,120
0
$0
0
$0
Aggregated Statistics For Year 2002 (Based on 2 partial tracts)
A) FHA, FSA/RHS & VA Home Purchase Loans
B) Conventional Home Purchase Loans
C) Refinancings
D) Home Improvement Loans
F) Non-occupant Loans on < 5 Family Dwellings (A B C & D)
Number
Average Value
Number
Average Value
Number
Average Value
Number
Average Value
Number
Average Value
LOANS ORIGINATED
1
$76,120
11
$86,451
40
$90,807
4
$13,378
3
$54,610
APPLICATIONS APPROVED, NOT ACCEPTED
1
$125,210
1
$83,290
7
$69,580
1
$8,270
0
$0
APPLICATIONS DENIED
0
$0
3
$56,813
15
$71,635
5
$17,430
1
$21,510
APPLICATIONS WITHDRAWN
0
$0
1
$49,640
15
$81,269
1
$18,750
0
$0
FILES CLOSED FOR INCOMPLETENESS
0
$0
1
$28,130
0
$0
0
$0
1
$14,890
Aggregated Statistics For Year 2001 (Based on 2 partial tracts)
A) FHA, FSA/RHS & VA Home Purchase Loans
B) Conventional Home Purchase Loans
C) Refinancings
D) Home Improvement Loans
F) Non-occupant Loans on < 5 Family Dwellings (A B C & D)
Number
Average Value
Number
Average Value
Number
Average Value
Number
Average Value
Number
Average Value
LOANS ORIGINATED
2
$107,010
7
$49,486
20
$76,617
5
$108,886
1
$22,060
APPLICATIONS APPROVED, NOT ACCEPTED
0
$0
2
$26,475
2
$119,420
0
$0
0
$0
APPLICATIONS DENIED
0
$0
6
$67,478
10
$73,970
4
$15,582
1
$20,410
APPLICATIONS WITHDRAWN
1
$29,790
0
$0
3
$90,830
0
$0
0
$0
FILES CLOSED FOR INCOMPLETENESS
0
$0
1
$81,640
3
$111,240
0
$0
1
$5,520
Aggregated Statistics For Year 2000 (Based on 2 partial tracts)
A) FHA, FSA/RHS & VA Home Purchase Loans
B) Conventional Home Purchase Loans
C) Refinancings
D) Home Improvement Loans
F) Non-occupant Loans on < 5 Family Dwellings (A B C & D)
Number
Average Value
Number
Average Value
Number
Average Value
Number
Average Value
Number
Average Value
LOANS ORIGINATED
2
$77,775
10
$67,571
10
$82,133
6
$13,238
1
$103,700
APPLICATIONS APPROVED, NOT ACCEPTED
0
$0
2
$104,530
2
$67,295
2
$10,205
1
$55,160
APPLICATIONS DENIED
0
$0
4
$65,365
7
$55,003
1
$15,440
1
$18,750
APPLICATIONS WITHDRAWN
0
$0
2
$41,645
3
$59,940
1
$27,580
0
$0
FILES CLOSED FOR INCOMPLETENESS
0
$0
0
$0
1
$17,100
1
$13,240
0
$0
Aggregated Statistics For Year 1999 (Based on 1 partial tract)
A) FHA, FSA/RHS & VA Home Purchase Loans
B) Conventional Home Purchase Loans
C) Refinancings
D) Home Improvement Loans
F) Non-occupant Loans on < 5 Family Dwellings (A B C & D)
Detailed PMIC statistics for the following Tracts:0029.00
2002 - 2018 National Fire Incident Reporting System (NFIRS) incidents
According to the data from the years 2002 - 2018 the average number of fire incidents per year is 10. The highest number of fire incidents - 18 took place in 2012, and the least - 4 in 2010. The data has a constant trend.
When looking into fire subcategories, the most reports belonged to: Outside Fires (44.7%), and Structure Fires (26.5%).
Fire incident types reported to NFIRS in Zip Code 64440


 Nearest zip codes: 64448, 64504, 64484, 64098, 66024, 64439.


 According to the data from the years 2002 - 2018 the average number of fire incidents per year is 10. The highest number of fire incidents - 18 took place in 2012, and the least - 4 in 2010. The data has a constant trend.
 When looking into fire subcategories, the most reports belonged to: Outside Fires (44.7%), and Structure Fires (26.5%).