Estimated zip code population in 2022: 297 Zip code population in 2010: 278 Zip code population in 2000: 248
March 2022 cost of living index in zip code 64166: 76.2 (low, U.S. average is 100)
Land area: 5.0 sq. mi. Water area: 0.0 sq. mi.
Population density: 60 people per square mile
(very low).
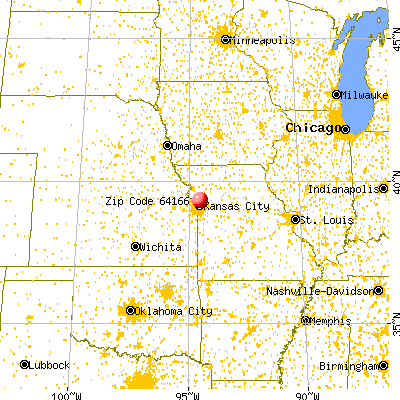
OSM Map
General Map
Google Map
MSN Map
OSM Map
General Map
Google Map
MSN Map
OSM Map
General Map
Google Map
MSN Map
OSM Map
General Map
Google Map
MSN Map
Please wait while loading the map...
Real estate property taxes paid for housing units in 2022:
This zip code:
1.0% ($3,378)
Missouri:
0.8% ($1,810)
Median real estate property taxes paid for housing units with mortgages in 2022: $3,216 (0.7%) Median real estate property taxes paid for housing units with no mortgage in 2022: $3,511 (1.1%)
Business Search- 14 Million verified businesses
Males: 180
(60.7%)
Females: 116
(39.3%)
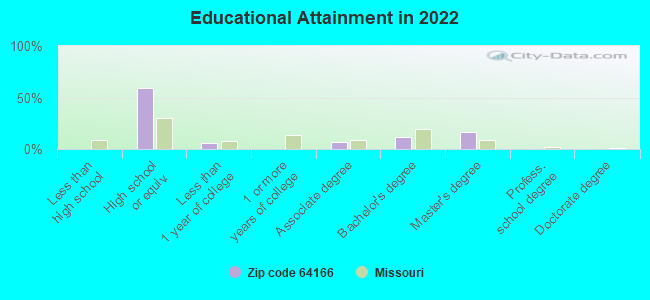
For population 25 years and over in 64166:
High school or higher: 99.9%
Bachelor's degree or higher: 28.9%
Graduate or professional degree: 16.9%
Mean travel time to work (commute): 7.6 minutes
For population 15 years and over in 64166:
Never married: 17.3%
Now married: 68.0%
Separated: 0.0%
Widowed: 7.3%
Divorced: 7.4%
Zip code 64166 compared to state average:
Median household income significantly below state average.
Unemployed percentage significantly below state average.
Black race population percentage significantly below state average.
Hispanic race population percentage significantly below state average.
Median age significantly above state average.
Foreign-born population percentage significantly below state average.
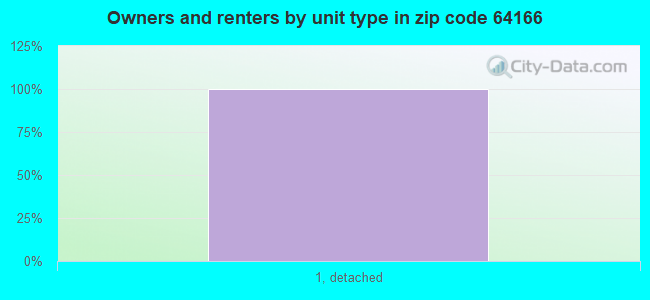
Renting percentage significantly below state average.
Length of stay since moving in significantly above state average.
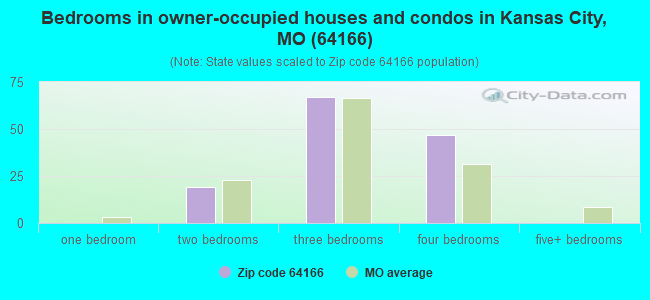
Number of rooms per house above state average.
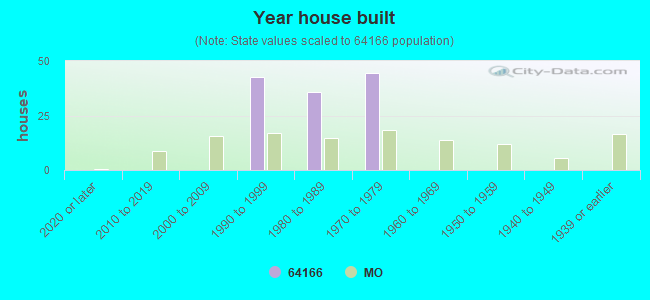
House age below state average.
Number of college students significantly below state average.
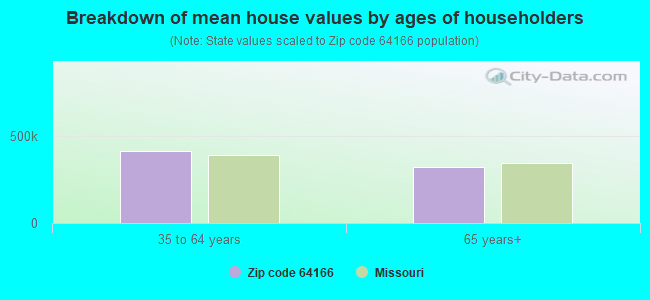
Estimated median house/condo value in 2022: $329,581
64166:
$329,581
Missouri:
$221,200
Median resident age:
This zip code:
60.9 years
Missouri median age:
39.1 years
Average household size:
This zip code:
2.2 people
Missouri:
2.4 people
Averages for the 2020 tax year for zip code 64166, filed in 2021:
Average Adjusted Gross Income (AGI) in 2020: $84,000 (Individual Income Tax Returns)
Here:
$84,000
State:
$68,151
Salary/wage: $75,458 (reported on 75.0% of returns)
Here:
$75,458
State:
$56,131
(% of AGI for various income ranges: 1276.7% for AGIs below $25k, 5287.5% for AGIs $25k-50k, 21856.7% for AGIs $100k-200k)
Taxable interest for individuals: $450 (reported on 50.0% of returns)
This zip code:
$450
Missouri:
$1,586
(% of AGI for various income ranges: 27.5% for AGIs $25k-50k, 83.3% for AGIs $100k-200k)
Ordinary dividends: $1,167 (reported on 37.5% of returns)
Here:
$1,167
State:
$10,947
(% of AGI for various income ranges: 150.0% for AGIs below $25k, 83.3% for AGIs $100k-200k)
Net capital gain/loss in AGI: +$3,075 (reported on 25.0% of returns)
Here:
+$3,075
State:
+$18,453
(% of AGI for various income ranges: 410.0% for AGIs $100k-200k)
Percentage of individuals using paid preparers for their 2020 taxes: 93.8%
Here:
94%
State:
93%
(% for various income ranges: 80.0% for AGIs below $25k, 100.0% for AGIs $25k-50k, 100.0% for AGIs $75k-100k, 100.0% for AGIs $100k-200k)
Averages for the 2012 tax year for zip code 64166, filed in 2013:
Average Adjusted Gross Income (AGI) in 2012: $66,108 (Individual Income Tax Returns)
Here:
$66,108
State:
$55,896
Salary/wage: $68,433 (reported on 69.2% of returns)
Here:
$68,433
State:
$46,205
(% of AGI for various income ranges: 192.5% for AGIs below $25k, 81.8% for AGIs $75k-100k, 76.1% for AGIs $100k-200k)
Taxable interest for individuals: $257 (reported on 53.8% of returns)
This zip code:
$257
Missouri:
$1,559
Ordinary dividends: $2,125 (reported on 30.8% of returns)
Here:
$2,125
State:
$7,410
Net capital gain/loss in AGI: +$200 (reported on 15.4% of returns)
Here:
+$200
State:
+$11,579
Total itemized deductions: $19,500 (18% of AGI, reported on 46.2% of returns)
Here:
$19,500
State:
$22,730
Here:
18.1% of AGI
State:
19.2% of AGI
(% of AGI for various income ranges: 36.6% for AGIs $25k-50k, 14.3% for AGIs $100k-200k)
Charity contributions: $2,975 (reported on 30.8% of returns)
Here:
$2,975
State:
$4,745
Taxes paid: $8,533 (reported on 46.2% of returns)
64166:
$8,533
State:
$8,399
(% of AGI for various income ranges: 12.0% for AGIs $25k-50k, 7.2% for AGIs $100k-200k)
Percentage of individuals using paid preparers for their 2012 taxes: 61.5%
Here:
62%
State:
55%
Averages for the 2004 tax year for zip code 64166, filed in 2005:
Average Adjusted Gross Income (AGI) in 2004: $67,085 (Individual Income Tax Returns)
Here:
$67,085
State:
$44,591
Salary/wage: $54,486 (reported on 89.0% of returns)
Here:
$54,486
State:
$38,941
(% of AGI for various income ranges: 83.9% for AGIs below $10k, 72.7% for AGIs $10k-25k, 85.9% for AGIs $25k-50k, 81.0% for AGIs $50k-75k, 84.8% for AGIs $75k-100k, 60.4% for AGIs over 100k)
Taxable interest for individuals: $616 (reported on 61.9% of returns)
This zip code:
$616
Missouri:
$1,801
(% of AGI for various income ranges: 3.8% for AGIs $10k-25k, 0.5% for AGIs $50k-75k, 0.3% for AGIs $75k-100k, 0.6% for AGIs over 100k)
Taxable dividends: $1,971 (reported on 28.8% of returns)
Here:
$1,971
State:
$3,677
(% of AGI for various income ranges: 8.6% for AGIs below $10k, 0.1% for AGIs $75k-100k, 1.5% for AGIs over 100k)
Net capital gain/loss: +$9,792 (reported on 20.3% of returns)
Here:
+$9,792
State:
+$8,915
Profit/loss from business: +$4,600 (reported on 12.7% of returns)
Here:
+$4,600
State:
+$9,793
Total itemized deductions: $19,729 (21% of AGI, reported on 50.0% of returns)
Here:
$19,729
State:
$18,261
Here:
20.5% of AGI
State:
20.5% of AGI
Charity contributions deductions: $2,038 (2% of AGI, reported on 44.9% of returns)
Here:
$2,038
State:
$3,665
Here:
2.1% of AGI
State:
3.9% of AGI
Total tax: $10,100 (reported on 84.7% of returns)
64166:
$10,100
State:
$6,999
(% of AGI for various income ranges: 4.3% for AGIs below $10k, 3.0% for AGIs $10k-25k, 7.8% for AGIs $25k-50k, 9.1% for AGIs $50k-75k, 8.8% for AGIs $75k-100k, 17.7% for AGIs over 100k)
Percentage of individuals using paid preparers for their 2004 taxes: 60.2%
Here:
60%
State:
62%
(% for various income ranges: 52.6% for AGIs below $10k, 66.7% for AGIs $10k-25k, 45.8% for AGIs $25k-50k, 80.0% for AGIs $50k-75k, 45.5% for AGIs $75k-100k, 78.3% for AGIs over 100k)
Household received Food Stamps/SNAP in the past 12 months: 0 Household did not receive Food Stamps/SNAP in the past 12 months: 133
Women who did not have a birth in the past 12 months: 11 (10 now married, 0 unmarried)
Housing units in zip code 64166 with a mortgage: 48 (14 second mortgage, 15 both second mortgage and home equity loan) Median monthly owner costs for units with a mortgage: $2,026 Median monthly owner costs for units without a mortgage: $992
Median number of rooms in houses and condos:
Here:
7.6
State:
6.4
Notable locations in this zip code not listed on our city pages
Size of family households: 48 2-persons, 33 3-persons, 11 5-persons
Size of nonfamily households: 40 1-person
30 married couples with children.
0 single-parent households ().
101.3% of residents of 64166 zip code speak English at home.
Foreign born population: 0 (0.0%)
:
0.0%
Whole state:
4.1%
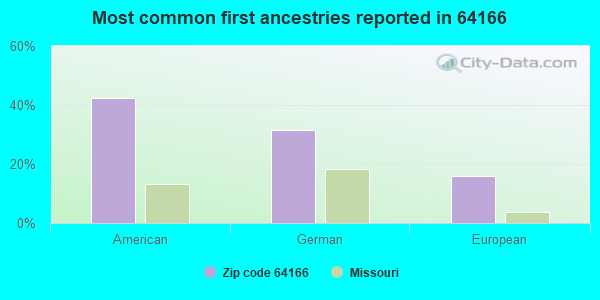
42%American
31%German
16%European
Facilities with environmental interests located in this zip code:
BRIAN PETTY (12920 JAMI DRIVE in KANSAS CITY, MO)
(Integrated Compliance Information System) - ICIS-07-1986-0113, FORMAL ENFORCEMENT ACTION STATE MASTER (Missouri monitoring and compilance) - ICIS-42282, ENFORCEMENT/COMPLIANCE ACTIVITY Alternative names: PETTY BRIAN
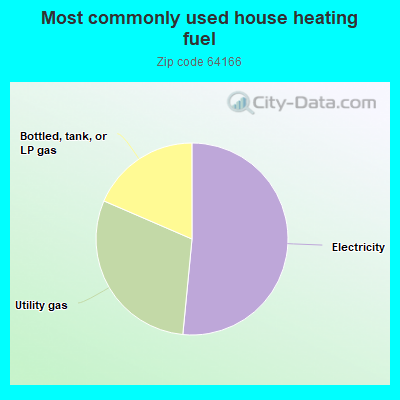
52.1%Electricity
30.3%Utility gas
18.7%Bottled, tank, or LP gas
Population in 1990: 466.
Place of birth for U.S.-born residents:
This state: 129
Midwest: 147
West: 21
67% of the 64166 zip code residents lived in the same house 5 years ago. Out of people who lived in different houses, 44% lived in this county. Out of people who lived in different counties, 50% lived in Missouri.
93% of the 64166 zip code residents lived in the same house 1 year ago. Out of people who lived in different houses, 95% moved from this county.
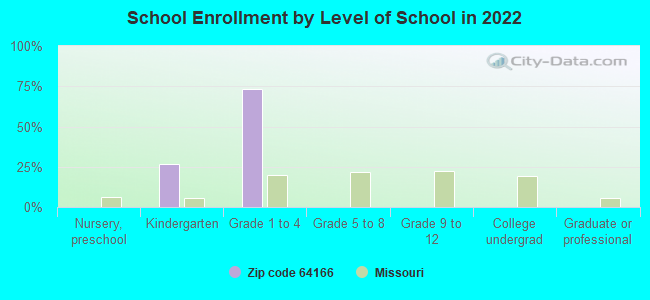
Private vs. public school enrollment:
Students in private schools in grades 1 to 8 (elementary and middle school):
Here:
0.0%
Missouri:
15.4%
Companies with federal contracts located in this zip code:
Anthony Young ( in Kansas City, MO; small business)
$950 with Bureau of Prisoners/Federal Prison System for Dental Instruments, Equipment, and Supplies. Taking place in KS. Signed on 2005-10-31. Completion date: 2005-11-30.
Top industries in this zip code by the number of employees in 2005:
Construction: Land Subdivision (1-4 employees: 1 establishment)
Home Mortgage Disclosure Act Aggregated Statistics For Year 2009 (Based on 2 partial tracts)
A) FHA, FSA/RHS & VA Home Purchase Loans
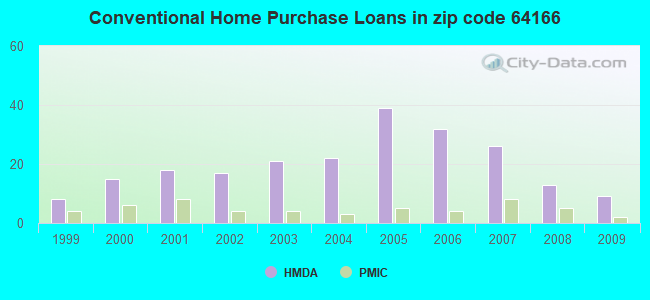
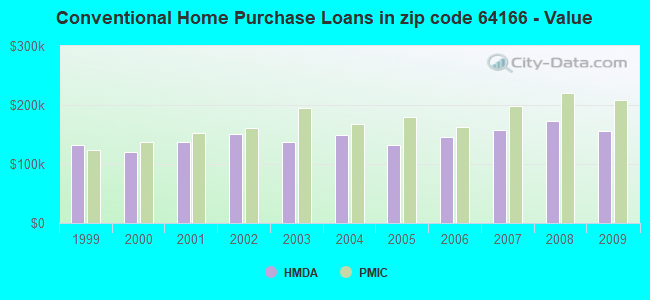
B) Conventional Home Purchase Loans
C) Refinancings
D) Home Improvement Loans
F) Non-occupant Loans on < 5 Family Dwellings (A B C & D)
Number
Average Value
Number
Average Value
Number
Average Value
Number
Average Value
Number
Average Value
LOANS ORIGINATED
10
$169,147
9
$155,687
45
$190,846
1
$10,440
2
$151,240
APPLICATIONS APPROVED, NOT ACCEPTED
0
$0
1
$111,370
4
$171,290
0
$0
0
$0
APPLICATIONS DENIED
1
$267,990
1
$226,070
10
$208,065
1
$15,820
0
$0
APPLICATIONS WITHDRAWN
1
$271,470
1
$132,730
9
$195,729
0
$0
1
$157,090
FILES CLOSED FOR INCOMPLETENESS
0
$0
0
$0
2
$218,475
0
$0
0
$0
Aggregated Statistics For Year 2008 (Based on 2 partial tracts)
A) FHA, FSA/RHS & VA Home Purchase Loans
B) Conventional Home Purchase Loans
C) Refinancings
D) Home Improvement Loans
F) Non-occupant Loans on < 5 Family Dwellings (A B C & D)
Number
Average Value
Number
Average Value
Number
Average Value
Number
Average Value
Number
Average Value
LOANS ORIGINATED
6
$171,147
13
$172,195
22
$191,911
2
$43,030
3
$137,000
APPLICATIONS APPROVED, NOT ACCEPTED
1
$183,350
1
$156,930
3
$220,373
1
$9,330
0
$0
APPLICATIONS DENIED
1
$209,140
1
$303,430
12
$219,608
2
$38,915
0
$0
APPLICATIONS WITHDRAWN
0
$0
1
$125,140
5
$207,654
0
$0
0
$0
FILES CLOSED FOR INCOMPLETENESS
0
$0
0
$0
2
$165,080
0
$0
0
$0
Aggregated Statistics For Year 2007 (Based on 2 partial tracts)
A) FHA, FSA/RHS & VA Home Purchase Loans
B) Conventional Home Purchase Loans
C) Refinancings
D) Home Improvement Loans
F) Non-occupant Loans on < 5 Family Dwellings (A B C & D)
Number
Average Value
Number
Average Value
Number
Average Value
Number
Average Value
Number
Average Value
LOANS ORIGINATED
2
$250,985
26
$157,336
19
$183,745
3
$53,577
2
$151,395
APPLICATIONS APPROVED, NOT ACCEPTED
0
$0
3
$223,220
4
$235,165
0
$0
0
$0
APPLICATIONS DENIED
0
$0
5
$186,930
17
$174,095
2
$50,545
1
$126,240
APPLICATIONS WITHDRAWN
0
$0
1
$170,540
7
$162,607
1
$227,810
0
$0
FILES CLOSED FOR INCOMPLETENESS
0
$0
1
$106,470
3
$137,477
0
$0
0
$0
Aggregated Statistics For Year 2006 (Based on 2 partial tracts)
A) FHA, FSA/RHS & VA Home Purchase Loans
B) Conventional Home Purchase Loans
C) Refinancings
D) Home Improvement Loans
F) Non-occupant Loans on < 5 Family Dwellings (A B C & D)
Number
Average Value
Number
Average Value
Number
Average Value
Number
Average Value
Number
Average Value
LOANS ORIGINATED
2
$137,790
32
$146,276
30
$145,191
3
$70,137
3
$143,963
APPLICATIONS APPROVED, NOT ACCEPTED
0
$0
4
$145,980
5
$155,226
0
$0
0
$0
APPLICATIONS DENIED
0
$0
2
$141,905
15
$174,663
2
$47,540
1
$125,450
APPLICATIONS WITHDRAWN
0
$0
2
$183,910
14
$152,459
1
$147,600
1
$71,190
FILES CLOSED FOR INCOMPLETENESS
0
$0
0
$0
3
$211,620
0
$0
0
$0
Aggregated Statistics For Year 2005 (Based on 2 partial tracts)
A) FHA, FSA/RHS & VA Home Purchase Loans
B) Conventional Home Purchase Loans
C) Refinancings
D) Home Improvement Loans
F) Non-occupant Loans on < 5 Family Dwellings (A B C & D)
Number
Average Value
Number
Average Value
Number
Average Value
Number
Average Value
Number
Average Value
LOANS ORIGINATED
2
$177,185
39
$132,539
28
$146,341
2
$29,030
2
$103,780
APPLICATIONS APPROVED, NOT ACCEPTED
0
$0
4
$151,832
5
$155,194
0
$0
0
$0
APPLICATIONS DENIED
0
$0
5
$144,532
12
$149,459
2
$95,870
0
$0
APPLICATIONS WITHDRAWN
0
$0
5
$164,086
12
$152,598
1
$40,820
1
$126,400
FILES CLOSED FOR INCOMPLETENESS
0
$0
1
$182,400
4
$134,075
0
$0
0
$0
Aggregated Statistics For Year 2004 (Based on 2 partial tracts)
A) FHA, FSA/RHS & VA Home Purchase Loans
B) Conventional Home Purchase Loans
C) Refinancings
D) Home Improvement Loans
F) Non-occupant Loans on < 5 Family Dwellings (A B C & D)
Number
Average Value
Number
Average Value
Number
Average Value
Number
Average Value
Number
Average Value
LOANS ORIGINATED
2
$181,695
22
$148,694
31
$154,679
2
$55,925
1
$152,350
APPLICATIONS APPROVED, NOT ACCEPTED
0
$0
3
$110,477
5
$138,994
1
$43,980
0
$0
APPLICATIONS DENIED
0
$0
2
$156,620
12
$135,709
2
$26,105
1
$84,160
APPLICATIONS WITHDRAWN
0
$0
3
$141,063
8
$148,451
0
$0
0
$0
FILES CLOSED FOR INCOMPLETENESS
0
$0
1
$202,020
2
$133,600
0
$0
0
$0
Aggregated Statistics For Year 2003 (Based on 2 partial tracts)
A) FHA, FSA/RHS & VA Home Purchase Loans
B) Conventional Home Purchase Loans
C) Refinancings
D) Home Improvement Loans
F) Non-occupant Loans on < 5 Family Dwellings (A B C & D)
Number
Average Value
Number
Average Value
Number
Average Value
Number
Average Value
Number
Average Value
LOANS ORIGINATED
4
$143,330
21
$137,717
70
$150,426
1
$39,710
1
$56,950
APPLICATIONS APPROVED, NOT ACCEPTED
0
$0
2
$173,625
7
$147,307
0
$0
0
$0
APPLICATIONS DENIED
0
$0
2
$139,850
12
$156,802
1
$12,340
0
$0
APPLICATIONS WITHDRAWN
0
$0
1
$179,560
12
$155,537
0
$0
0
$0
FILES CLOSED FOR INCOMPLETENESS
0
$0
1
$79,890
3
$154,403
0
$0
0
$0
Aggregated Statistics For Year 2002 (Based on 2 partial tracts)
A) FHA, FSA/RHS & VA Home Purchase Loans
B) Conventional Home Purchase Loans
C) Refinancings
D) Home Improvement Loans
F) Non-occupant Loans on < 5 Family Dwellings (A B C & D)
Number
Average Value
Number
Average Value
Number
Average Value
Number
Average Value
Number
Average Value
LOANS ORIGINATED
3
$120,600
17
$150,095
48
$143,985
2
$53,630
1
$73,400
APPLICATIONS APPROVED, NOT ACCEPTED
0
$0
1
$251,850
6
$127,535
0
$0
0
$0
APPLICATIONS DENIED
0
$0
2
$113,115
8
$160,989
0
$0
0
$0
APPLICATIONS WITHDRAWN
0
$0
2
$131,700
9
$140,851
1
$21,040
0
$0
FILES CLOSED FOR INCOMPLETENESS
0
$0
1
$76,090
3
$143,330
0
$0
0
$0
Aggregated Statistics For Year 2001 (Based on 2 partial tracts)
A) FHA, FSA/RHS & VA Home Purchase Loans
B) Conventional Home Purchase Loans
C) Refinancings
D) Home Improvement Loans
F) Non-occupant Loans on < 5 Family Dwellings (A B C & D)
Number
Average Value
Number
Average Value
Number
Average Value
Number
Average Value
Number
Average Value
LOANS ORIGINATED
3
$134,680
18
$137,458
36
$141,409
3
$15,293
1
$177,030
APPLICATIONS APPROVED, NOT ACCEPTED
0
$0
1
$140,480
3
$108,260
0
$0
0
$0
APPLICATIONS DENIED
0
$0
2
$90,570
7
$132,007
1
$18,030
0
$0
APPLICATIONS WITHDRAWN
0
$0
1
$233,980
6
$128,722
1
$12,180
0
$0
FILES CLOSED FOR INCOMPLETENESS
0
$0
1
$75,940
1
$104,890
0
$0
0
$0
Aggregated Statistics For Year 2000 (Based on 2 partial tracts)
A) FHA, FSA/RHS & VA Home Purchase Loans
B) Conventional Home Purchase Loans
C) Refinancings
D) Home Improvement Loans
Number
Average Value
Number
Average Value
Number
Average Value
Number
Average Value
LOANS ORIGINATED
3
$115,433
15
$119,779
9
$127,017
1
$24,840
APPLICATIONS APPROVED, NOT ACCEPTED
0
$0
0
$0
2
$78,865
0
$0
APPLICATIONS DENIED
0
$0
0
$0
4
$82,700
0
$0
APPLICATIONS WITHDRAWN
0
$0
1
$88,590
2
$101,645
0
$0
FILES CLOSED FOR INCOMPLETENESS
0
$0
0
$0
0
$0
0
$0
Aggregated Statistics For Year 1999 (Based on 1 partial tract)


 Nearest zip codes: 64167, 64156, 64165, 64157, 64155, 64089.