Estimated zip code population in 2022: 1,010 Zip code population in 2010: 1,410 Zip code population in 2000: 1,515
Houses and condos: 498 Renter-occupied apartments: 76
% of renters here:
19%
State:
32%
March 2022 cost of living index in zip code 64097: 77.3 (low, U.S. average is 100)
Land area: 34.0 sq. mi. Water area: 0.9 sq. mi.
Population density: 30 people per square mile
(very low).
OSM Map
General Map
Google Map
MSN Map
OSM Map
General Map
Google Map
MSN Map
OSM Map
General Map
Google Map
MSN Map
OSM Map
General Map
Google Map
MSN Map
Please wait while loading the map...
Real estate property taxes paid for housing units in 2022:
This zip code:
0.6% ($1,275)
Missouri:
0.8% ($1,810)
Median real estate property taxes paid for housing units with mortgages in 2022: $1,272 (0.6%) Median real estate property taxes paid for housing units with no mortgage in 2022: $1,286 (0.6%)
Business Search- 14 Million verified businesses
Males: 501
(49.6%)
Females: 509
(50.4%)
For population 25 years and over in 64097:
High school or higher: 89.9%
Bachelor's degree or higher: 10.8%
Graduate or professional degree: 3.5%
Unemployed: 5.6%
Mean travel time to work (commute): 33.5 minutes
For population 15 years and over in 64097:
Never married: 20.9%
Now married: 57.8%
Separated: 2.6%
Widowed: 6.0%
Divorced: 12.7%
Zip code 64097 compared to state average:
Black race population percentage significantly below state average.
Foreign-born population percentage significantly below state average.
Renting percentage below state average.
Length of stay since moving in significantly above state average.
House age above state average.
Number of college students significantly below state average.
Percentage of population with a bachelor's degree or higher significantly below state average.
Estimated median house/condo value in 2022: $203,007
64097:
$203,007
Missouri:
$221,200
According to our research of Missouri and other state lists, there were 2 registered sex offenders living in 64097 zip code as of July 04, 2024. The ratio of all residents to sex offenders in zip code 64097 is 718 to 1. The ratio of registered sex offenders to all residents in this zip code is lower than the state average.
Median resident age:
This zip code:
42.0 years
Missouri median age:
39.1 years
Average household size:
This zip code:
2.5 people
Missouri:
2.4 people
Averages for the 2020 tax year for zip code 64097, filed in 2021:
Average Adjusted Gross Income (AGI) in 2020: $57,131 (Individual Income Tax Returns)
Here:
$57,131
State:
$68,151
Salary/wage: $48,631 (reported on 82.3% of returns)
Here:
$48,631
State:
$56,131
(% of AGI for various income ranges: 1253.1% for AGIs below $25k, 3520.0% for AGIs $25k-50k, 7022.5% for AGIs $50k-75k, 9185.0% for AGIs $75k-100k, 22382.5% for AGIs $100k-200k)
Taxable interest for individuals: $995 (reported on 30.6% of returns)
This zip code:
$995
Missouri:
$1,586
(% of AGI for various income ranges: 30.0% for AGIs below $25k, 13.6% for AGIs $25k-50k, 10.0% for AGIs $50k-75k, 117.5% for AGIs $75k-100k, 190.0% for AGIs $100k-200k)
Ordinary dividends: $2,290 (reported on 16.1% of returns)
Here:
$2,290
State:
$10,947
(% of AGI for various income ranges: 28.5% for AGIs below $25k, 31.2% for AGIs $50k-75k, 417.5% for AGIs $100k-200k)
Net capital gain/loss in AGI: +$5,710 (reported on 16.1% of returns)
Here:
+$5,710
State:
+$18,453
(% of AGI for various income ranges: 29.2% for AGIs below $25k, 30.0% for AGIs $50k-75k, 1272.5% for AGIs $100k-200k)
Profit/loss from business: +$7,933 (reported on 14.5% of returns)
Here:
+$7,933
State:
+$12,260
(% of AGI for various income ranges: 166.2% for AGIs below $25k, 98.6% for AGIs $25k-50k, 207.5% for AGIs $50k-75k, 485.0% for AGIs $100k-200k)
Taxable individual retirement arrangement distribution: $11,350 (reported on 6.5% of returns)
64097:
$11,350
Missouri:
$19,719
(% of AGI for various income ranges: 60.0% for AGIs below $25k, 470.0% for AGIs $50k-75k)
Earned income credit: $2,300 (reported on 16.1% of returns)
Here:
$2,300
State:
$2,315
(% of AGI for various income ranges: 104.6% for AGIs below $25k, 67.1% for AGIs $25k-50k)
Percentage of individuals using paid preparers for their 2020 taxes: 93.5%
Here:
94%
State:
93%
(% for various income ranges: 88.9% for AGIs below $25k, 94.1% for AGIs $25k-50k, 100.0% for AGIs $50k-75k, 100.0% for AGIs $75k-100k, 90.0% for AGIs $100k-200k)
Averages for the 2012 tax year for zip code 64097, filed in 2013:
Average Adjusted Gross Income (AGI) in 2012: $48,866 (Individual Income Tax Returns)
Here:
$48,866
State:
$55,896
Salary/wage: $40,171 (reported on 82.3% of returns)
Here:
$40,171
State:
$46,205
(% of AGI for various income ranges: 65.1% for AGIs below $25k, 79.2% for AGIs $25k-50k, 75.4% for AGIs $50k-75k, 76.6% for AGIs $75k-100k, 52.7% for AGIs $100k-200k)
Taxable interest for individuals: $1,008 (reported on 40.3% of returns)
This zip code:
$1,008
Missouri:
$1,559
(% of AGI for various income ranges: 3.0% for AGIs below $25k, 0.6% for AGIs $25k-50k, 0.8% for AGIs $50k-75k, 0.4% for AGIs $75k-100k, 0.7% for AGIs $100k-200k)
Ordinary dividends: $1,518 (reported on 17.7% of returns)
Here:
$1,518
State:
$7,410
(% of AGI for various income ranges: 0.6% for AGIs below $25k, 0.5% for AGIs $25k-50k, 0.4% for AGIs $50k-75k, 1.0% for AGIs $100k-200k)
Net capital gain/loss in AGI: +$3,857 (reported on 11.3% of returns)
Here:
+$3,857
State:
+$11,579
(% of AGI for various income ranges: 0.6% for AGIs below $25k, 0.5% for AGIs $50k-75k, 2.1% for AGIs $100k-200k)
Profit/loss from business: +$6,200 (reported on 16.1% of returns)
Here:
+$6,200
State:
+$11,688
(% of AGI for various income ranges: 7.1% for AGIs below $25k, 4.8% for AGIs $25k-50k, 3.1% for AGIs $75k-100k)
Taxable individual retirement arrangement distribution: $9,383 (reported on 9.7% of returns)
64097:
$9,383
Missouri:
$14,773
Total itemized deductions: $17,179 (19% of AGI, reported on 22.6% of returns)
Here:
$17,179
State:
$22,730
Here:
18.9% of AGI
State:
19.2% of AGI
(% of AGI for various income ranges: 8.2% for AGIs $25k-50k, 8.8% for AGIs $50k-75k, 9.0% for AGIs $75k-100k, 8.7% for AGIs $100k-200k)
Charity contributions: $2,920 (reported on 16.1% of returns)
Here:
$2,920
State:
$4,745
(% of AGI for various income ranges: 2.6% for AGIs below $25k, 2.0% for AGIs $50k-75k, 0.9% for AGIs $100k-200k)
Taxes paid: $5,171 (reported on 22.6% of returns)
64097:
$5,171
State:
$8,399
(% of AGI for various income ranges: 1.6% for AGIs $25k-50k, 1.8% for AGIs $50k-75k, 3.1% for AGIs $75k-100k, 3.4% for AGIs $100k-200k)
Earned income credit: $2,540 (reported on 16.1% of returns)
Here:
$2,540
State:
$2,288
(% of AGI for various income ranges: 7.5% for AGIs below $25k, 1.1% for AGIs $25k-50k)
Percentage of individuals using paid preparers for their 2012 taxes: 62.9%
Here:
63%
State:
55%
(% for various income ranges: 56.5% for AGIs below $25k, 62.5% for AGIs $25k-50k, 70.0% for AGIs $50k-75k, 66.7% for AGIs $75k-100k, 71.4% for AGIs $100k-200k)
Averages for the 2004 tax year for zip code 64097, filed in 2005:
Average Adjusted Gross Income (AGI) in 2004: $38,239 (Individual Income Tax Returns)
Here:
$38,239
State:
$44,591
Salary/wage: $37,630 (reported on 83.0% of returns)
Here:
$37,630
State:
$38,941
(% of AGI for various income ranges: 78.3% for AGIs below $10k, 66.4% for AGIs $10k-25k, 83.7% for AGIs $25k-50k, 90.3% for AGIs $50k-75k, 82.7% for AGIs $75k-100k, 73.7% for AGIs over 100k)
Taxable interest for individuals: $1,350 (reported on 49.5% of returns)
This zip code:
$1,350
Missouri:
$1,801
(% of AGI for various income ranges: 6.3% for AGIs below $10k, 3.7% for AGIs $10k-25k, 2.8% for AGIs $25k-50k, 0.6% for AGIs $50k-75k, 0.5% for AGIs $75k-100k, 1.2% for AGIs over 100k)
Taxable dividends: $921 (reported on 20.8% of returns)
Here:
$921
State:
$3,677
(% of AGI for various income ranges: 1.6% for AGIs $10k-25k, 0.4% for AGIs $25k-50k, 0.0% for AGIs $50k-75k, 0.2% for AGIs $75k-100k, 1.1% for AGIs over 100k)
Net capital gain/loss: +$348 (reported on 10.8% of returns)
Here:
+$348
State:
+$8,915
(% of AGI for various income ranges: -0.1% for AGIs $10k-25k, 0.2% for AGIs $25k-50k, 0.4% for AGIs $50k-75k, -0.3% for AGIs over 100k)
Profit/loss from business: +$1,745 (reported on 15.4% of returns)
Here:
+$1,745
State:
+$9,793
(% of AGI for various income ranges: 12.4% for AGIs below $10k, 4.5% for AGIs $10k-25k, -0.4% for AGIs $25k-50k, 0.4% for AGIs $50k-75k, -0.5% for AGIs $75k-100k)
Profit/loss from farming: +$200 (reported on 8.2% of returns)
Here:
+$200
State:
-$5,056
Total itemized deductions: $13,492 (20% of AGI, reported on 21.6% of returns)
Here:
$13,492
State:
$18,261
Here:
19.6% of AGI
State:
20.5% of AGI
(% of AGI for various income ranges: 5.9% for AGIs $10k-25k, 5.8% for AGIs $25k-50k, 8.3% for AGIs $50k-75k, 10.0% for AGIs $75k-100k, 9.4% for AGIs over 100k)
Charity contributions deductions: $2,237 (3% of AGI, reported on 15.8% of returns)
Here:
$2,237
State:
$3,665
Here:
2.9% of AGI
State:
3.9% of AGI
(% of AGI for various income ranges: 0.8% for AGIs $25k-50k, 0.6% for AGIs $50k-75k, 1.2% for AGIs $75k-100k, 2.2% for AGIs over 100k)
Total tax: $4,306 (reported on 75.8% of returns)
64097:
$4,306
State:
$6,999
(% of AGI for various income ranges: 3.6% for AGIs below $10k, 4.2% for AGIs $10k-25k, 6.3% for AGIs $25k-50k, 8.0% for AGIs $50k-75k, 11.1% for AGIs $75k-100k, 14.4% for AGIs over 100k)
Earned income credit: $1,803 (reported on 12.4% of returns)
Here:
$1,803
State:
$1,728
Percentage of individuals using paid preparers for their 2004 taxes: 72.2%
Here:
72%
State:
62%
(% for various income ranges: 64.8% for AGIs below $10k, 74.2% for AGIs $10k-25k, 71.0% for AGIs $25k-50k, 78.6% for AGIs $50k-75k, 65.9% for AGIs $75k-100k, 82.8% for AGIs over 100k)
Household received Food Stamps/SNAP in the past 12 months: 33 Household did not receive Food Stamps/SNAP in the past 12 months: 365
Women who had a birth in the past 12 months: 16 (12 now married, 4 unmarried) Women who did not have a birth in the past 12 months: 156 (88 now married, 67 unmarried)
Housing units in zip code 64097 with a mortgage: 124 (4 second mortgage, 4 both second mortgage and home equity loan) Median monthly owner costs for units with a mortgage: $1,344 Median monthly owner costs for units without a mortgage: $445
Residents with income below the poverty level in 2022:
This zip code:
9.8%
Whole state:
13.2%
Residents with income below 50% of the poverty level in 2022:
This zip code:
1.8%
Whole state:
6.8%
Median number of rooms in houses and condos:
Here:
6.1
State:
6.4
Median number of rooms in apartments:
Here:
7.2
State:
4.4
Notable locations in this zip code not listed on our city pages
Reservoirs: Lafayette A-21 Lake (A), Lafayette County Lake C-23 (B), Lafayette County Lake C-21 (C), Number 188 Reservoir (D). Display/hide their locations on the map
109 married couples with children.
81 single-parent households (51 men, 30 women).
99.5% of residents of 64097 zip code speak English at home.
0.4% of residents speak Spanish at home (100% very well).
Foreign born population: 10 (1.1%) (100.0% of them are naturalized citizens)
This zip code:
1.1%
Whole state:
4.1%
60%Honduras
50%Germany
53%German
11%American
7%English
5%Irish
4%European
2%Belgian
2%Canadian
Year of entry for the foreign-born population
02010 or later
02000 to 2009
51990 to 1999
3Before 1990
Facilities with environmental interests located in this zip code:
BECKNERS ORCHARD (RURAL ROUTE 1 in WELLINGTON, MO)
COMPLIANCE ACTIVITY (Tracking inspections of insecticide, fungicide, and rodenticide, and toxic substances) Business SIC classification: NONCLASSIFIABLE ESTABLISHMENTS
Housing units lacking complete plumbing facilities: 4.3% Housing units lacking complete kitchen facilities: 5.6%
56.3%Bottled, tank, or LP gas
37.2%Electricity
3.9%Wood
1.6%Utility gas
1.6%Other fuel
Population in 1990: 1,167. Population change in the 1990s: +348 (+29.8%).
Place of birth for U.S.-born residents:
This state: 786
Northeast: 2
Midwest: 97
South: 49
West: 64
65% of the 64097 zip code residents lived in the same house 5 years ago. Out of people who lived in different houses, 53% lived in this county. Out of people who lived in different counties, 50% lived in Missouri.
90% of the 64097 zip code residents lived in the same house 1 year ago. Out of people who lived in different houses, 46% moved from this county. Out of people who lived in different houses, 51% moved from different county within same state.
Private vs. public school enrollment:
Students in private schools in grades 1 to 8 (elementary and middle school): 11
Here:
8.2%
Missouri:
15.4%
Students in private schools in grades 9 to 12 (high school):
Here:
0.0%
Missouri:
13.9%
Occupation by median earnings in the past 12 months ($)
99,933Management occupations
86,555Transportation occupations
75,102Installation, maintenance, and repair occupations
74,298Construction and extraction occupations
60,378Production occupations
49,431Sales and related occupations
Companies with federal contracts located in this zip code:
NADLER'S (5527 HIGHWAY 224 in WELLINGTON, MO; small business) : $25,492 in 6 contractsin 2005
Contracts for Food Services by Army Signed by year:2000: $0; 2001: $0; 2002: $0; 2003: $0; 2004: $0; 2005: $25,492; 2006: $0.
Biggest contracts:
$18,300 with Army for Food Services. Signed on 2005-07-28. Completion date: 2005-08-14.
$5,922, same as above.Signed on 2005-06-15. Completion date: 2005-06-20.
$2,778, same as above.Signed on 2005-06-21. Completion date: 2005-06-26.
$732, same as above.Signed on 2005-08-12. Completion date: 2005-08-14.
C & T THOMSON SUPPLY CO LLC (11743 SNI-A-BAR RD in WELLINGTON, MO; small business)
$10,000 with Air Force for Maintenance, Repair and Rebuilding of Equipment -- Miscellaneous. Taking place in OK. Signed on 2006-05-11. Completion date: 2006-06-15.
Top industries in this zip code by the number of employees in 2005:
Construction: Commercial and Institutional Building Construction (10-19 employees: 1 establishment)
Construction: Highway, Street, and Bridge Construction (10-19: 1)
Professional, Scientific, and Technical Services: Engineering Services (10-19: 1)
Information: Software Publishers (5-9: 1)
Finance and Insurance: Insurance Agencies and Brokerages (1-4: 2)
Other Services (except Public Administration): Religious Organizations (1-4: 2)
Construction: Painting and Wall Covering Contractors (1-4: 1)
Accommodation and Food Services: Full-Service Restaurants (1-4: 1)
People in group quarters in 2000:
36 people in schools, hospitals, or wards for the intellectually disabled
Fatal accident statistics in 2013:
Fatal accident count: 1
Vehicles involved in fatal accidents: 2
Fatal accidents caused by drunken drivers: 1
Fatalities: 1
Persons involved in fatal accidents: 2
Pedestrians involved in fatal accidents: 0
Home Mortgage Disclosure Act Aggregated Statistics For Year 2009 (Based on 2 partial tracts)
A) FHA, FSA/RHS & VA Home Purchase Loans
B) Conventional Home Purchase Loans
C) Refinancings
D) Home Improvement Loans
F) Non-occupant Loans on < 5 Family Dwellings (A B C & D)
G) Loans On Manufactured Home Dwelling (A B C & D)
Number
Average Value
Number
Average Value
Number
Average Value
Number
Average Value
Number
Average Value
Number
Average Value
LOANS ORIGINATED
8
$118,830
11
$84,302
58
$136,971
4
$57,840
3
$59,257
4
$81,638
APPLICATIONS APPROVED, NOT ACCEPTED
1
$71,870
1
$25,220
6
$135,432
0
$0
0
$0
1
$25,220
APPLICATIONS DENIED
3
$114,523
8
$122,140
21
$176,692
3
$40,977
1
$45,390
4
$85,892
APPLICATIONS WITHDRAWN
1
$105,280
0
$0
10
$123,306
2
$150,035
0
$0
3
$103,807
FILES CLOSED FOR INCOMPLETENESS
0
$0
1
$68,710
3
$163,063
0
$0
0
$0
0
$0
Aggregated Statistics For Year 2008 (Based on 2 partial tracts)
A) FHA, FSA/RHS & VA Home Purchase Loans
B) Conventional Home Purchase Loans
C) Refinancings
D) Home Improvement Loans
F) Non-occupant Loans on < 5 Family Dwellings (A B C & D)
G) Loans On Manufactured Home Dwelling (A B C & D)
Number
Average Value
Number
Average Value
Number
Average Value
Number
Average Value
Number
Average Value
Number
Average Value
LOANS ORIGINATED
8
$126,474
22
$167,744
40
$124,756
9
$57,297
11
$111,753
6
$45,283
APPLICATIONS APPROVED, NOT ACCEPTED
1
$132,380
2
$46,650
1
$39,720
1
$112,840
0
$0
1
$15,760
APPLICATIONS DENIED
2
$68,400
6
$47,805
20
$120,784
7
$103,566
2
$43,815
3
$38,033
APPLICATIONS WITHDRAWN
1
$135,540
1
$206,770
9
$108,779
2
$179,665
1
$49,800
1
$78,170
FILES CLOSED FOR INCOMPLETENESS
1
$69,340
0
$0
1
$90,150
0
$0
0
$0
0
$0
Aggregated Statistics For Year 2007 (Based on 2 partial tracts)
A) FHA, FSA/RHS & VA Home Purchase Loans
B) Conventional Home Purchase Loans
C) Refinancings
D) Home Improvement Loans
F) Non-occupant Loans on < 5 Family Dwellings (A B C & D)
G) Loans On Manufactured Home Dwelling (A B C & D)
Number
Average Value
Number
Average Value
Number
Average Value
Number
Average Value
Number
Average Value
Number
Average Value
LOANS ORIGINATED
5
$107,420
33
$107,531
53
$129,815
11
$44,243
6
$65,772
8
$55,081
APPLICATIONS APPROVED, NOT ACCEPTED
0
$0
3
$97,713
12
$151,611
1
$7,560
1
$46,020
1
$44,130
APPLICATIONS DENIED
0
$0
9
$88,467
37
$143,237
11
$62,754
3
$100,863
3
$57,997
APPLICATIONS WITHDRAWN
0
$0
1
$132,380
16
$122,376
3
$32,780
0
$0
1
$6,300
FILES CLOSED FOR INCOMPLETENESS
0
$0
1
$126,080
4
$156,970
0
$0
0
$0
0
$0
Aggregated Statistics For Year 2006 (Based on 2 partial tracts)
A) FHA, FSA/RHS & VA Home Purchase Loans
B) Conventional Home Purchase Loans
C) Refinancings
D) Home Improvement Loans
F) Non-occupant Loans on < 5 Family Dwellings (A B C & D)
G) Loans On Manufactured Home Dwelling (A B C & D)
Number
Average Value
Number
Average Value
Number
Average Value
Number
Average Value
Number
Average Value
Number
Average Value
LOANS ORIGINATED
8
$116,939
43
$102,638
58
$111,287
13
$92,378
15
$99,813
8
$87,546
APPLICATIONS APPROVED, NOT ACCEPTED
0
$0
6
$86,470
9
$143,731
3
$11,137
1
$158,860
1
$76,910
APPLICATIONS DENIED
0
$0
18
$90,673
42
$140,759
11
$82,009
5
$47,154
4
$66,508
APPLICATIONS WITHDRAWN
2
$61,465
5
$135,662
23
$128,876
6
$93,720
2
$68,400
1
$130,490
FILES CLOSED FOR INCOMPLETENESS
1
$51,060
2
$75,020
8
$196,842
0
$0
0
$0
0
$0
Aggregated Statistics For Year 2005 (Based on 2 partial tracts)
A) FHA, FSA/RHS & VA Home Purchase Loans
B) Conventional Home Purchase Loans
C) Refinancings
D) Home Improvement Loans
F) Non-occupant Loans on < 5 Family Dwellings (A B C & D)
G) Loans On Manufactured Home Dwelling (A B C & D)
Number
Average Value
Number
Average Value
Number
Average Value
Number
Average Value
Number
Average Value
Number
Average Value
LOANS ORIGINATED
5
$129,106
39
$105,826
60
$106,201
5
$77,540
9
$68,013
8
$42,315
APPLICATIONS APPROVED, NOT ACCEPTED
1
$49,800
8
$112,211
6
$89,727
1
$84,470
1
$34,040
3
$50,853
APPLICATIONS DENIED
0
$0
11
$71,350
39
$135,164
13
$35,885
1
$75,650
7
$63,400
APPLICATIONS WITHDRAWN
0
$0
3
$112,000
36
$124,259
4
$125,765
0
$0
1
$148,770
FILES CLOSED FOR INCOMPLETENESS
0
$0
0
$0
5
$167,308
0
$0
0
$0
0
$0
Aggregated Statistics For Year 2004 (Based on 2 partial tracts)
A) FHA, FSA/RHS & VA Home Purchase Loans
B) Conventional Home Purchase Loans
C) Refinancings
D) Home Improvement Loans
F) Non-occupant Loans on < 5 Family Dwellings (A B C & D)
G) Loans On Manufactured Home Dwelling (A B C & D)
Number
Average Value
Number
Average Value
Number
Average Value
Number
Average Value
Number
Average Value
Number
Average Value
LOANS ORIGINATED
6
$85,525
35
$102,917
71
$121,268
8
$45,152
10
$75,144
6
$63,880
APPLICATIONS APPROVED, NOT ACCEPTED
1
$43,500
2
$147,515
21
$112,241
1
$99,600
0
$0
1
$59,890
APPLICATIONS DENIED
1
$46,650
10
$72,811
50
$97,573
5
$42,362
3
$59,677
5
$54,970
APPLICATIONS WITHDRAWN
0
$0
5
$88,634
29
$128,993
1
$88,260
1
$32,780
1
$100,230
FILES CLOSED FOR INCOMPLETENESS
0
$0
1
$40,980
4
$107,955
0
$0
0
$0
0
$0
Aggregated Statistics For Year 2003 (Based on 2 partial tracts)
A) FHA, FSA/RHS & VA Home Purchase Loans
B) Conventional Home Purchase Loans
C) Refinancings
D) Home Improvement Loans
F) Non-occupant Loans on < 5 Family Dwellings (A B C & D)
Number
Average Value
Number
Average Value
Number
Average Value
Number
Average Value
Number
Average Value
LOANS ORIGINATED
1
$99,600
39
$89,258
127
$106,304
4
$18,440
9
$46,930
APPLICATIONS APPROVED, NOT ACCEPTED
0
$0
1
$58,000
10
$101,810
1
$51,690
0
$0
APPLICATIONS DENIED
0
$0
11
$65,562
59
$106,602
3
$46,020
3
$63,670
APPLICATIONS WITHDRAWN
2
$94,245
7
$105,367
34
$128,880
1
$15,760
1
$253,420
FILES CLOSED FOR INCOMPLETENESS
0
$0
1
$78,800
4
$117,570
0
$0
0
$0
Aggregated Statistics For Year 2002 (Based on 2 partial tracts)
A) FHA, FSA/RHS & VA Home Purchase Loans
B) Conventional Home Purchase Loans
C) Refinancings
D) Home Improvement Loans
F) Non-occupant Loans on < 5 Family Dwellings (A B C & D)
Number
Average Value
Number
Average Value
Number
Average Value
Number
Average Value
Number
Average Value
LOANS ORIGINATED
7
$81,681
38
$81,985
113
$109,662
9
$17,371
9
$51,272
APPLICATIONS APPROVED, NOT ACCEPTED
0
$0
5
$73,504
8
$101,810
1
$5,040
0
$0
APPLICATIONS DENIED
0
$0
13
$66,289
29
$109,907
5
$18,282
1
$104,650
APPLICATIONS WITHDRAWN
1
$47,910
4
$95,662
25
$126,836
0
$0
1
$45,390
FILES CLOSED FOR INCOMPLETENESS
1
$32,150
0
$0
3
$186,600
0
$0
0
$0
Aggregated Statistics For Year 2001 (Based on 2 partial tracts)
A) FHA, FSA/RHS & VA Home Purchase Loans
B) Conventional Home Purchase Loans
C) Refinancings
D) Home Improvement Loans
F) Non-occupant Loans on < 5 Family Dwellings (A B C & D)
Number
Average Value
Number
Average Value
Number
Average Value
Number
Average Value
Number
Average Value
LOANS ORIGINATED
7
$77,539
31
$85,836
93
$98,417
11
$36,219
8
$47,516
APPLICATIONS APPROVED, NOT ACCEPTED
0
$0
3
$91,827
9
$111,721
2
$45,705
0
$0
APPLICATIONS DENIED
1
$46,020
11
$50,203
30
$89,055
8
$14,184
0
$0
APPLICATIONS WITHDRAWN
1
$40,350
3
$77,750
26
$78,436
1
$16,390
0
$0
FILES CLOSED FOR INCOMPLETENESS
0
$0
0
$0
8
$103,149
1
$50,430
0
$0
Aggregated Statistics For Year 2000 (Based on 2 partial tracts)
A) FHA, FSA/RHS & VA Home Purchase Loans
B) Conventional Home Purchase Loans
C) Refinancings
D) Home Improvement Loans
F) Non-occupant Loans on < 5 Family Dwellings (A B C & D)
Number
Average Value
Number
Average Value
Number
Average Value
Number
Average Value
Number
Average Value
LOANS ORIGINATED
6
$83,843
35
$82,637
37
$84,644
5
$24,208
5
$50,432
APPLICATIONS APPROVED, NOT ACCEPTED
0
$0
3
$40,767
3
$88,677
1
$9,460
1
$37,820
APPLICATIONS DENIED
1
$119,150
13
$53,293
18
$47,946
7
$17,651
1
$23,960
APPLICATIONS WITHDRAWN
1
$49,800
1
$93,300
9
$70,044
0
$0
1
$17,020
FILES CLOSED FOR INCOMPLETENESS
0
$0
0
$0
4
$28,052
0
$0
1
$26,480
Aggregated Statistics For Year 1999 (Based on 1 partial tract)
A) FHA, FSA/RHS & VA Home Purchase Loans
B) Conventional Home Purchase Loans
C) Refinancings
D) Home Improvement Loans
F) Non-occupant Loans on < 5 Family Dwellings (A B C & D)
Detailed PMIC statistics for the following Tracts:0901.00
2002 - 2018 National Fire Incident Reporting System (NFIRS) incidents
Based on the data from the years 2002 - 2018 the average number of fires per year is 10. The highest number of reported fire incidents - 20 took place in 2002, and the least - 1 in 2011. The data has a dropping trend.
When looking into fire subcategories, the most reports belonged to: Outside Fires (49.7%), and Structure Fires (36.5%).
Fire incident types reported to NFIRS in Zip Code 64097


+$200
-$5,056
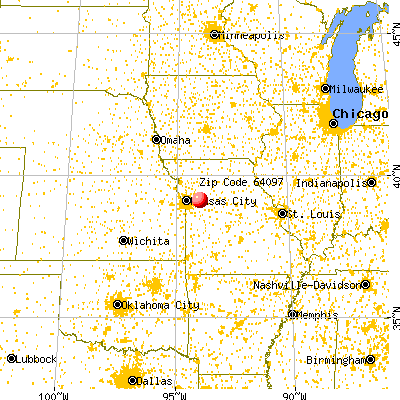
 Nearest zip codes: 64074, 64017, 64036, 64076, 64066, 64067.


 Based on the data from the years 2002 - 2018 the average number of fires per year is 10. The highest number of reported fire incidents - 20 took place in 2002, and the least - 1 in 2011. The data has a dropping trend.
 When looking into fire subcategories, the most reports belonged to: Outside Fires (49.7%), and Structure Fires (36.5%).