Estimated zip code population in 2022: 6,711 Zip code population in 2010: 6,659 Zip code population in 2000: 6,018
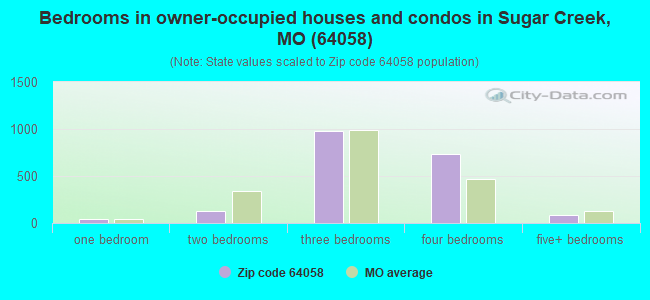
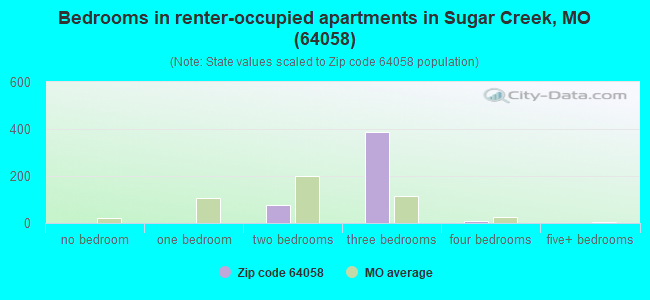
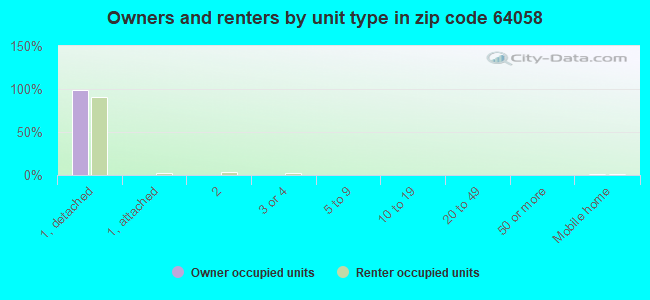
Houses and condos: 2,642 Renter-occupied apartments: 478
% of renters here:
20%
State:
32%
March 2022 cost of living index in zip code 64058: 86.0 (less than average, U.S. average is 100)
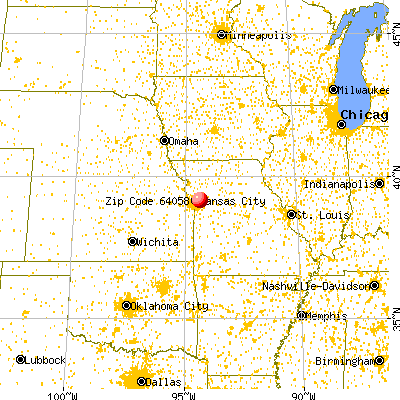
Land area: 35.2 sq. mi. Water area: 1.9 sq. mi.
Population density: 190 people per square mile
(very low).
OSM Map
General Map
Google Map
MSN Map
OSM Map
General Map
Google Map
MSN Map
OSM Map
General Map
Google Map
MSN Map
OSM Map
General Map
Google Map
MSN Map
Please wait while loading the map...
Real estate property taxes paid for housing units in 2022:
This zip code:
1.2% ($2,309)
Missouri:
0.8% ($1,810)
Median real estate property taxes paid for housing units with mortgages in 2022: $2,343 (1.2%) Median real estate property taxes paid for housing units with no mortgage in 2022: $2,250 (1.2%)
Business Search- 14 Million verified businesses
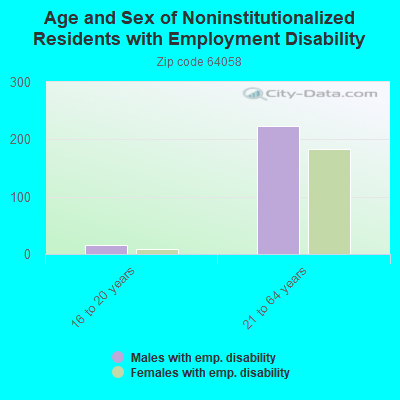
Males: 3,053
(45.5%)
Females: 3,659
(54.5%)
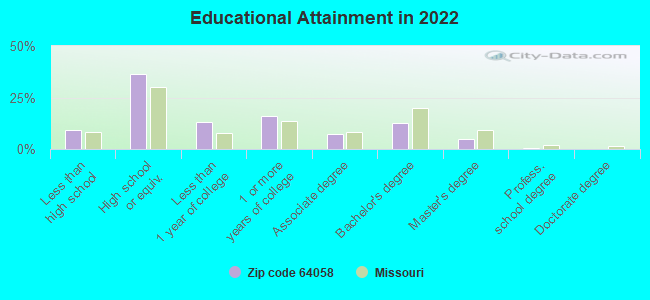
For population 25 years and over in 64058:
High school or higher: 90.5%
Bachelor's degree or higher: 17.7%
Graduate or professional degree: 5.2%
Unemployed: 1.8%
Mean travel time to work (commute): 28.8 minutes
For population 15 years and over in 64058:
Never married: 24.5%
Now married: 47.5%
Separated: 0.2%
Widowed: 11.4%
Divorced: 16.4%
Zip code 64058 compared to state average:
Unemployed percentage below state average.
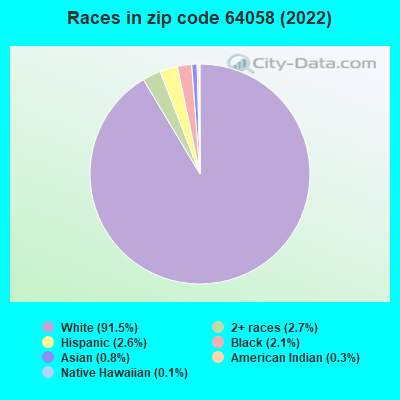
Black race population percentage significantly below state average.
Hispanic race population percentage below state average.
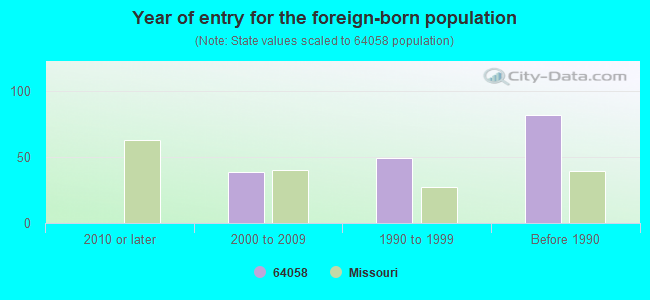
Foreign-born population percentage below state average.
Renting percentage below state average.
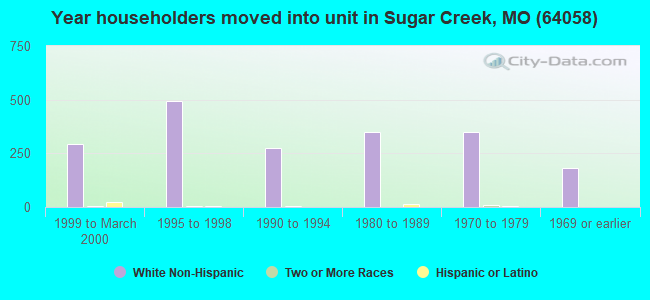
Length of stay since moving in significantly above state average.
Percentage of population with a bachelor's degree or higher below state average.
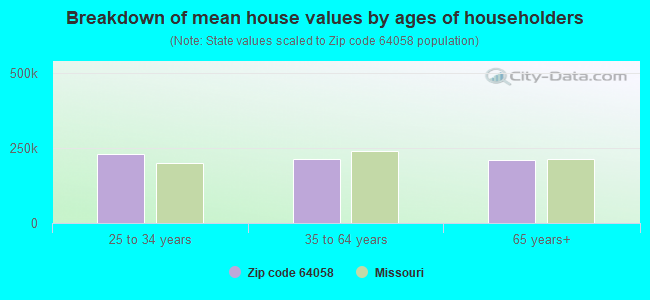
Estimated median house/condo value in 2022: $194,243
64058:
$194,243
Missouri:
$221,200
According to our research of Missouri and other state lists, there were 16 registered sex offenders living in 64058 zip code as of July 02, 2024. The ratio of all residents to sex offenders in zip code 64058 is 448 to 1. The ratio of registered sex offenders to all residents in this zip code is lower than the state average.
Median resident age:
This zip code:
39.2 years
Missouri median age:
39.1 years
Average household size:
This zip code:
2.7 people
Missouri:
2.4 people
Averages for the 2020 tax year for zip code 64058, filed in 2021:
Average Adjusted Gross Income (AGI) in 2020: $54,716 (Individual Income Tax Returns)
Here:
$54,716
State:
$68,151
Salary/wage: $48,978 (reported on 84.4% of returns)
Here:
$48,978
State:
$56,131
(% of AGI for various income ranges: 1096.1% for AGIs below $25k, 3562.3% for AGIs $25k-50k, 6147.3% for AGIs $50k-75k, 9438.1% for AGIs $75k-100k, 15829.6% for AGIs $100k-200k)
Taxable interest for individuals: $610 (reported on 25.8% of returns)
This zip code:
$610
Missouri:
$1,586
(% of AGI for various income ranges: 10.5% for AGIs below $25k, 14.3% for AGIs $25k-50k, 12.0% for AGIs $50k-75k, 20.7% for AGIs $75k-100k, 79.6% for AGIs $100k-200k)
Ordinary dividends: $2,197 (reported on 11.0% of returns)
Here:
$2,197
State:
$10,947
(% of AGI for various income ranges: 16.7% for AGIs below $25k, 15.0% for AGIs $25k-50k, 18.0% for AGIs $50k-75k, 35.6% for AGIs $75k-100k, 142.6% for AGIs $100k-200k)
Net capital gain/loss in AGI: +$6,633 (reported on 9.2% of returns)
Here:
+$6,633
State:
+$18,453
(% of AGI for various income ranges: 0.8% for AGIs below $25k, 14.2% for AGIs $25k-50k, 29.3% for AGIs $50k-75k, 94.1% for AGIs $75k-100k, 557.4% for AGIs $100k-200k)
Profit/loss from business: +$10,984 (reported on 11.3% of returns)
Here:
+$10,984
State:
+$12,260
(% of AGI for various income ranges: 81.6% for AGIs below $25k, 80.3% for AGIs $25k-50k, 228.5% for AGIs $50k-75k, 163.7% for AGIs $75k-100k, 547.8% for AGIs $100k-200k)
Taxable individual retirement arrangement distribution: $14,693 (reported on 8.6% of returns)
64058:
$14,693
Missouri:
$19,719
(% of AGI for various income ranges: 54.8% for AGIs below $25k, 70.1% for AGIs $25k-50k, 183.4% for AGIs $50k-75k, 264.1% for AGIs $75k-100k, 636.7% for AGIs $100k-200k)
Total itemized deductions: $26,733 (reported on 3.7% of returns)
Here:
$26,733
State:
$36,651
(% of AGI for various income ranges: 339.8% for AGIs $50k-75k, 672.2% for AGIs $100k-200k)
Charity contributions: $9,012 (reported on 2.5% of returns)
Here:
$9,012
State:
$15,671
(% of AGI for various income ranges: 39.3% for AGIs $50k-75k, 207.4% for AGIs $100k-200k)
Taxes paid: $7,500 (reported on 3.7% of returns)
64058:
$7,500
State:
$7,608
(% of AGI for various income ranges: 99.8% for AGIs $50k-75k, 181.9% for AGIs $100k-200k)
Earned income credit: $2,251 (reported on 15.6% of returns)
Here:
$2,251
State:
$2,315
(% of AGI for various income ranges: 84.5% for AGIs below $25k, 69.5% for AGIs $25k-50k)
Percentage of individuals using paid preparers for their 2020 taxes: 94.8%
Here:
95%
State:
93%
(% for various income ranges: 93.9% for AGIs below $25k, 94.4% for AGIs $25k-50k, 94.3% for AGIs $50k-75k, 97.3% for AGIs $75k-100k, 95.6% for AGIs $100k-200k, 100.0% for AGIs over 200k)
Averages for the 2012 tax year for zip code 64058, filed in 2013:
Average Adjusted Gross Income (AGI) in 2012: $46,949 (Individual Income Tax Returns)
Here:
$46,949
State:
$55,896
Salary/wage: $42,601 (reported on 86.6% of returns)
Here:
$42,601
State:
$46,205
(% of AGI for various income ranges: 72.3% for AGIs below $25k, 80.5% for AGIs $25k-50k, 81.5% for AGIs $50k-75k, 81.2% for AGIs $75k-100k, 75.1% for AGIs $100k-200k)
Taxable interest for individuals: $715 (reported on 28.8% of returns)
This zip code:
$715
Missouri:
$1,559
(% of AGI for various income ranges: 0.6% for AGIs below $25k, 0.6% for AGIs $25k-50k, 0.4% for AGIs $50k-75k, 0.4% for AGIs $75k-100k, 0.3% for AGIs $100k-200k)
Ordinary dividends: $1,595 (reported on 12.7% of returns)
Here:
$1,595
State:
$7,410
(% of AGI for various income ranges: 0.8% for AGIs below $25k, 0.2% for AGIs $25k-50k, 0.3% for AGIs $50k-75k, 0.4% for AGIs $75k-100k, 0.5% for AGIs $100k-200k)
Net capital gain/loss in AGI: +$770 (reported on 6.8% of returns)
Here:
+$770
State:
+$11,579
(% of AGI for various income ranges: 0.2% for AGIs $25k-50k, 0.3% for AGIs $75k-100k)
Profit/loss from business: +$8,618 (reported on 11.3% of returns)
Here:
+$8,618
State:
+$11,688
(% of AGI for various income ranges: 3.7% for AGIs below $25k, 2.1% for AGIs $25k-50k, 1.2% for AGIs $50k-75k, 2.6% for AGIs $75k-100k, 1.7% for AGIs $100k-200k)
Taxable individual retirement arrangement distribution: $11,389 (reported on 9.2% of returns)
64058:
$11,389
Missouri:
$14,773
(% of AGI for various income ranges: 4.0% for AGIs below $25k, 2.3% for AGIs $25k-50k, 1.8% for AGIs $50k-75k, 2.1% for AGIs $75k-100k, 2.1% for AGIs $100k-200k)
Total itemized deductions: $16,948 (22% of AGI, reported on 30.1% of returns)
Here:
$16,948
State:
$22,730
Here:
21.8% of AGI
State:
19.2% of AGI
(% of AGI for various income ranges: 7.9% for AGIs below $25k, 7.9% for AGIs $25k-50k, 9.9% for AGIs $50k-75k, 12.5% for AGIs $75k-100k, 13.5% for AGIs $100k-200k)
Charity contributions: $3,272 (reported on 22.9% of returns)
Here:
$3,272
State:
$4,745
(% of AGI for various income ranges: 1.1% for AGIs below $25k, 1.1% for AGIs $25k-50k, 1.2% for AGIs $50k-75k, 1.7% for AGIs $75k-100k, 2.3% for AGIs $100k-200k)
Taxes paid: $5,992 (reported on 30.5% of returns)
64058:
$5,992
State:
$8,399
(% of AGI for various income ranges: 1.6% for AGIs below $25k, 2.2% for AGIs $25k-50k, 3.3% for AGIs $50k-75k, 4.4% for AGIs $75k-100k, 6.0% for AGIs $100k-200k)
Earned income credit: $2,167 (reported on 18.5% of returns)
Here:
$2,167
State:
$2,288
(% of AGI for various income ranges: 6.3% for AGIs below $25k, 1.2% for AGIs $25k-50k)
Percentage of individuals using paid preparers for their 2012 taxes: 53.4%
Here:
53%
State:
55%
(% for various income ranges: 46.8% for AGIs below $25k, 52.9% for AGIs $25k-50k, 62.0% for AGIs $50k-75k, 57.1% for AGIs $75k-100k, 60.7% for AGIs $100k-200k)
Averages for the 2004 tax year for zip code 64058, filed in 2005:
Average Adjusted Gross Income (AGI) in 2004: $41,627 (Individual Income Tax Returns)
Here:
$41,627
State:
$44,591
Salary/wage: $39,147 (reported on 89.9% of returns)
Here:
$39,147
State:
$38,941
(% of AGI for various income ranges: 117.8% for AGIs below $10k, 74.5% for AGIs $10k-25k, 85.3% for AGIs $25k-50k, 87.0% for AGIs $50k-75k, 88.6% for AGIs $75k-100k, 76.5% for AGIs over 100k)
Taxable interest for individuals: $789 (reported on 38.1% of returns)
This zip code:
$789
Missouri:
$1,801
(% of AGI for various income ranges: 3.3% for AGIs below $10k, 1.4% for AGIs $10k-25k, 0.7% for AGIs $25k-50k, 0.4% for AGIs $50k-75k, 0.6% for AGIs $75k-100k, 0.8% for AGIs over 100k)
Taxable dividends: $894 (reported on 15.7% of returns)
Here:
$894
State:
$3,677
(% of AGI for various income ranges: 2.0% for AGIs below $10k, 0.8% for AGIs $10k-25k, 0.3% for AGIs $25k-50k, 0.2% for AGIs $50k-75k, 0.1% for AGIs $75k-100k, 0.4% for AGIs over 100k)
Net capital gain/loss: +$3,516 (reported on 10.8% of returns)
Here:
+$3,516
State:
+$8,915
(% of AGI for various income ranges: -1.4% for AGIs below $10k, 0.4% for AGIs $10k-25k, -0.0% for AGIs $25k-50k, 0.7% for AGIs $50k-75k, 0.7% for AGIs $75k-100k, 3.3% for AGIs over 100k)
Profit/loss from business: +$6,858 (reported on 12.7% of returns)
Here:
+$6,858
State:
+$9,793
(% of AGI for various income ranges: 8.3% for AGIs below $10k, 3.6% for AGIs $10k-25k, 2.2% for AGIs $25k-50k, 2.2% for AGIs $50k-75k, 1.3% for AGIs $75k-100k, 1.4% for AGIs over 100k)
IRA payment deduction: $3,311 (reported on 2.1% of returns)
64058:
$3,311
Missouri:
$2,972
Total itemized deductions: $14,815 (22% of AGI, reported on 36.7% of returns)
Here:
$14,815
State:
$18,261
Here:
22.3% of AGI
State:
20.5% of AGI
(% of AGI for various income ranges: 9.7% for AGIs below $10k, 7.9% for AGIs $10k-25k, 11.3% for AGIs $25k-50k, 14.0% for AGIs $50k-75k, 15.2% for AGIs $75k-100k, 14.1% for AGIs over 100k)
Charity contributions deductions: $2,527 (4% of AGI, reported on 29.8% of returns)
Here:
$2,527
State:
$3,665
Here:
3.6% of AGI
State:
3.9% of AGI
(% of AGI for various income ranges: 0.5% for AGIs below $10k, 1.0% for AGIs $10k-25k, 1.3% for AGIs $25k-50k, 1.9% for AGIs $50k-75k, 2.0% for AGIs $75k-100k, 2.7% for AGIs over 100k)
Total tax: $4,830 (reported on 77.0% of returns)
64058:
$4,830
State:
$6,999
(% of AGI for various income ranges: 3.4% for AGIs below $10k, 3.9% for AGIs $10k-25k, 6.5% for AGIs $25k-50k, 8.3% for AGIs $50k-75k, 9.9% for AGIs $75k-100k, 15.0% for AGIs over 100k)
Earned income credit: $1,676 (reported on 14.4% of returns)
Here:
$1,676
State:
$1,728
Percentage of individuals using paid preparers for their 2004 taxes: 59.1%
Here:
59%
State:
62%
(% for various income ranges: 42.8% for AGIs below $10k, 61.7% for AGIs $10k-25k, 60.9% for AGIs $25k-50k, 63.0% for AGIs $50k-75k, 68.6% for AGIs $75k-100k, 64.2% for AGIs over 100k)
Household received Food Stamps/SNAP in the past 12 months: 227 Household did not receive Food Stamps/SNAP in the past 12 months: 2,223
Women who had a birth in the past 12 months: 56 (36 now married, 20 unmarried) Women who did not have a birth in the past 12 months: 1,286 (560 now married, 725 unmarried)
Housing units in zip code 64058 with a mortgage: 1,298 (38 second mortgage, 27 both second mortgage and home equity loan) Houses without a mortgage: 50
Median monthly owner costs for units with a mortgage: $1,471 Median monthly owner costs for units without a mortgage: $533
Residents with income below the poverty level in 2022:
This zip code:
8.7%
Whole state:
13.2%
Residents with income below 50% of the poverty level in 2022:
This zip code:
5.2%
Whole state:
6.8%
Median number of rooms in houses and condos:
Here:
6.3
State:
6.4
Median number of rooms in apartments:
Here:
5.8
State:
4.4
Notable locations in this zip code not listed on our city pages
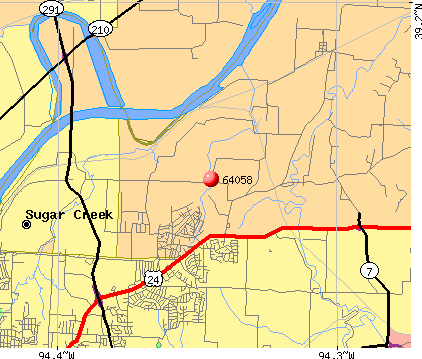
Notable locations in zip code 64058: Liberty Island (A), Camp Santosage (B), Camp Santa Fe Trail (C), Fort Osage Fire Protection District Station 3 (D). Display/hide their locations on the map
In group quarters: 95 (-1 institutionalized population)
Size of family households: 629 2-persons, 432 3-persons, 289 4-persons, 153 5-persons, 146 6-persons, 61 7-or-more-persons
Size of nonfamily households: 589 1-person, 149 2-persons
964 married couples with children.
484 single-parent households (377 men, 107 women).
96.6% of residents of 64058 zip code speak English at home.
2.0% of residents speak Spanish at home (57% very well, 23% well, 20% not well).
0.9% of residents speak other Indo-European language at home (100% very well).
0.3% of residents speak Asian or Pacific Island language at home (19% very well, 81% well).
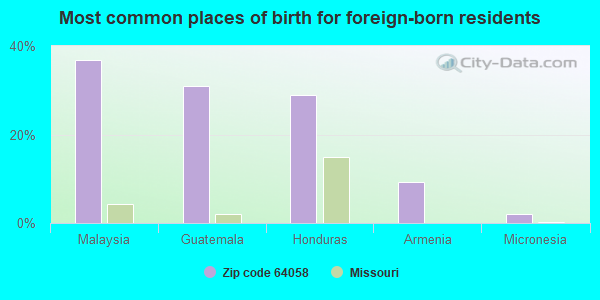
Foreign born population: 153 (2.3%) (96.8% of them are naturalized citizens)
Facilities with environmental interests located in this zip code:
FORT OSAGE SCHOOL (2101 NORTH TWYMAN ROAD in INDEPENDENCE, MO)
STATE MASTER (Missouri monitoring and compilance) - NCDB-C07#07-92-575, COMPLIANCE ACTIVITY, NCDB-I07#19920130R7017 1, NCDB-I07#19960209N7001 1, RCRAINFO-MOD985795574, NOT IN A UNIVERSE, RCRAINFO-MOR000503383, SQG COMPLIANCE ACTIVITY (Tracking inspections of insecticide, fungicide, and rodenticide, and toxic substances) (Resource Conservation and Recovery Act (tracking hazardous waste)) Small Quantity Generators, between 100 kg and 1000 kg of hazardous waste/month (Resource Conservation and Recovery Act (tracking hazardous waste)) Organizations: FORT OSAGE R-1 SCHOOL DISTRICY (CONTACT/OPERATOR)
, FT OSAGE R #1 SCHOOL DISTRICT (CONTACT/OWNER)
Alternative names: FORT OSAGE R-I SCHOOL DIST, FORT OSAGE R-I SCHOOL DIST(ROTH), FORT OSAGE R #1 SCHOOL DISTRICT, FORT OSAGE SCHOOL DISTRICT R-1
ROCCA PROCESSING (16400 EAST KENTUCKY ROAD in INDEPENDENCE, MO)
AIR MINOR (AIRS/AFS) STATE MASTER (Missouri monitoring and compilance) - AIRS/AFS-MO1015781, AIR MINOR, PCS-MOG490759, NPDES NON-MAJOR CRITERIA AND HAZARDOUS AIR POLLUTANT INVENTORY (Inventory of air pollution sources) National Pollutant Discharge Elimination System NON-MAJOR (Tracking pollutant discharge elimination systems) - permit Business SIC classification: CRUSHED AND BROKEN LIMESTONE Organizations: LAFARGE NORTH AMERICA INC (CONTACT/OWNER)
Alternative names: INDEPENDENCE QUARRY, LAFARGE - INDEPENDENCE QUARRY, LAFARGE NORTH AMERICA INC-INDEPENDENCE QUARRY, ROCCA CORP
PHILLIPS PET CO STATION #27074 (4208 S NOLAND RD in INDEPENDENCE, MO)
STATE MASTER (Missouri monitoring and compilance) - RCRAINFO-MOD985816131, CESQG (Resource Conservation and Recovery Act (tracking hazardous waste)) Organizations: PHILLIPS PETROLEUM COMPANY (CONTACT/OPERATOR)
, PHILLIPS PETROLEUM CO (CONTACT/OWNER)
RECOVERY AUCTION SERVICES (1600 NORTH STATE ROUTE 291 in INDEPENDENCE, MO)
STATE MASTER (Missouri monitoring and compilance) - RCRAINFO-MOR000011395, SQG Small Quantity Generators, between 100 kg and 1000 kg of hazardous waste/month (Resource Conservation and Recovery Act (tracking hazardous waste)) - notification Organizations: LOUIS D PACK (CONTACT/OPERATOR)
, RECOVERY MANAGEMENT CORP (CONTACT/OWNER)
Alternative names: RECOVERY MANAGEMENT CORP
QUIKTRIP STORE #201 (19010 HWY 24 in INDEPENDENCE, MO)
STATE MASTER (Missouri monitoring and compilance) - RCRAINFO-MOD985794692, CESQG Conditionally Exempt Small Quantity Generators, less than 100 kg/month of hazardous waste (Resource Conservation and Recovery Act (tracking hazardous waste)) Organizations: QUIKTRIP CORPORATION (CONTACT/OWNER)
BLUE HILLS ELEM. (2101 N TWYMAN RD in INDEPENDENCE, MO)
(National Center for Education Statistics) - STATE ID-4020048066 Organizations: FORT OSAGE R-I (SCHOOL DISTRICT)
BUCKNER ELEM. (2101 N TWYMAN RD in INDEPENDENCE, MO)
(National Center for Education Statistics) - STATE ID-4040048066 Organizations: FORT OSAGE R-I (SCHOOL DISTRICT)
OSAGE TRAIL MIDDLE (2101 N TWYMAN RD in INDEPENDENCE, MO)
(National Center for Education Statistics) - STATE ID-3000048066 Organizations: FORT OSAGE R-I (SCHOOL DISTRICT)
FIRE PRAIRIE MIDDLE (2101 N TWYMAN RD in INDEPENDENCE, MO)
(National Center for Education Statistics) - STATE ID-4110048066 Organizations: FORT OSAGE R-I (SCHOOL DISTRICT)
FLANGAN'S ORCHARD (2109 HINES RD in INDEPENDENCE, MO)
SUPERFUND (Superfund database) STATE MASTER (Missouri monitoring and compilance) - CERCLIS-MOD981717267, SUPERFUND Alternative names: FLANGAN S ORCHARD
FORT OSAGE HIGH (2101 N TWYMAN RD in INDEPENDENCE, MO)
(National Center for Education Statistics) - STATE ID-1050048066 Organizations: FORT OSAGE R-I (SCHOOL DISTRICT)
APAC MISSOURI-APAC - MISSOURI MATERIALS LLC (2601 N STATE ROUTE 291 HWY in INDEPENDENCE, MO)
CRITERIA AND HAZARDOUS AIR POLLUTANT INVENTORY (Inventory of air pollution sources) Business SIC classification: READY-MIXED CONCRETE
Housing units lacking complete plumbing facilities: 1.9% Housing units lacking complete kitchen facilities: 2.4%
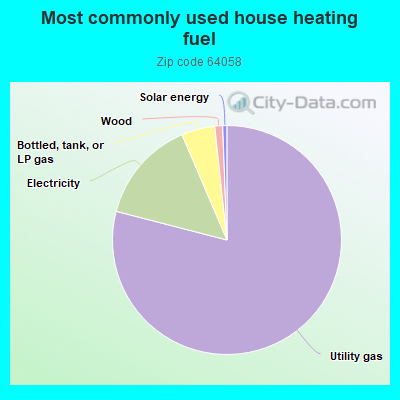
78.8%Utility gas
14.5%Electricity
4.7%Bottled, tank, or LP gas
1.1%Wood
0.6%Solar energy
Population in 1990: 5,752. Population change in the 1990s: +266 (+4.6%).
Place of birth for U.S.-born residents:
This state: 5,562
Northeast: 35
Midwest: 505
South: 244
West: 160
61% of the 64058 zip code residents lived in the same house 5 years ago. Out of people who lived in different houses, 79% lived in this county. Out of people who lived in different counties, 50% lived in Missouri.
93% of the 64058 zip code residents lived in the same house 1 year ago. Out of people who lived in different houses, 81% moved from this county. Out of people who lived in different houses, 5% moved from different county within same state. Out of people who lived in different houses, 12% moved from different state.
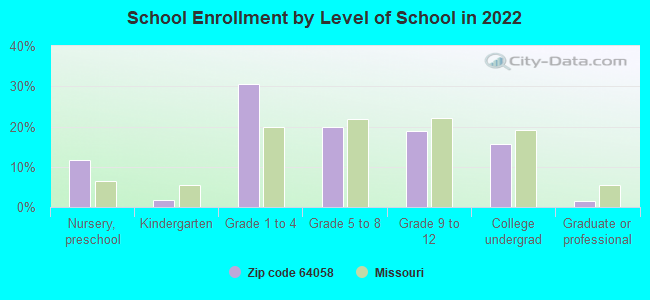
Private vs. public school enrollment:
Students in private schools in grades 1 to 8 (elementary and middle school): 106
Here:
12.4%
Missouri:
15.4%
Students in private schools in grades 9 to 12 (high school): 48
Here:
14.7%
Missouri:
13.9%
Students in private undergraduate colleges: 66
Here:
24.5%
Missouri:
22.6%
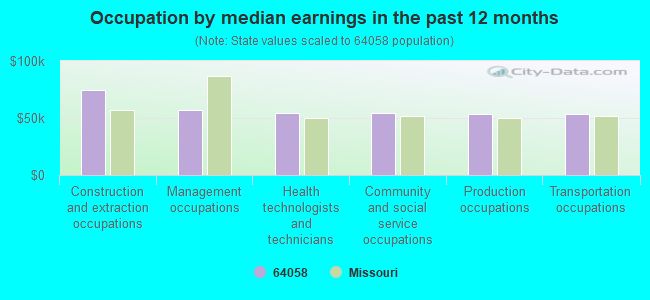
Occupation by median earnings in the past 12 months ($)
74,360Construction and extraction occupations
57,260Management occupations
54,475Health technologists and technicians
54,370Community and social service occupations
53,658Production occupations
53,529Transportation occupations
Companies with federal contracts located in this zip code:
ROLAND HUGHES (18202 E UNION SCHOOL RD in INDEPENDENCE, MO) : $36,780 in 6 contractsfrom 2001 to 2005
Contracts for Facilities Operations Support Services by U.S. Army Corps of Engineers - civil program financing only, Army Signed by year:2000: $0; 2001: $1,100; 2002: $0; 2003: $0; 2004: $17,840; 2005: $17,840; 2006: $0.
Biggest contracts:
$8,920 with U.S. Army Corps of Engineers - civil program financing only for Facilities Operations Support Services. Signed on 2005-02-10. Completion date: 2004-04-15.
$8,920 with Army for Facilities Operations Support Services. Signed on 2005-02-10. Completion date: 2004-04-15.
$8,920 with U.S. Army Corps of Engineers - civil program financing only for Facilities Operations Support Services. Signed on 2004-01-21. Completion date: 2004-04-15.
$8,920 with Army for Facilities Operations Support Services. Signed on 2004-01-21. Completion date: 2004-04-15.
BLUE JAY MANUFACTURING CO (1600 N STATE ROUTE 291 in INDEPENDENCE, MO; small business) : $25,593 in 6 contractsfrom 2004 to 2006
Contracts for Liquid and Gas Flow, Liquid Level, and Mechanical Motion Measuring Instruments, Lubrication and Fuel Dispensing Equipment, Valves, Nonpowered by Defense Logistics Agency Signed by year:2000: $0; 2001: $0; 2002: $0; 2003: $0; 2004: $4,335; 2005: $17,390; 2006: $3,868.
Biggest contracts:
$5,126 with Defense Logistics Agency for Liquid and Gas Flow, Liquid Level, and Mechanical Motion Measuring Instruments. Signed on 2005-03-19. Completion date: 2005-05-25.
$4,963, same as above.Signed on 2005-11-18. Completion date: 2006-01-25.
$4,335 with Defense Logistics Agency for Lubrication and Fuel Dispensing Equipment. Signed on 2004-10-21. Completion date: 2005-02-19.
$3,900 with Defense Logistics Agency for Valves, Nonpowered. Signed on 2005-07-25. Completion date: 2005-09-23.
Top industries in this zip code by the number of employees in 2005:
Health Care and Social Assistance: Ambulance Services (100-249 employees: 1 establishment)
Construction: Commercial and Institutional Building Construction (20-49: 1, 10-19: 1, 1-4: 1)
Health Care and Social Assistance: Homes for the Elderly (20-49: 1)
Construction: Painting and Wall Covering Contractors (5-9: 2, 1-4: 2)
Construction: All Other Specialty Trade Contractors (5-9: 2, 1-4: 1)
People in group quarters in 2010:
41 people in nursing facilities/skilled-nursing facilities
26 people in residential treatment centers for juveniles (non-correctional)
25 people in workers' group living quarters and job corps centers
10 people in group homes for juveniles (non-correctional)
5 people in group homes intended for adults
People in group quarters in 2000:
36 people in nursing homes
5 people in other noninstitutional group quarters
Fatal accident statistics in 2014:
Fatal accident count: 1
Vehicles involved in fatal accidents: 1
Fatal accidents caused by drunken drivers: 0
Fatalities: 1
Persons involved in fatal accidents: 1
Pedestrians involved in fatal accidents: 0
Fatal accident statistics in 2013:
Fatal accident count: 1
Vehicles involved in fatal accidents: 1
Fatal accidents caused by drunken drivers: 0
Fatalities: 1
Persons involved in fatal accidents: 1
Pedestrians involved in fatal accidents: 0
Home Mortgage Disclosure Act Aggregated Statistics For Year 2009 (Based on 6 partial tracts)
A) FHA, FSA/RHS & VA Home Purchase Loans
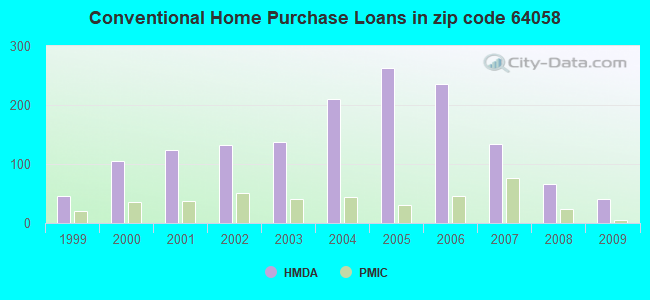
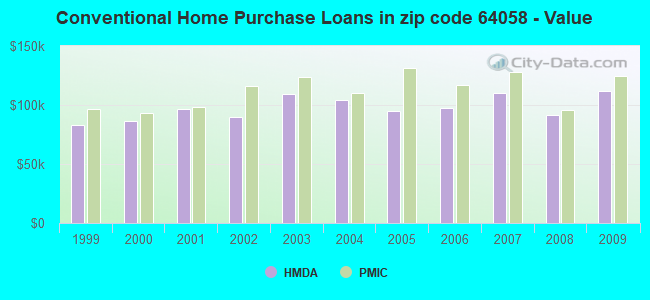
B) Conventional Home Purchase Loans
C) Refinancings
D) Home Improvement Loans
E) Loans on Dwellings For 5+ Families
F) Non-occupant Loans on < 5 Family Dwellings (A B C & D)
G) Loans On Manufactured Home Dwelling (A B C & D)
Number
Average Value
Number
Average Value
Number
Average Value
Number
Average Value
Number
Average Value
Number
Average Value
Number
Average Value
LOANS ORIGINATED
79
$108,791
41
$111,970
242
$136,086
15
$41,856
2
$544,250
10
$93,270
1
$185,270
APPLICATIONS APPROVED, NOT ACCEPTED
1
$48,870
5
$128,068
22
$135,330
6
$12,103
0
$0
0
$0
0
$0
APPLICATIONS DENIED
15
$75,166
9
$153,021
102
$152,615
21
$21,520
0
$0
5
$75,884
0
$0
APPLICATIONS WITHDRAWN
9
$116,028
4
$119,900
88
$116,262
9
$54,598
0
$0
5
$124,090
0
$0
FILES CLOSED FOR INCOMPLETENESS
2
$94,855
0
$0
16
$118,607
0
$0
0
$0
0
$0
0
$0
Aggregated Statistics For Year 2008 (Based on 6 partial tracts)
A) FHA, FSA/RHS & VA Home Purchase Loans
B) Conventional Home Purchase Loans
C) Refinancings
D) Home Improvement Loans
F) Non-occupant Loans on < 5 Family Dwellings (A B C & D)
G) Loans On Manufactured Home Dwelling (A B C & D)
Number
Average Value
Number
Average Value
Number
Average Value
Number
Average Value
Number
Average Value
Number
Average Value
LOANS ORIGINATED
86
$115,012
66
$91,724
188
$128,770
21
$39,938
42
$79,814
2
$171,410
APPLICATIONS APPROVED, NOT ACCEPTED
4
$128,697
6
$63,755
31
$139,301
5
$60,460
0
$0
0
$0
APPLICATIONS DENIED
15
$153,292
7
$101,696
168
$135,462
34
$51,986
9
$96,197
1
$223,200
APPLICATIONS WITHDRAWN
7
$125,734
5
$117,930
87
$130,944
4
$28,112
4
$82,202
0
$0
FILES CLOSED FOR INCOMPLETENESS
2
$68,420
1
$50,330
13
$132,528
2
$81,640
2
$109,135
0
$0
Aggregated Statistics For Year 2007 (Based on 6 partial tracts)
A) FHA, FSA/RHS & VA Home Purchase Loans
B) Conventional Home Purchase Loans
C) Refinancings
D) Home Improvement Loans
F) Non-occupant Loans on < 5 Family Dwellings (A B C & D)
G) Loans On Manufactured Home Dwelling (A B C & D)
Number
Average Value
Number
Average Value
Number
Average Value
Number
Average Value
Number
Average Value
Number
Average Value
LOANS ORIGINATED
42
$120,144
134
$109,881
216
$113,454
39
$42,674
30
$82,669
4
$82,240
APPLICATIONS APPROVED, NOT ACCEPTED
0
$0
21
$95,318
49
$121,336
7
$28,471
3
$43,790
2
$114,880
APPLICATIONS DENIED
12
$135,561
36
$109,801
216
$111,460
42
$88,024
11
$107,038
1
$57,620
APPLICATIONS WITHDRAWN
0
$0
18
$76,029
116
$122,009
21
$91,330
15
$79,441
1
$37,930
FILES CLOSED FOR INCOMPLETENESS
2
$174,160
6
$98,215
31
$110,715
6
$82,918
1
$61,270
0
$0
Aggregated Statistics For Year 2006 (Based on 6 partial tracts)
A) FHA, FSA/RHS & VA Home Purchase Loans
B) Conventional Home Purchase Loans
C) Refinancings
D) Home Improvement Loans
F) Non-occupant Loans on < 5 Family Dwellings (A B C & D)
G) Loans On Manufactured Home Dwelling (A B C & D)
Number
Average Value
Number
Average Value
Number
Average Value
Number
Average Value
Number
Average Value
Number
Average Value
LOANS ORIGINATED
45
$111,549
235
$97,782
318
$105,989
55
$30,518
57
$93,143
2
$84,245
APPLICATIONS APPROVED, NOT ACCEPTED
0
$0
47
$100,701
69
$124,323
13
$61,594
12
$95,789
1
$80,960
APPLICATIONS DENIED
0
$0
80
$105,784
283
$117,076
74
$56,532
12
$77,232
4
$57,178
APPLICATIONS WITHDRAWN
3
$126,993
35
$101,396
158
$113,741
11
$61,302
5
$75,396
0
$0
FILES CLOSED FOR INCOMPLETENESS
1
$142,960
15
$105,709
42
$122,632
0
$0
2
$152,440
1
$142,960
Aggregated Statistics For Year 2005 (Based on 6 partial tracts)
A) FHA, FSA/RHS & VA Home Purchase Loans
B) Conventional Home Purchase Loans
C) Refinancings
D) Home Improvement Loans
F) Non-occupant Loans on < 5 Family Dwellings (A B C & D)
G) Loans On Manufactured Home Dwelling (A B C & D)
Number
Average Value
Number
Average Value
Number
Average Value
Number
Average Value
Number
Average Value
Number
Average Value
LOANS ORIGINATED
47
$126,829
263
$94,769
398
$103,089
52
$39,259
58
$84,082
1
$55,430
APPLICATIONS APPROVED, NOT ACCEPTED
5
$161,476
48
$98,399
70
$98,994
7
$27,397
16
$94,724
2
$17,885
APPLICATIONS DENIED
2
$101,075
76
$89,541
294
$116,554
63
$36,058
19
$78,974
5
$76,028
APPLICATIONS WITHDRAWN
0
$0
35
$114,217
202
$115,504
21
$105,724
10
$143,572
0
$0
FILES CLOSED FOR INCOMPLETENESS
0
$0
8
$102,992
34
$99,875
2
$128,895
2
$90,970
1
$62,000
Aggregated Statistics For Year 2004 (Based on 6 partial tracts)
A) FHA, FSA/RHS & VA Home Purchase Loans
B) Conventional Home Purchase Loans
C) Refinancings
D) Home Improvement Loans
F) Non-occupant Loans on < 5 Family Dwellings (A B C & D)
G) Loans On Manufactured Home Dwelling (A B C & D)
Number
Average Value
Number
Average Value
Number
Average Value
Number
Average Value
Number
Average Value
Number
Average Value
LOANS ORIGINATED
49
$107,431
210
$104,643
462
$110,160
43
$52,064
69
$118,117
4
$80,815
APPLICATIONS APPROVED, NOT ACCEPTED
1
$46,680
37
$107,589
73
$94,643
5
$56,110
8
$121,441
4
$118,635
APPLICATIONS DENIED
11
$106,285
80
$87,908
247
$96,003
38
$36,810
20
$102,462
4
$40,300
APPLICATIONS WITHDRAWN
1
$130,560
21
$73,597
212
$96,249
12
$96,680
12
$71,940
0
$0
FILES CLOSED FOR INCOMPLETENESS
0
$0
12
$82,573
59
$100,239
2
$19,440
2
$46,650
0
$0
Aggregated Statistics For Year 2003 (Based on 6 partial tracts)
A) FHA, FSA/RHS & VA Home Purchase Loans
B) Conventional Home Purchase Loans
C) Refinancings
D) Home Improvement Loans
F) Non-occupant Loans on < 5 Family Dwellings (A B C & D)
Number
Average Value
Number
Average Value
Number
Average Value
Number
Average Value
Number
Average Value
LOANS ORIGINATED
63
$100,729
137
$109,625
714
$94,427
24
$15,592
55
$92,298
APPLICATIONS APPROVED, NOT ACCEPTED
0
$0
24
$116,012
94
$95,195
2
$10,110
9
$124,746
APPLICATIONS DENIED
5
$82,726
42
$87,427
251
$97,656
21
$12,104
11
$72,596
APPLICATIONS WITHDRAWN
5
$111,656
23
$95,727
197
$95,990
2
$15,550
3
$138,597
FILES CLOSED FOR INCOMPLETENESS
0
$0
19
$168,701
40
$108,873
0
$0
9
$261,240
Aggregated Statistics For Year 2002 (Based on 6 partial tracts)
A) FHA, FSA/RHS & VA Home Purchase Loans
B) Conventional Home Purchase Loans
C) Refinancings
D) Home Improvement Loans
F) Non-occupant Loans on < 5 Family Dwellings (A B C & D)
Number
Average Value
Number
Average Value
Number
Average Value
Number
Average Value
Number
Average Value
LOANS ORIGINATED
53
$102,053
133
$90,151
467
$96,090
26
$20,445
50
$91,454
APPLICATIONS APPROVED, NOT ACCEPTED
2
$96,410
13
$108,439
59
$97,702
1
$5,840
9
$146,729
APPLICATIONS DENIED
6
$104,310
28
$74,134
185
$87,720
24
$12,285
4
$218,812
APPLICATIONS WITHDRAWN
3
$87,600
12
$81,514
194
$94,820
1
$10,940
9
$83,750
FILES CLOSED FOR INCOMPLETENESS
0
$0
5
$107,696
43
$89,966
0
$0
5
$81,882
Aggregated Statistics For Year 2001 (Based on 6 partial tracts)
A) FHA, FSA/RHS & VA Home Purchase Loans
B) Conventional Home Purchase Loans
C) Refinancings
D) Home Improvement Loans
E) Loans on Dwellings For 5+ Families
F) Non-occupant Loans on < 5 Family Dwellings (A B C & D)
Number
Average Value
Number
Average Value
Number
Average Value
Number
Average Value
Number
Average Value
Number
Average Value
LOANS ORIGINATED
62
$86,237
124
$96,767
431
$88,617
41
$95,793
1
$148,800
38
$75,970
APPLICATIONS APPROVED, NOT ACCEPTED
0
$0
13
$72,265
42
$73,535
5
$14,248
0
$0
2
$108,425
APPLICATIONS DENIED
9
$95,831
21
$80,984
182
$78,750
31
$25,798
0
$0
9
$77,596
APPLICATIONS WITHDRAWN
6
$74,232
10
$93,383
148
$90,263
6
$35,507
0
$0
5
$76,446
FILES CLOSED FOR INCOMPLETENESS
0
$0
4
$191,020
30
$77,539
0
$0
0
$0
0
$0
Aggregated Statistics For Year 2000 (Based on 6 partial tracts)
A) FHA, FSA/RHS & VA Home Purchase Loans
B) Conventional Home Purchase Loans
C) Refinancings
D) Home Improvement Loans
F) Non-occupant Loans on < 5 Family Dwellings (A B C & D)
Number
Average Value
Number
Average Value
Number
Average Value
Number
Average Value
Number
Average Value
LOANS ORIGINATED
72
$81,444
105
$86,176
124
$76,261
36
$13,918
18
$59,056
APPLICATIONS APPROVED, NOT ACCEPTED
2
$72,450
16
$72,616
46
$72,918
17
$14,951
2
$105,430
APPLICATIONS DENIED
0
$0
28
$75,251
102
$66,554
36
$15,994
2
$7,775
APPLICATIONS WITHDRAWN
7
$72,646
13
$85,998
42
$63,286
7
$30,294
4
$81,108
FILES CLOSED FOR INCOMPLETENESS
2
$57,535
6
$84,675
18
$88,654
0
$0
1
$105,760
Aggregated Statistics For Year 1999 (Based on 3 partial tracts)
A) FHA, FSA/RHS & VA Home Purchase Loans
B) Conventional Home Purchase Loans
C) Refinancings
D) Home Improvement Loans
F) Non-occupant Loans on < 5 Family Dwellings (A B C & D)
Detailed PMIC statistics for the following Tracts:0150.00
, 0151.00
2002 - 2018 National Fire Incident Reporting System (NFIRS) incidents
Based on the data from the years 2002 - 2018 the average number of fires per year is 26. The highest number of fire incidents - 42 took place in 2006, and the least - 5 in 2017. The data has a declining trend.
When looking into fire subcategories, the most reports belonged to: Outside Fires (48.1%), and Structure Fires (27.0%).
Fire incident types reported to NFIRS in Zip Code 64058


 Nearest zip codes: 64056, 64072, 64057, 64016, 64050, 64068.


 Based on the data from the years 2002 - 2018 the average number of fires per year is 26. The highest number of fire incidents - 42 took place in 2006, and the least - 5 in 2017. The data has a declining trend.
 When looking into fire subcategories, the most reports belonged to: Outside Fires (48.1%), and Structure Fires (27.0%).