Estimated zip code population in 2022: 3,513 Zip code population in 2010: 2,462 Zip code population in 2000: 2,164
Houses and condos: 1,363 Renter-occupied apartments: 113
% of renters here:
9%
State:
32%
March 2022 cost of living index in zip code 63377: 85.5 (less than average, U.S. average is 100)
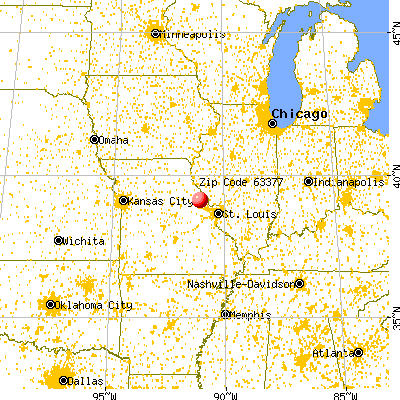
Land area: 132.0 sq. mi. Water area: 1.2 sq. mi.
Population density: 27 people per square mile
(very low).
OSM Map
General Map
Google Map
MSN Map
OSM Map
General Map
Google Map
MSN Map
OSM Map
General Map
Google Map
MSN Map
OSM Map
General Map
Google Map
MSN Map
Please wait while loading the map...
Real estate property taxes paid for housing units in 2022:
This zip code:
0.6% ($1,456)
Missouri:
0.8% ($1,810)
Median real estate property taxes paid for housing units with mortgages in 2022: $1,490 (0.6%) Median real estate property taxes paid for housing units with no mortgage in 2022: $1,445 (0.7%)
Business Search- 14 Million verified businesses
Males: 1,773
(50.5%)
Females: 1,740
(49.5%)
For population 25 years and over in 63377:
High school or higher: 85.6%
Bachelor's degree or higher: 20.9%
Graduate or professional degree: 5.6%
Unemployed: 5.2%
Mean travel time to work (commute): 33.6 minutes
For population 15 years and over in 63377:
Never married: 22.4%
Now married: 60.7%
Separated: 3.4%
Widowed: 8.0%
Divorced: 5.5%
Zip code 63377 compared to state average:
Black race population percentage significantly below state average.
Hispanic race population percentage significantly below state average.
Median age above state average.
Foreign-born population percentage significantly below state average.
Renting percentage significantly below state average.
House age below state average.
Number of college students significantly below state average.
Averages for the 2020 tax year for zip code 63377, filed in 2021:
Average Adjusted Gross Income (AGI) in 2020: $63,026 (Individual Income Tax Returns)
Here:
$63,026
State:
$68,151
Salary/wage: $58,438 (reported on 79.5% of returns)
Here:
$58,438
State:
$56,131
(% of AGI for various income ranges: 1302.0% for AGIs below $25k, 4221.6% for AGIs $25k-50k, 7911.7% for AGIs $50k-75k, 10211.8% for AGIs $75k-100k, 15355.4% for AGIs $100k-200k)
Taxable interest for individuals: $906 (reported on 39.3% of returns)
This zip code:
$906
Missouri:
$1,586
(% of AGI for various income ranges: 29.0% for AGIs below $25k, 40.5% for AGIs $25k-50k, 35.0% for AGIs $50k-75k, 76.4% for AGIs $75k-100k, 100.0% for AGIs $100k-200k)
Ordinary dividends: $3,375 (reported on 19.7% of returns)
Here:
$3,375
State:
$10,947
(% of AGI for various income ranges: 31.5% for AGIs below $25k, 43.7% for AGIs $25k-50k, 114.2% for AGIs $50k-75k, 135.5% for AGIs $75k-100k, 290.8% for AGIs $100k-200k)
Net capital gain/loss in AGI: +$10,013 (reported on 18.9% of returns)
Here:
+$10,013
State:
+$18,453
(% of AGI for various income ranges: 10.5% for AGIs below $25k, 48.9% for AGIs $25k-50k, 153.3% for AGIs $50k-75k, 215.5% for AGIs $75k-100k, 406.2% for AGIs $100k-200k)
Profit/loss from business: +$12,574 (reported on 18.9% of returns)
Here:
+$12,574
State:
+$12,260
(% of AGI for various income ranges: 144.5% for AGIs below $25k, 286.3% for AGIs $25k-50k, 342.5% for AGIs $50k-75k, 52.7% for AGIs $75k-100k, 1223.1% for AGIs $100k-200k)
Taxable individual retirement arrangement distribution: $14,264 (reported on 9.0% of returns)
63377:
$14,264
Missouri:
$19,719
(% of AGI for various income ranges: 54.0% for AGIs below $25k, 197.9% for AGIs $25k-50k, 405.5% for AGIs $75k-100k, 491.5% for AGIs $100k-200k)
Total itemized deductions: $28,183 (reported on 4.9% of returns)
Here:
$28,183
State:
$36,651
(% of AGI for various income ranges: 300.5% for AGIs below $25k, 838.5% for AGIs $100k-200k)
Charity contributions: $13,933 (reported on 2.5% of returns)
Here:
$13,933
State:
$15,671
(% of AGI for various income ranges: 321.5% for AGIs $100k-200k)
Taxes paid: $7,060 (reported on 4.1% of returns)
63377:
$7,060
State:
$7,608
(% of AGI for various income ranges: 47.0% for AGIs below $25k, 199.2% for AGIs $100k-200k)
Earned income credit: $2,464 (reported on 11.5% of returns)
Here:
$2,464
State:
$2,315
(% of AGI for various income ranges: 92.5% for AGIs below $25k, 84.2% for AGIs $25k-50k)
Percentage of individuals using paid preparers for their 2020 taxes: 89.3%
Here:
89%
State:
93%
(% for various income ranges: 91.2% for AGIs below $25k, 89.3% for AGIs $25k-50k, 85.0% for AGIs $50k-75k, 88.2% for AGIs $75k-100k, 89.5% for AGIs $100k-200k, 100.0% for AGIs over 200k)
Averages for the 2012 tax year for zip code 63377, filed in 2013:
Average Adjusted Gross Income (AGI) in 2012: $56,567 (Individual Income Tax Returns)
Here:
$56,567
State:
$55,896
Salary/wage: $43,551 (reported on 82.7% of returns)
Here:
$43,551
State:
$46,205
(% of AGI for various income ranges: 73.7% for AGIs below $25k, 74.3% for AGIs $25k-50k, 79.0% for AGIs $50k-75k, 74.7% for AGIs $75k-100k, 45.4% for AGIs $100k-200k)
Taxable interest for individuals: $1,174 (reported on 43.9% of returns)
This zip code:
$1,174
Missouri:
$1,559
(% of AGI for various income ranges: 1.8% for AGIs below $25k, 1.9% for AGIs $25k-50k, 0.4% for AGIs $50k-75k, 1.0% for AGIs $75k-100k, 0.5% for AGIs $100k-200k)
Ordinary dividends: $2,550 (reported on 24.5% of returns)
Here:
$2,550
State:
$7,410
(% of AGI for various income ranges: 0.7% for AGIs below $25k, 1.9% for AGIs $25k-50k, 0.9% for AGIs $50k-75k, 0.9% for AGIs $75k-100k, 1.1% for AGIs $100k-200k)
Net capital gain/loss in AGI: +$7,138 (reported on 16.3% of returns)
Here:
+$7,138
State:
+$11,579
(% of AGI for various income ranges: 1.8% for AGIs $25k-50k, 1.4% for AGIs $50k-75k, 1.3% for AGIs $75k-100k, 3.2% for AGIs $100k-200k)
Profit/loss from business: +$7,956 (reported on 16.3% of returns)
Here:
+$7,956
State:
+$11,688
(% of AGI for various income ranges: 10.7% for AGIs below $25k, 5.8% for AGIs $25k-50k, 2.3% for AGIs $50k-75k, 0.3% for AGIs $100k-200k)
Taxable individual retirement arrangement distribution: $15,027 (reported on 11.2% of returns)
63377:
$15,027
Missouri:
$14,773
(% of AGI for various income ranges: 2.3% for AGIs below $25k, 2.3% for AGIs $25k-50k, 5.0% for AGIs $50k-75k, 3.7% for AGIs $100k-200k)
Total itemized deductions: $19,465 (17% of AGI, reported on 26.5% of returns)
Here:
$19,465
State:
$22,730
Here:
17.4% of AGI
State:
19.2% of AGI
(% of AGI for various income ranges: 8.0% for AGIs below $25k, 8.6% for AGIs $25k-50k, 8.9% for AGIs $50k-75k, 10.4% for AGIs $75k-100k, 9.1% for AGIs $100k-200k)
Charity contributions: $2,950 (reported on 20.4% of returns)
Here:
$2,950
State:
$4,745
(% of AGI for various income ranges: 1.3% for AGIs $25k-50k, 1.0% for AGIs $50k-75k, 1.2% for AGIs $75k-100k, 1.1% for AGIs $100k-200k)
Taxes paid: $6,935 (reported on 26.5% of returns)
63377:
$6,935
State:
$8,399
(% of AGI for various income ranges: 1.0% for AGIs below $25k, 1.6% for AGIs $25k-50k, 2.3% for AGIs $50k-75k, 2.9% for AGIs $75k-100k, 4.9% for AGIs $100k-200k)
Earned income credit: $2,300 (reported on 16.3% of returns)
Here:
$2,300
State:
$2,288
(% of AGI for various income ranges: 6.0% for AGIs below $25k, 1.3% for AGIs $25k-50k)
Percentage of individuals using paid preparers for their 2012 taxes: 72.4%
Here:
72%
State:
55%
(% for various income ranges: 63.9% for AGIs below $25k, 75.0% for AGIs $25k-50k, 76.5% for AGIs $50k-75k, 81.8% for AGIs $75k-100k, 80.0% for AGIs $100k-200k)
Averages for the 2004 tax year for zip code 63377, filed in 2005:
Average Adjusted Gross Income (AGI) in 2004: $40,045 (Individual Income Tax Returns)
Here:
$40,045
State:
$44,591
Salary/wage: $37,642 (reported on 82.2% of returns)
Here:
$37,642
State:
$38,941
(% of AGI for various income ranges: 104.8% for AGIs below $10k, 72.1% for AGIs $10k-25k, 81.6% for AGIs $25k-50k, 82.3% for AGIs $50k-75k, 88.7% for AGIs $75k-100k, 54.6% for AGIs over 100k)
Taxable interest for individuals: $1,889 (reported on 51.8% of returns)
This zip code:
$1,889
Missouri:
$1,801
(% of AGI for various income ranges: 3.5% for AGIs below $10k, 5.5% for AGIs $10k-25k, 2.2% for AGIs $25k-50k, 2.2% for AGIs $50k-75k, 0.9% for AGIs $75k-100k, 2.6% for AGIs over 100k)
Taxable dividends: $1,429 (reported on 23.5% of returns)
Here:
$1,429
State:
$3,677
(% of AGI for various income ranges: 1.4% for AGIs below $10k, 1.8% for AGIs $10k-25k, 0.6% for AGIs $25k-50k, 0.9% for AGIs $50k-75k, 0.9% for AGIs $75k-100k, 0.5% for AGIs over 100k)
Net capital gain/loss: +$9,036 (reported on 20.2% of returns)
Here:
+$9,036
State:
+$8,915
(% of AGI for various income ranges: -1.2% for AGIs below $10k, 1.8% for AGIs $10k-25k, 1.1% for AGIs $25k-50k, 2.5% for AGIs $50k-75k, 1.5% for AGIs $75k-100k, 16.7% for AGIs over 100k)
Profit/loss from business: +$4,453 (reported on 20.1% of returns)
Here:
+$4,453
State:
+$9,793
(% of AGI for various income ranges: 9.2% for AGIs below $10k, 7.7% for AGIs $10k-25k, 3.4% for AGIs $25k-50k, 1.3% for AGIs $50k-75k, 0.0% for AGIs $75k-100k, 0.4% for AGIs over 100k)
IRA payment deduction: $3,000 (reported on 1.3% of returns)
63377:
$3,000
Missouri:
$2,972
Total itemized deductions: $15,290 (22% of AGI, reported on 26.4% of returns)
Here:
$15,290
State:
$18,261
Here:
21.7% of AGI
State:
20.5% of AGI
(% of AGI for various income ranges: 6.5% for AGIs $10k-25k, 9.2% for AGIs $25k-50k, 11.1% for AGIs $50k-75k, 11.8% for AGIs $75k-100k, 11.1% for AGIs over 100k)
Charity contributions deductions: $2,327 (3% of AGI, reported on 21.2% of returns)
Here:
$2,327
State:
$3,665
Here:
3.1% of AGI
State:
3.9% of AGI
(% of AGI for various income ranges: 0.7% for AGIs $10k-25k, 1.2% for AGIs $25k-50k, 1.4% for AGIs $50k-75k, 1.3% for AGIs $75k-100k, 1.4% for AGIs over 100k)
Total tax: $4,550 (reported on 78.2% of returns)
63377:
$4,550
State:
$6,999
(% of AGI for various income ranges: 5.0% for AGIs below $10k, 4.7% for AGIs $10k-25k, 6.4% for AGIs $25k-50k, 8.1% for AGIs $50k-75k, 10.0% for AGIs $75k-100k, 14.8% for AGIs over 100k)
Earned income credit: $1,748 (reported on 12.5% of returns)
Here:
$1,748
State:
$1,728
Percentage of individuals using paid preparers for their 2004 taxes: 70.9%
Here:
71%
State:
62%
(% for various income ranges: 60.6% for AGIs below $10k, 70.0% for AGIs $10k-25k, 74.6% for AGIs $25k-50k, 75.3% for AGIs $50k-75k, 74.4% for AGIs $75k-100k, 72.3% for AGIs over 100k)
Household received Food Stamps/SNAP in the past 12 months: 74 Household did not receive Food Stamps/SNAP in the past 12 months: 1,137
Women who had a birth in the past 12 months: 36 (34 now married, 1 unmarried) Women who did not have a birth in the past 12 months: 537 (304 now married, 230 unmarried)
Housing units in zip code 63377 with a mortgage: 402 (12 second mortgage, 4 both second mortgage and home equity loan) Houses without a mortgage: 4
Median monthly owner costs for units with a mortgage: $1,274 Median monthly owner costs for units without a mortgage: $457
Residents with income below the poverty level in 2022:
This zip code:
14.6%
Whole state:
13.2%
Residents with income below 50% of the poverty level in 2022:
This zip code:
2.2%
Whole state:
6.8%
Median number of rooms in houses and condos:
Here:
6.1
State:
6.4
Median number of rooms in apartments:
Here:
5.9
State:
4.4
Notable locations in this zip code not listed on our city pages
Churches in zip code 63377 include: New Liberty Church (A), Mill Creek Church (B), Fairview Church (C), Saint Alphonsus Parish (D). Display/hide their locations on the map
Cemeteries: Mill Creek Cemetery (1), Kinion Cemetery (2), Ellis Cemetery (3), McDonald Cemetery (4), Morris Cemetery (5), Old Liberty Cemetery (6), Parson Cemetery (7). Display/hide their locations on the map
Lakes and reservoirs: Old Negro Pond (A), Number One Lake (B), Number Two Lake (C), Number Three Lake (D), Number Four Lake (E), Number Five Lake (F), Reliable Chemical Company Lake (G), William Logan State Wildlife Area Lake (H). Display/hide their locations on the map
Streams, rivers, and creeks: Draper Branch (A), Sitton Branch (B), Peasel Branch (C), Lolar Branch (D), Buck Creek (E), Bracht Branch (F), Nulls Creek (G), Sulphur Creek (H), Big Lead Creek (I). Display/hide their locations on the map
Parks in zip code 63377 include: William Logan State Wildlife Area (1), Vonaventure State Memorial Forest And (2), White Memorial State Wildlife Area (3). Display/hide their locations on the map
In group quarters: 101 (-1 institutionalized population)
Size of family households: 325 2-persons, 160 3-persons, 240 4-persons, 64 5-persons, 39 6-persons, 58 7-or-more-persons
Size of nonfamily households: 292 1-person, 16 2-persons, 3 3-persons
488 married couples with children.
31 single-parent households (13 men, 18 women).
99.0% of residents of 63377 zip code speak English at home.
0.2% of residents speak Spanish at home (100% well).
0.1% of residents speak other Indo-European language at home (100% very well).
0.5% of residents speak Asian or Pacific Island language at home (100% very well).
Foreign born population: 24 (0.7%) (100.0% of them are naturalized citizens)
This zip code:
0.7%
Whole state:
4.1%
92%Malaysia
12%Poland
8%France
30%American
19%Italian
19%German
12%Irish
4%European
3%Polish
3%English
Year of entry for the foreign-born population
232010 or later
02000 to 2009
01990 to 1999
14Before 1990
Facilities with environmental interests located in this zip code:
HARBISON-WALKER REFRACTOR (RT 1, HWY UU, SILEX in SILEX, MO)
STATE MASTER (Missouri monitoring and compilance) - PCS-MOG840023, NPDES NON-MAJOR National Pollutant Discharge Elimination System NON-MAJOR (Tracking pollutant discharge elimination systems) - permit Business SIC classification: CLAY, CERAMIC, AND REFRACTORY MINERALS Alternative names: HWR, TUCKER PIT
B & J SEPTIC (755 MARY JO ROAD in SILEX, MO)
STATE MASTER (Missouri monitoring and compilance) - PCS-MOG821103, NPDES NON-MAJOR National Pollutant Discharge Elimination System NON-MAJOR (Tracking pollutant discharge elimination systems) - permit Business SIC classification: REFUSE SYSTEMS Organizations: BERNARD MENNE (CONTACT/OWNER)
Alternative names: BERNARD MENNE
FALCON POINTE (239 HWY RA in SILEX, MO)
National Pollutant Discharge Elimination System NON-MAJOR (Tracking pollutant discharge elimination systems) - permit Business SIC classification: HEAVY CONSTRUCTION Organizations: MEL COLE (CONTACT/OWNER)
Alternative names: MEL COLE
Housing units lacking complete plumbing facilities: 1.6% Housing units lacking complete kitchen facilities: 0.8%
58.7%Electricity
31.5%Bottled, tank, or LP gas
6.9%Utility gas
3.2%Wood
Population in 1990: 2,913.
Place of birth for U.S.-born residents:
This state: 2,921
Northeast: 10
Midwest: 196
South: 145
West: 200
71% of the 63377 zip code residents lived in the same house 5 years ago. Out of people who lived in different houses, 49% lived in this county. Out of people who lived in different counties, 50% lived in Missouri.
94% of the 63377 zip code residents lived in the same house 1 year ago. Out of people who lived in different houses, 22% moved from this county. Out of people who lived in different houses, 79% moved from different county within same state. Out of people who lived in different houses, 5% moved from different state.
Private vs. public school enrollment:
Students in private schools in grades 1 to 8 (elementary and middle school):
Here:
0.0%
Missouri:
15.4%
Students in private schools in grades 9 to 12 (high school): 4
Here:
2.1%
Missouri:
13.9%
Students in private undergraduate colleges:
Here:
3.0%
Missouri:
22.6%
Occupation by median earnings in the past 12 months ($)
77,094Construction and extraction occupations
73,881Computer and mathematical occupations
68,406Management occupations
66,518Production occupations
64,836Sales and related occupations
59,800Installation, maintenance, and repair occupations
Top industries in this zip code by the number of employees in 2005:
Health Care and Social Assistance: Nursing Care Facilities (50-99 employees: 1 establishment)
Construction: Water and Sewer Line and Related Structures Construction (20-49: 1, 5-9: 1)
Accommodation and Food Services: Full-Service Restaurants (20-49: 1)
Wholesale Trade: Grain and Field Bean Merchant Wholesalers (10-19: 1, 5-9: 1)
Educational Services: Apprenticeship Training (10-19: 1)
Finance and Insurance: Commercial Banking (10-19: 1)
Health Care and Social Assistance: Residential Mental Health and Substance Abuse Facilities (10-19: 1)
Educational Services: Elementary and Secondary Schools (10-19: 1)
People in group quarters in 2010:
49 people in nursing facilities/skilled-nursing facilities
43 people in residential treatment centers for adults
21 people in residential treatment centers for juveniles (non-correctional)
People in group quarters in 2000:
98 people in nursing homes
Fatal accident statistics in 2014:
Fatal accident count: 1
Vehicles involved in fatal accidents: 2
Fatal accidents caused by drunken drivers: 1
Fatalities: 1
Persons involved in fatal accidents: 2
Pedestrians involved in fatal accidents: 0
Fatal accident statistics in 2013:
Fatal accident count: 1
Vehicles involved in fatal accidents: 1
Fatal accidents caused by drunken drivers: 1
Fatalities: 1
Persons involved in fatal accidents: 1
Pedestrians involved in fatal accidents: 0
Home Mortgage Disclosure Act Aggregated Statistics For Year 2009 (Based on 2 partial tracts)
A) FHA, FSA/RHS & VA Home Purchase Loans
B) Conventional Home Purchase Loans
C) Refinancings
D) Home Improvement Loans
E) Loans on Dwellings For 5+ Families
F) Non-occupant Loans on < 5 Family Dwellings (A B C & D)
G) Loans On Manufactured Home Dwelling (A B C & D)
Number
Average Value
Number
Average Value
Number
Average Value
Number
Average Value
Number
Average Value
Number
Average Value
Number
Average Value
LOANS ORIGINATED
42
$143,996
66
$142,014
386
$162,812
20
$77,575
1
$204,900
30
$89,473
32
$70,409
APPLICATIONS APPROVED, NOT ACCEPTED
6
$130,453
3
$112,287
19
$194,591
4
$20,490
0
$0
0
$0
2
$91,385
APPLICATIONS DENIED
7
$134,414
6
$175,122
107
$169,650
6
$53,957
1
$114,740
1
$221,290
7
$99,289
APPLICATIONS WITHDRAWN
7
$138,044
8
$290,549
56
$161,095
3
$166,927
0
$0
3
$79,773
2
$151,625
FILES CLOSED FOR INCOMPLETENESS
2
$194,655
1
$557,330
10
$167,772
2
$79,910
0
$0
0
$0
0
$0
Aggregated Statistics For Year 2008 (Based on 2 partial tracts)
A) FHA, FSA/RHS & VA Home Purchase Loans
B) Conventional Home Purchase Loans
C) Refinancings
D) Home Improvement Loans
F) Non-occupant Loans on < 5 Family Dwellings (A B C & D)
G) Loans On Manufactured Home Dwelling (A B C & D)
Number
Average Value
Number
Average Value
Number
Average Value
Number
Average Value
Number
Average Value
Number
Average Value
LOANS ORIGINATED
31
$127,197
92
$157,158
237
$173,378
11
$76,446
25
$112,088
37
$68,425
APPLICATIONS APPROVED, NOT ACCEPTED
2
$140,560
5
$103,434
24
$138,888
2
$55,735
0
$0
2
$83,600
APPLICATIONS DENIED
13
$108,376
20
$154,330
124
$167,978
19
$44,690
3
$59,010
19
$75,317
APPLICATIONS WITHDRAWN
7
$143,196
8
$198,548
44
$214,158
4
$124,170
2
$81,550
2
$92,205
FILES CLOSED FOR INCOMPLETENESS
3
$118,843
2
$89,335
11
$213,319
0
$0
0
$0
1
$22,950
Aggregated Statistics For Year 2007 (Based on 2 partial tracts)
A) FHA, FSA/RHS & VA Home Purchase Loans
B) Conventional Home Purchase Loans
C) Refinancings
D) Home Improvement Loans
E) Loans on Dwellings For 5+ Families
F) Non-occupant Loans on < 5 Family Dwellings (A B C & D)
G) Loans On Manufactured Home Dwelling (A B C & D)
Number
Average Value
Number
Average Value
Number
Average Value
Number
Average Value
Number
Average Value
Number
Average Value
Number
Average Value
LOANS ORIGINATED
18
$131,091
145
$146,301
232
$157,614
31
$48,065
1
$108,190
30
$136,709
49
$90,524
APPLICATIONS APPROVED, NOT ACCEPTED
2
$103,270
12
$138,444
43
$171,258
6
$33,603
0
$0
2
$84,830
3
$62,837
APPLICATIONS DENIED
6
$120,072
33
$121,351
159
$167,941
23
$60,757
0
$0
7
$153,967
26
$104,657
APPLICATIONS WITHDRAWN
3
$152,173
11
$149,615
63
$158,729
5
$102,942
0
$0
2
$159,000
2
$95,895
FILES CLOSED FOR INCOMPLETENESS
0
$0
5
$142,446
22
$180,461
0
$0
0
$0
0
$0
0
$0
Aggregated Statistics For Year 2006 (Based on 2 partial tracts)
A) FHA, FSA/RHS & VA Home Purchase Loans
B) Conventional Home Purchase Loans
C) Refinancings
D) Home Improvement Loans
F) Non-occupant Loans on < 5 Family Dwellings (A B C & D)
G) Loans On Manufactured Home Dwelling (A B C & D)
Number
Average Value
Number
Average Value
Number
Average Value
Number
Average Value
Number
Average Value
Number
Average Value
LOANS ORIGINATED
16
$142,252
225
$137,729
258
$146,740
28
$58,689
32
$139,793
48
$90,532
APPLICATIONS APPROVED, NOT ACCEPTED
2
$124,580
24
$132,707
56
$152,929
5
$75,404
6
$164,740
8
$78,579
APPLICATIONS DENIED
7
$107,250
56
$101,250
175
$140,578
35
$54,421
8
$211,048
32
$84,880
APPLICATIONS WITHDRAWN
1
$95,890
25
$121,202
86
$153,122
8
$36,472
4
$237,890
10
$85,566
FILES CLOSED FOR INCOMPLETENESS
0
$0
6
$139,058
25
$168,215
1
$241,780
0
$0
0
$0
Aggregated Statistics For Year 2005 (Based on 2 partial tracts)
A) FHA, FSA/RHS & VA Home Purchase Loans
B) Conventional Home Purchase Loans
C) Refinancings
D) Home Improvement Loans
E) Loans on Dwellings For 5+ Families
F) Non-occupant Loans on < 5 Family Dwellings (A B C & D)
G) Loans On Manufactured Home Dwelling (A B C & D)
Number
Average Value
Number
Average Value
Number
Average Value
Number
Average Value
Number
Average Value
Number
Average Value
Number
Average Value
LOANS ORIGINATED
20
$126,997
204
$126,697
291
$145,142
24
$79,023
1
$147,530
26
$99,928
37
$79,922
APPLICATIONS APPROVED, NOT ACCEPTED
2
$60,650
27
$91,977
39
$138,134
8
$40,570
0
$0
1
$118,840
11
$69,964
APPLICATIONS DENIED
6
$78,408
47
$90,854
144
$124,938
18
$51,544
0
$0
2
$128,675
47
$74,392
APPLICATIONS WITHDRAWN
1
$139,330
22
$125,250
92
$138,361
8
$155,416
0
$0
2
$117,205
8
$103,986
FILES CLOSED FOR INCOMPLETENESS
2
$104,910
12
$107,914
18
$146,982
2
$128,675
0
$0
0
$0
2
$112,285
Aggregated Statistics For Year 2004 (Based on 2 partial tracts)
A) FHA, FSA/RHS & VA Home Purchase Loans
B) Conventional Home Purchase Loans
C) Refinancings
D) Home Improvement Loans
F) Non-occupant Loans on < 5 Family Dwellings (A B C & D)
G) Loans On Manufactured Home Dwelling (A B C & D)
Number
Average Value
Number
Average Value
Number
Average Value
Number
Average Value
Number
Average Value
Number
Average Value
LOANS ORIGINATED
16
$120,020
152
$125,614
269
$127,711
23
$45,897
17
$114,792
48
$84,146
APPLICATIONS APPROVED, NOT ACCEPTED
2
$80,320
18
$108,187
51
$126,524
2
$95,485
2
$110,645
11
$75,031
APPLICATIONS DENIED
7
$130,200
47
$80,827
124
$130,607
12
$31,828
3
$69,940
52
$81,676
APPLICATIONS WITHDRAWN
5
$123,760
15
$104,635
93
$132,185
4
$61,470
2
$91,795
15
$82,069
FILES CLOSED FOR INCOMPLETENESS
2
$130,725
7
$76,809
12
$153,812
2
$80,320
1
$13,930
3
$101,357
Aggregated Statistics For Year 2003 (Based on 2 partial tracts)
A) FHA, FSA/RHS & VA Home Purchase Loans
B) Conventional Home Purchase Loans
C) Refinancings
D) Home Improvement Loans
E) Loans on Dwellings For 5+ Families
F) Non-occupant Loans on < 5 Family Dwellings (A B C & D)
Detailed PMIC statistics for the following Tracts:8102.00
2002 - 2018 National Fire Incident Reporting System (NFIRS) incidents
According to the data from the years 2002 - 2018 the average number of fire incidents per year is 12. The highest number of reported fires - 31 took place in 2006, and the least - 3 in 2013. The data has a decreasing trend.
When looking into fire subcategories, the most reports belonged to: Outside Fires (48.1%), and Structure Fires (35.0%).
Fire incident types reported to NFIRS in Zip Code 63377


 Nearest zip codes: 63387, 63370, 63349, 63379, 63344, 63381.


 According to the data from the years 2002 - 2018 the average number of fire incidents per year is 12. The highest number of reported fires - 31 took place in 2006, and the least - 3 in 2013. The data has a decreasing trend.
 When looking into fire subcategories, the most reports belonged to: Outside Fires (48.1%), and Structure Fires (35.0%).