Estimated zip code population in 2022: 5,497 Zip code population in 2010: 5,352 Zip code population in 2000: 5,330
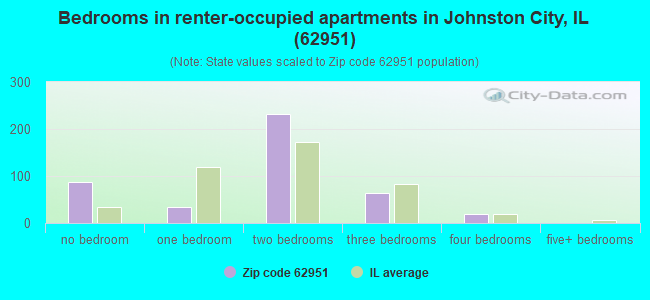
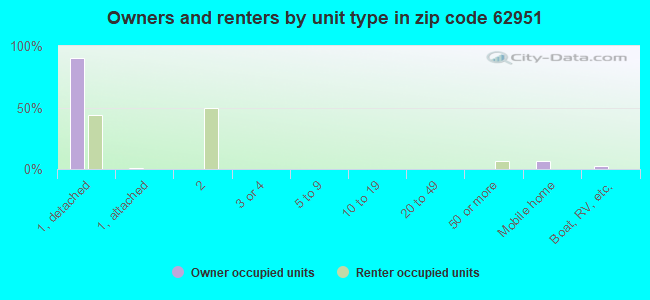
Houses and condos: 2,575 Renter-occupied apartments: 429
% of renters here:
18%
State:
33%
March 2022 cost of living index in zip code 62951: 74.1 (low, U.S. average is 100)
Land area: 24.7 sq. mi. Water area: 0.6 sq. mi.
Population density: 223 people per square mile
(very low).
OSM Map
General Map
Google Map
MSN Map
OSM Map
General Map
Google Map
MSN Map
OSM Map
General Map
Google Map
MSN Map
OSM Map
General Map
Google Map
MSN Map
Please wait while loading the map...
Real estate property taxes paid for housing units in 2022:
This zip code:
1.8% ($1,677)
Illinois:
2.0% ($4,912)
Median real estate property taxes paid for housing units with mortgages in 2022: $1,838 (1.8%) Median real estate property taxes paid for housing units with no mortgage in 2022: $1,273 (1.7%)
Averages for the 2020 tax year for zip code 62951, filed in 2021:
Average Adjusted Gross Income (AGI) in 2020: $46,417 (Individual Income Tax Returns)
Here:
$46,417
State:
$82,626
Salary/wage: $41,459 (reported on 81.7% of returns)
Here:
$41,459
State:
$66,640
(% of AGI for various income ranges: 1071.0% for AGIs below $25k, 3350.7% for AGIs $25k-50k, 5693.9% for AGIs $50k-75k, 9704.3% for AGIs $75k-100k, 15372.1% for AGIs $100k-200k)
Taxable interest for individuals: $912 (reported on 25.0% of returns)
This zip code:
$912
Illinois:
$2,376
(% of AGI for various income ranges: 9.0% for AGIs below $25k, 7.0% for AGIs $25k-50k, 43.9% for AGIs $50k-75k, 28.6% for AGIs $75k-100k, 201.4% for AGIs $100k-200k)
Ordinary dividends: $2,111 (reported on 11.2% of returns)
Here:
$2,111
State:
$9,061
(% of AGI for various income ranges: 9.3% for AGIs below $25k, 6.6% for AGIs $25k-50k, 53.6% for AGIs $50k-75k, 58.6% for AGIs $75k-100k, 168.6% for AGIs $100k-200k)
Net capital gain/loss in AGI: +$2,568 (reported on 9.2% of returns)
Here:
+$2,568
State:
+$31,684
(% of AGI for various income ranges: 0.9% for AGIs below $25k, 1.8% for AGIs $25k-50k, 47.9% for AGIs $50k-75k, 113.6% for AGIs $75k-100k, 182.9% for AGIs $100k-200k)
Profit/loss from business: +$5,597 (reported on 12.1% of returns)
Here:
+$5,597
State:
+$12,175
(% of AGI for various income ranges: 79.9% for AGIs below $25k, 57.3% for AGIs $25k-50k, 22.5% for AGIs $50k-75k, 247.1% for AGIs $75k-100k, 238.6% for AGIs $100k-200k)
Taxable individual retirement arrangement distribution: $11,011 (reported on 7.9% of returns)
62951:
$11,011
Illinois:
$21,613
(% of AGI for various income ranges: 57.0% for AGIs below $25k, 81.6% for AGIs $25k-50k, 235.7% for AGIs $50k-75k, 411.4% for AGIs $100k-200k)
Total itemized deductions: $30,900 (reported on 1.7% of returns)
Here:
$30,900
State:
$34,948
(% of AGI for various income ranges: 882.9% for AGIs $75k-100k)
Charity contributions: $11,667 (reported on 1.2% of returns)
Here:
$11,667
State:
$13,122
(% of AGI for various income ranges: 250.0% for AGIs $75k-100k)
Taxes paid: $6,225 (reported on 1.7% of returns)
62951:
$6,225
State:
$8,563
(% of AGI for various income ranges: 177.9% for AGIs $75k-100k)
Earned income credit: $2,362 (reported on 22.1% of returns)
Here:
$2,362
State:
$2,311
(% of AGI for various income ranges: 108.7% for AGIs below $25k, 87.7% for AGIs $25k-50k)
Percentage of individuals using paid preparers for their 2020 taxes: 94.6%
Here:
95%
State:
93%
(% for various income ranges: 94.4% for AGIs below $25k, 97.1% for AGIs $25k-50k, 94.4% for AGIs $50k-75k, 90.5% for AGIs $75k-100k, 91.3% for AGIs $100k-200k, 100.0% for AGIs over 200k)
Averages for the 2012 tax year for zip code 62951, filed in 2013:
Average Adjusted Gross Income (AGI) in 2012: $38,705 (Individual Income Tax Returns)
Here:
$38,705
State:
$68,058
Salary/wage: $36,098 (reported on 83.1% of returns)
Here:
$36,098
State:
$55,396
(% of AGI for various income ranges: 72.7% for AGIs below $25k, 78.4% for AGIs $25k-50k, 81.2% for AGIs $50k-75k, 81.5% for AGIs $75k-100k, 73.5% for AGIs $100k-200k)
Taxable interest for individuals: $934 (reported on 25.6% of returns)
This zip code:
$934
Illinois:
$1,969
(% of AGI for various income ranges: 1.3% for AGIs below $25k, 0.8% for AGIs $25k-50k, 0.4% for AGIs $50k-75k, 0.5% for AGIs $75k-100k, 0.3% for AGIs $100k-200k)
Ordinary dividends: $1,397 (reported on 13.6% of returns)
Here:
$1,397
State:
$7,786
(% of AGI for various income ranges: 0.7% for AGIs below $25k, 0.5% for AGIs $25k-50k, 0.6% for AGIs $50k-75k, 0.3% for AGIs $75k-100k, 0.4% for AGIs $100k-200k)
Net capital gain/loss in AGI: +$1,215 (reported on 8.3% of returns)
Here:
+$1,215
State:
+$22,183
(% of AGI for various income ranges: 0.4% for AGIs $25k-50k, 0.8% for AGIs $100k-200k)
Profit/loss from business: +$6,546 (reported on 14.5% of returns)
Here:
+$6,546
State:
+$12,903
(% of AGI for various income ranges: 6.6% for AGIs below $25k, 1.6% for AGIs $25k-50k, 1.4% for AGIs $50k-75k, 1.7% for AGIs $75k-100k, 2.0% for AGIs $100k-200k)
Taxable individual retirement arrangement distribution: $7,863 (reported on 7.9% of returns)
62951:
$7,863
Illinois:
$17,929
(% of AGI for various income ranges: 2.4% for AGIs below $25k, 1.9% for AGIs $25k-50k, 1.3% for AGIs $50k-75k, 3.1% for AGIs $75k-100k)
Total itemized deductions: $16,768 (21% of AGI, reported on 15.3% of returns)
Here:
$16,768
State:
$26,433
Here:
21.3% of AGI
State:
19.2% of AGI
(% of AGI for various income ranges: 2.9% for AGIs below $25k, 5.1% for AGIs $25k-50k, 6.2% for AGIs $50k-75k, 7.4% for AGIs $75k-100k, 10.3% for AGIs $100k-200k)
Charity contributions: $4,650 (reported on 9.1% of returns)
Here:
$4,650
State:
$4,525
(% of AGI for various income ranges: 0.9% for AGIs $25k-50k, 1.2% for AGIs $50k-75k, 1.0% for AGIs $75k-100k, 2.0% for AGIs $100k-200k)
Taxes paid: $5,635 (reported on 15.3% of returns)
62951:
$5,635
State:
$11,968
(% of AGI for various income ranges: 0.4% for AGIs below $25k, 1.2% for AGIs $25k-50k, 1.9% for AGIs $50k-75k, 2.6% for AGIs $75k-100k, 4.4% for AGIs $100k-200k)
Earned income credit: $2,297 (reported on 26.0% of returns)
Here:
$2,297
State:
$2,349
(% of AGI for various income ranges: 8.1% for AGIs below $25k, 1.4% for AGIs $25k-50k)
Percentage of individuals using paid preparers for their 2012 taxes: 58.3%
Here:
58%
State:
57%
(% for various income ranges: 56.1% for AGIs below $25k, 58.1% for AGIs $25k-50k, 59.4% for AGIs $50k-75k, 66.7% for AGIs $75k-100k, 62.5% for AGIs $100k-200k)
Averages for the 2004 tax year for zip code 62951, filed in 2005:
Average Adjusted Gross Income (AGI) in 2004: $31,239 (Individual Income Tax Returns)
Here:
$31,239
State:
$54,625
Salary/wage: $29,329 (reported on 84.1% of returns)
Here:
$29,329
State:
$46,811
(% of AGI for various income ranges: 78.0% for AGIs below $10k, 73.6% for AGIs $10k-25k, 81.3% for AGIs $25k-50k, 82.1% for AGIs $50k-75k, 86.7% for AGIs $75k-100k, 61.9% for AGIs over 100k)
Taxable interest for individuals: $1,302 (reported on 36.0% of returns)
This zip code:
$1,302
Illinois:
$2,101
(% of AGI for various income ranges: 3.5% for AGIs below $10k, 3.0% for AGIs $10k-25k, 1.6% for AGIs $25k-50k, 0.7% for AGIs $50k-75k, 0.3% for AGIs $75k-100k, 2.0% for AGIs over 100k)
Taxable dividends: $1,168 (reported on 16.1% of returns)
Here:
$1,168
State:
$4,306
(% of AGI for various income ranges: 1.4% for AGIs below $10k, 0.9% for AGIs $10k-25k, 0.5% for AGIs $25k-50k, 0.4% for AGIs $50k-75k, 1.0% for AGIs $75k-100k, 0.4% for AGIs over 100k)
Net capital gain/loss: +$1,731 (reported on 9.7% of returns)
Here:
+$1,731
State:
+$17,321
(% of AGI for various income ranges: 0.5% for AGIs below $10k, 0.2% for AGIs $10k-25k, 0.5% for AGIs $25k-50k, 1.1% for AGIs $50k-75k, -0.0% for AGIs $75k-100k, 0.6% for AGIs over 100k)
Profit/loss from business: +$5,412 (reported on 14.8% of returns)
Here:
+$5,412
State:
+$11,771
(% of AGI for various income ranges: 6.1% for AGIs below $10k, 3.6% for AGIs $10k-25k, 2.4% for AGIs $25k-50k, 1.7% for AGIs $50k-75k, 2.5% for AGIs $75k-100k, 2.7% for AGIs over 100k)
IRA payment deduction: $2,955 (reported on 1.9% of returns)
62951:
$2,955
Illinois:
$3,087
Total itemized deductions: $13,332 (24% of AGI, reported on 13.4% of returns)
Here:
$13,332
State:
$20,239
Here:
24.1% of AGI
State:
19.5% of AGI
(% of AGI for various income ranges: 3.7% for AGIs below $10k, 5.1% for AGIs $10k-25k, 5.3% for AGIs $25k-50k, 5.8% for AGIs $50k-75k, 8.7% for AGIs $75k-100k, 4.7% for AGIs over 100k)
Charity contributions deductions: $3,101 (5% of AGI, reported on 10.1% of returns)
Here:
$3,101
State:
$3,719
Here:
5.4% of AGI
State:
3.4% of AGI
(% of AGI for various income ranges: 0.9% for AGIs $10k-25k, 0.8% for AGIs $25k-50k, 1.0% for AGIs $50k-75k, 1.6% for AGIs $75k-100k, 1.4% for AGIs over 100k)
Total tax: $3,657 (reported on 70.0% of returns)
62951:
$3,657
State:
$9,882
(% of AGI for various income ranges: 2.2% for AGIs below $10k, 3.5% for AGIs $10k-25k, 6.4% for AGIs $25k-50k, 9.1% for AGIs $50k-75k, 10.9% for AGIs $75k-100k, 17.4% for AGIs over 100k)
Earned income credit: $1,668 (reported on 24.1% of returns)
Here:
$1,668
State:
$1,788
Percentage of individuals using paid preparers for their 2004 taxes: 62.5%
Here:
62%
State:
61%
(% for various income ranges: 59.4% for AGIs below $10k, 63.7% for AGIs $10k-25k, 63.4% for AGIs $25k-50k, 64.9% for AGIs $50k-75k, 53.3% for AGIs $75k-100k, 74.1% for AGIs over 100k)
Household received Food Stamps/SNAP in the past 12 months: 495 Household did not receive Food Stamps/SNAP in the past 12 months: 1,913
Women who had a birth in the past 12 months: 89 (89 now married, 0 unmarried) Women who did not have a birth in the past 12 months: 875 (476 now married, 394 unmarried)
Housing units in zip code 62951 with a mortgage: 1,070 (47 second mortgage, 10 both second mortgage and home equity loan) Median monthly owner costs for units with a mortgage: $1,054 Median monthly owner costs for units without a mortgage: $452
Residents with income below the poverty level in 2022:
This zip code:
15.3%
Whole state:
11.9%
Residents with income below 50% of the poverty level in 2022:
This zip code:
4.2%
Whole state:
5.7%
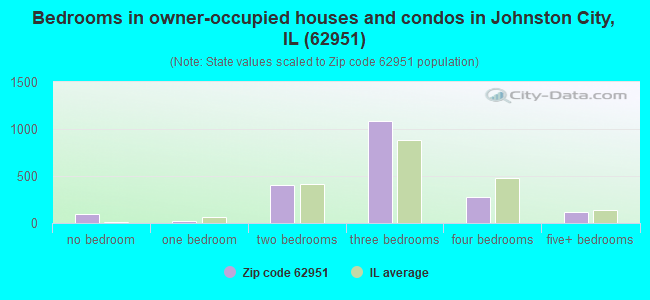
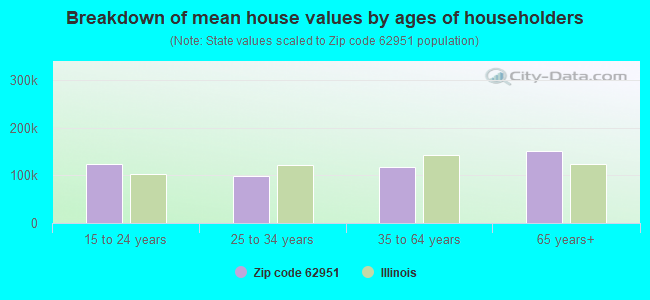
Median number of rooms in houses and condos:
Here:
6.2
State:
6.4
Median number of rooms in apartments:
Here:
4.2
State:
4.1
Notable locations in this zip code not listed on our city pages
Notable locations in zip code 62951: Johnston City Public Library (A), Williamson County Fire Protection District Station 5 (B), Johnston City Fire Department (C). Display/hide their locations on the map
Churches in zip code 62951 include: Church of God of Prophecy (A), First Baptist Church of Johnston City (B), First Christian Church (C), First United Methodist Church of Johnston City (D), Gospel Mission Church (E), Saint Pauls Catholic Church (F), Washington Avenue Baptist Church (G), Saint Pauls Church (H), Evangelical Church (I). Display/hide their locations on the map
Cemeteries: Walker Cemetery (1), Blair Cemetery (2), Becker Cemetery (3), Boyd Cemetery (4), Lakeview Cemetery (5), Hock Cemetery (6), Jacob Hunter Cemetery (7). Display/hide their locations on the map
In group quarters: 20 (-1 institutionalized population)
Size of family households: 981 2-persons, 178 3-persons, 368 4-persons, 70 5-persons, 55 6-persons, 16 7-or-more-persons
Size of nonfamily households: 654 1-person, 17 2-persons, 48 4-persons
545 married couples with children.
91 single-parent households (34 men, 57 women).
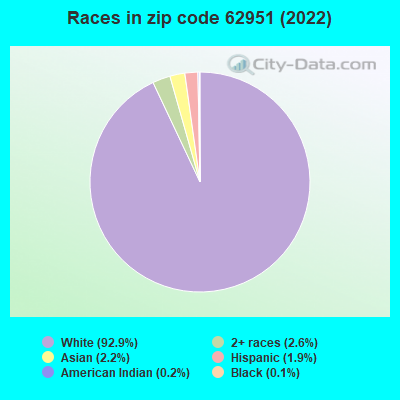
97.2% of residents of 62951 zip code speak English at home.
0.4% of residents speak other Indo-European language at home (100% very well).
1.7% of residents speak Asian or Pacific Island language at home (62% very well, 38% not well).
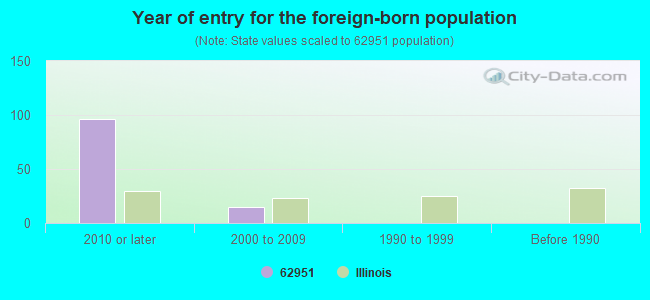
Foreign born population: 96 (1.8%) (0.0% of them are naturalized citizens)
:
1.8%
Whole state:
14.4%
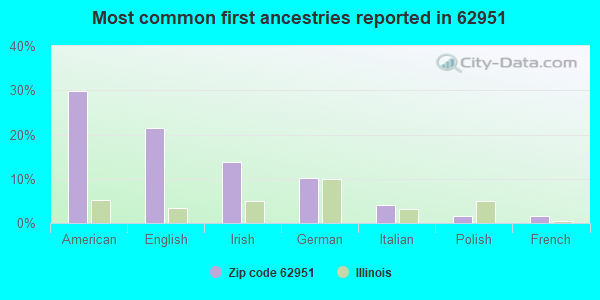
30%American
21%English
14%Irish
10%German
4%Italian
2%Polish
2%French
Year of entry for the foreign-born population
962010 or later
152000 to 2009
01990 to 1999
0Before 1990
Major facilities with environmental interests located in this zip code:
JOHNSTON CITY WWTP (SOUTH WATER STREET in JOHNSTON CITY, IL)
STATE MASTER (Illinois EPA Project) - National Pollutant Discharge Elimination System Permit National Pollutant Discharge Elimination System NON-MAJOR (Tracking pollutant discharge elimination systems) - permit National Pollutant Discharge Elimination System NON-MAJOR (Tracking pollutant discharge elimination systems) - permit Business SIC classification: SEWERAGE SYSTEMS Alternative names: JOHNSTON CITY STP
LINCOLN GRADE SCHOOL (RURAL ROUTE #1 in JOHNSTON CITY, IL)
STATE MASTER (Illinois EPA Project) - National Pollutant Discharge Elimination System Permit National Pollutant Discharge Elimination System NON-MAJOR (Tracking pollutant discharge elimination systems) - permit National Pollutant Discharge Elimination System NON-MAJOR (Tracking pollutant discharge elimination systems) - permit Business SIC classification: ELEMENTARY AND SECONDARY SCHOOLS Alternative names: LINCOLN GRADE SCHOOL-DIST 1, LINCOLN GRADE SCHOOL STP
GRANDPA S GENERAL & DISCOUNT STORE (ROUTE 37 in JOHNSTON CITY, IL)
STATE MASTER (Illinois EPA Project) - AIR PROGRAM AIR MINOR (AIRS/AFS) CRITERIA AND HAZARDOUS AIR POLLUTANT INVENTORY (Inventory of air pollution sources) Business SIC classification: DRUG STORES AND PROPRIETARY STORES Business NAICS classification: PHARMACIES AND DRUG STORES. Alternative names: FREDERICK BORGSMILLER, GRANDPAS GENERAL & DISCOUNT STORE
ALIQUOT LTD (RR #2 in JOHNSTON CITY, IL)
STATE MASTER (Illinois EPA Project) - AIR PROGRAM AIR MINOR (AIRS/AFS) Business SIC classification: NONCLASSIFIABLE ESTABLISHMENTS
REACO BATTERY SERVICE CORP (HIGHWAY 37 SOUTH in JOHNSTON CITY, IL)
AIR MINOR (AIRS/AFS) CRITERIA AND HAZARDOUS AIR POLLUTANT INVENTORY (Inventory of air pollution sources) HAZARDOUS WASTE BIENNIAL REPORTER (Resource Conservation and Recovery Act (tracking hazardous waste)) Large Quantity Generators, more that 1000 kg of hazardous waste/month (Resource Conservation and Recovery Act (tracking hazardous waste)) - notification Business SIC classification: STORAGE BATTERIES Business NAICS classification: STORAGE BATTERY MANUFACTURING.; STORAGE BATTERY MANUFACTURING.
JOHNSTON CITY HIGH SCHOOL (1500 JEFFERSON AVE in JOHNSTON CITY, IL)
(Geographic Names Information System) (National Center for Education Statistics) - STATE ID-2110000100001 Organizations: JOHNSTON CITY C U SCH DIST 1 (SCHOOL DISTRICT)
JEFFERSON ELEM SCHOOL (1108 GRAND AVE in JOHNSTON CITY, IL)
(National Center for Education Statistics) - STATE ID-2110000102003 Organizations: JOHNSTON CITY C U SCH DIST 1 (SCHOOL DISTRICT)
PROJECT ECHO (900 WASHINGTON in JOHNSTON CITY, IL)
(National Center for Education Statistics) - STATE ID-2100000009201 Organizations: FRANKLIN/WILLIAMSON ROE (SCHOOL DISTRICT)
REACO BATTERY SERVICE CORP (17217 RTE 37 in JOHNSTON CITY, IL)
National Pollutant Discharge Elimination System NON-MAJOR (Tracking pollutant discharge elimination systems) - permit Small Quantity Generators, between 100 kg and 1000 kg of hazardous waste/month (Resource Conservation and Recovery Act (tracking hazardous waste)) Business SIC classification: STORAGE BATTERIES Organizations: SCOTT K GAMSTER (CONTACT/OPERATOR)
MAYFLOWER CONTRACT SERVICES (150 JEFFERSON ST. in JOHNSTON CITY, IL)
National Pollutant Discharge Elimination System NON-MAJOR (Tracking pollutant discharge elimination systems) - permit
ILL DEPT OF TRANSPORTATION (BRIDGE#100-0053 in JOHNSTON CITY, IL)
(Resource Conservation and Recovery Act (tracking hazardous waste))
JOHNSTON CITY CUSD 1 (1103 MONROE AVE in JOHNSTON CITY, IL)
COMPLIANCE ACTIVITY (Tracking inspections of insecticide, fungicide, and rodenticide, and toxic substances)
LAIDLAW MAYFLOWER (1500 JEFFERSON AVE in JOHNSTON CITY, IL)
Conditionally Exempt Small Quantity Generators, less than 100 kg/month of hazardous waste (Resource Conservation and Recovery Act (tracking hazardous waste)) - notification Organizations: JOHNSTIN CITY DIST UNIT 11 (CONTACT/OWNER)
Housing units lacking complete plumbing facilities: 4.3% Housing units lacking complete kitchen facilities: 1.0%
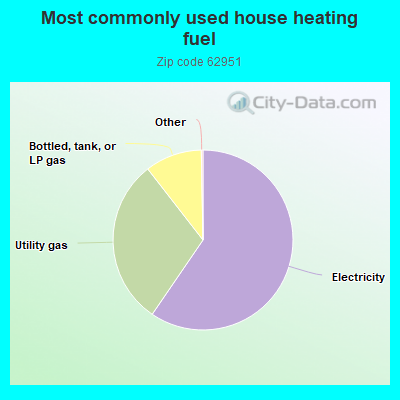
59.5%Electricity
29.9%Utility gas
10.2%Bottled, tank, or LP gas
Population in 1990: 5,424.
Place of birth for U.S.-born residents:
This state: 3,915
Northeast: 10
Midwest: 567
South: 483
West: 407
69% of the 62951 zip code residents lived in the same house 5 years ago. Out of people who lived in different houses, 67% lived in this county. Out of people who lived in different counties, 50% lived in Illinois.
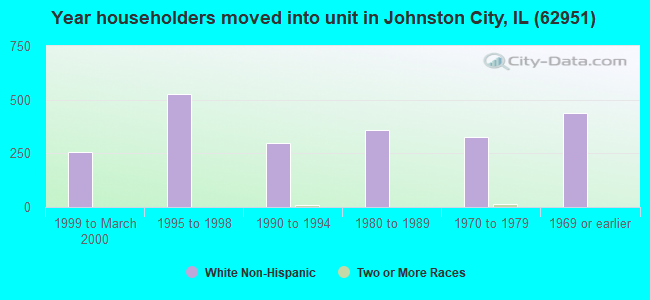
94% of the 62951 zip code residents lived in the same house 1 year ago. Out of people who lived in different houses, 33% moved from this county. Out of people who lived in different houses, 53% moved from different county within same state. Out of people who lived in different houses, 18% moved from different state.
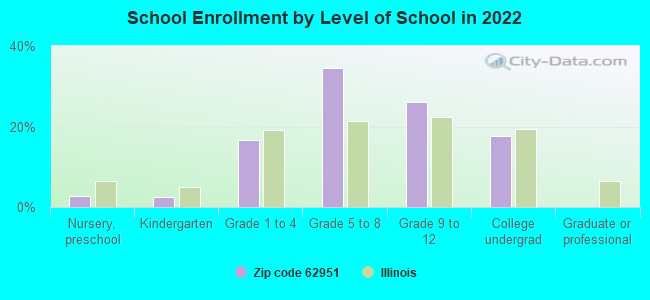
Private vs. public school enrollment:
Students in private schools in grades 1 to 8 (elementary and middle school): 46
Here:
9.1%
Illinois:
13.3%
Students in private schools in grades 9 to 12 (high school):
Here:
0.0%
Illinois:
9.9%
Students in private undergraduate colleges: 13
Here:
7.4%
Illinois:
27.4%
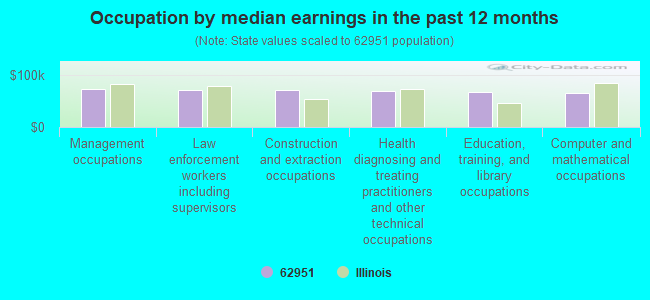
Occupation by median earnings in the past 12 months ($)
72,638Management occupations
70,507Law enforcement workers including supervisors
70,073Construction and extraction occupations
68,603Health diagnosing and treating practitioners and other technical occupations
67,376Education, training, and library occupations
65,808Computer and mathematical occupations
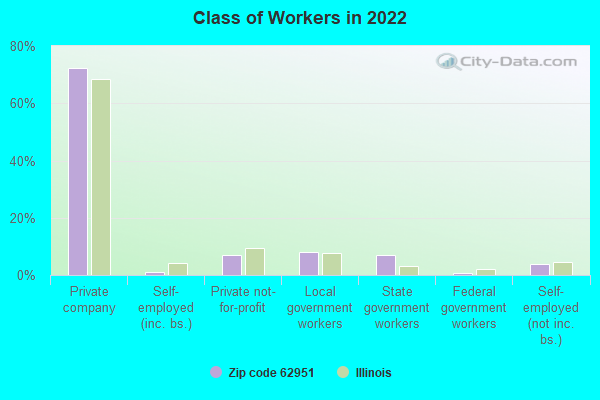
Companies with federal contracts located in this zip code:
SICISM (POB 225 in JOHNSTON CITY, IL; small business)
$450 with Bureau of Prisoners/Federal Prison System for Other Education and Training Services. Signed on 2005-05-10. Effective on 2005-03-19. Completion date: 2005-03-19.
Top industries in this zip code by the number of employees in 2005:
Health Care and Social Assistance: Homes for the Elderly (10-19: 1)
People in group quarters in 2010:
12 people in group homes intended for adults
Fatal accident statistics in 2013:
Fatal accident count: 1
Vehicles involved in fatal accidents: 1
Fatal accidents caused by drunken drivers: 1
Fatalities: 1
Persons involved in fatal accidents: 1
Pedestrians involved in fatal accidents: 0
Fatal accident statistics in 2011:
Fatal accident count: 1
Vehicles involved in fatal accidents: 2
Fatal accidents caused by drunken drivers: 0
Fatalities: 1
Persons involved in fatal accidents: 2
Pedestrians involved in fatal accidents: 0
2002 - 2018 National Fire Incident Reporting System (NFIRS) incidents
Based on the data from the years 2002 - 2018 the average number of fires per year is 49. The highest number of reported fires - 75 took place in 2011, and the least - 20 in 2004. The data has an increasing trend.
When looking into fire subcategories, the most incidents belonged to: Outside Fires (47.0%), and Structure Fires (35.1%).
Fire incident types reported to NFIRS in Zip Code 62951

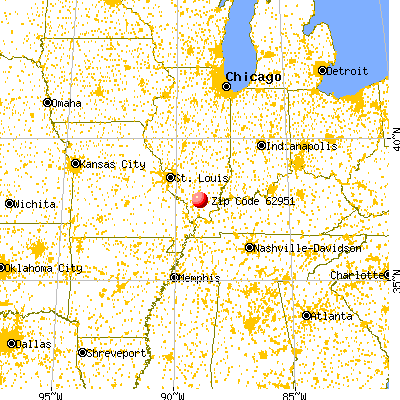


 Nearest zip codes: 62896, 62841, 62948, 62874, 62959, 62933.


 Based on the data from the years 2002 - 2018 the average number of fires per year is 49. The highest number of reported fires - 75 took place in 2011, and the least - 20 in 2004. The data has an increasing trend.
 When looking into fire subcategories, the most incidents belonged to: Outside Fires (47.0%), and Structure Fires (35.1%).