Estimated zip code population in 2022: 1,875 Zip code population in 2010: 1,457 Zip code population in 2000: 1,496
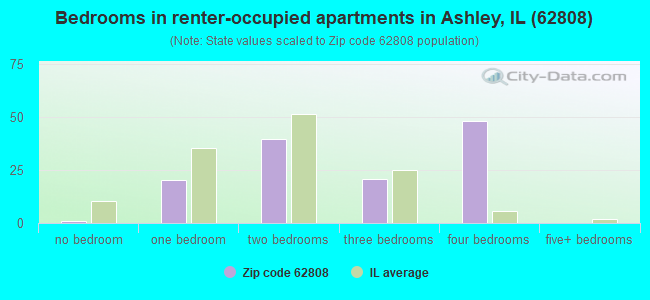
Houses and condos: 813 Renter-occupied apartments: 134
% of renters here:
19%
State:
33%
March 2022 cost of living index in zip code 62808: 84.0 (less than average, U.S. average is 100)
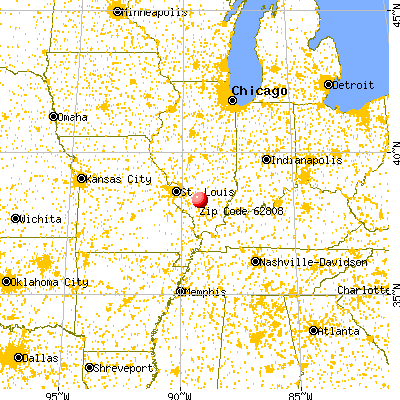
Land area: 76.2 sq. mi. Water area: 0.0 sq. mi.
Population density: 25 people per square mile
(very low).
OSM Map
General Map
Google Map
MSN Map
OSM Map
General Map
Google Map
MSN Map
OSM Map
General Map
Google Map
MSN Map
OSM Map
General Map
Google Map
MSN Map
Please wait while loading the map...
Real estate property taxes paid for housing units in 2022:
This zip code:
1.6% ($2,341)
Illinois:
2.0% ($4,912)
Median real estate property taxes paid for housing units with mortgages in 2022: $2,581 (1.7%) Median real estate property taxes paid for housing units with no mortgage in 2022: $1,957 (1.4%)
Business Search- 14 Million verified businesses
Males: 1,081
(57.6%)
Females: 794
(42.4%)
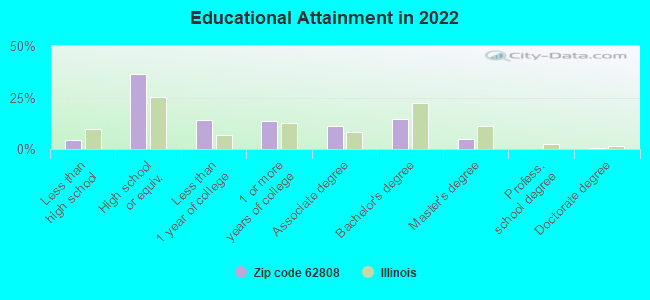
For population 25 years and over in 62808:
High school or higher: 94.6%
Bachelor's degree or higher: 19.8%
Graduate or professional degree: 5.4%
Unemployed: 0.7%
Mean travel time to work (commute): 28.0 minutes
For population 15 years and over in 62808:
Never married: 29.0%
Now married: 49.0%
Separated: 1.3%
Widowed: 6.3%
Divorced: 14.5%
Zip code 62808 compared to state average:
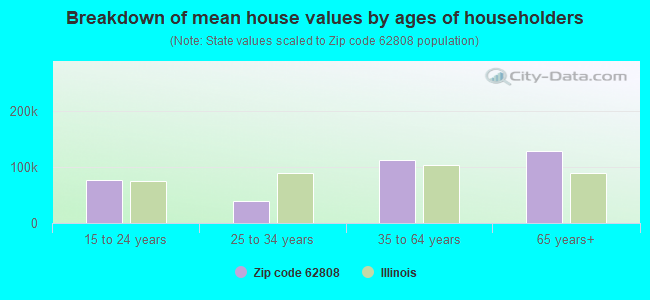
Median house value below state average.
Unemployed percentage significantly below state average.
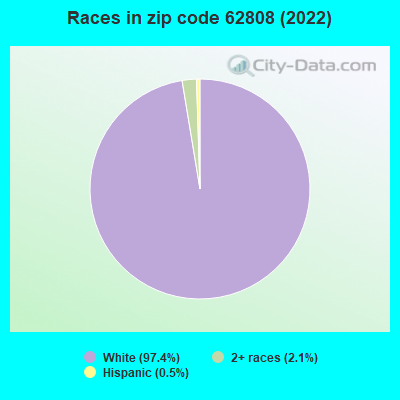
Black race population percentage significantly below state average.
Hispanic race population percentage significantly below state average.
Foreign-born population percentage significantly below state average.
Renting percentage below state average.
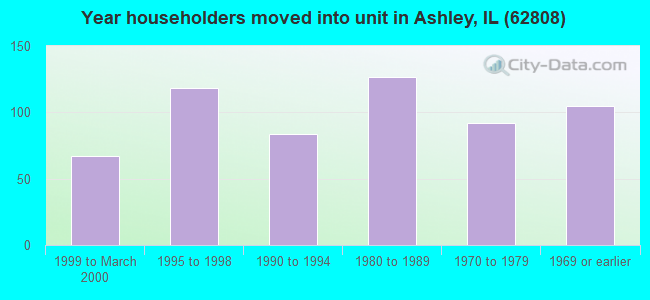
Length of stay since moving in significantly above state average.
Number of college students below state average.
Percentage of population with a bachelor's degree or higher below state average.
Estimated median house/condo value in 2022: $147,214
62808:
$147,214
Illinois:
$251,600
According to our research of Illinois and other state lists, there were 2 registered sex offenders living in 62808 zip code as of July 04, 2024. The ratio of all residents to sex offenders in zip code 62808 is 709 to 1. The ratio of registered sex offenders to all residents in this zip code is near the state average.
Median resident age:
This zip code:
39.9 years
Illinois median age:
39.1 years
Average household size:
This zip code:
2.6 people
Illinois:
2.4 people
Averages for the 2020 tax year for zip code 62808, filed in 2021:
Average Adjusted Gross Income (AGI) in 2020: $52,315 (Individual Income Tax Returns)
Here:
$52,315
State:
$82,626
Salary/wage: $47,937 (reported on 78.8% of returns)
Here:
$47,937
State:
$66,640
(% of AGI for various income ranges: 1206.4% for AGIs below $25k, 3939.2% for AGIs $25k-50k, 6950.0% for AGIs $50k-75k, 9060.0% for AGIs $75k-100k, 19622.0% for AGIs $100k-200k)
Taxable interest for individuals: $488 (reported on 39.4% of returns)
This zip code:
$488
Illinois:
$2,376
(% of AGI for various income ranges: 20.0% for AGIs below $25k, 19.2% for AGIs $25k-50k, 66.7% for AGIs $50k-75k, 32.0% for AGIs $75k-100k, 40.0% for AGIs $100k-200k)
Ordinary dividends: $1,573 (reported on 22.7% of returns)
Here:
$1,573
State:
$9,061
(% of AGI for various income ranges: 33.6% for AGIs below $25k, 16.7% for AGIs $25k-50k, 95.0% for AGIs $50k-75k, 52.0% for AGIs $75k-100k, 172.0% for AGIs $100k-200k)
Net capital gain/loss in AGI: +$2,500 (reported on 16.7% of returns)
Here:
+$2,500
State:
+$31,684
(% of AGI for various income ranges: 50.0% for AGIs below $25k, 211.7% for AGIs $50k-75k, 156.0% for AGIs $100k-200k)
Profit/loss from business: +$3,600 (reported on 12.1% of returns)
Here:
+$3,600
State:
+$12,175
(% of AGI for various income ranges: 145.0% for AGIs below $25k, 28.3% for AGIs $50k-75k, 136.0% for AGIs $100k-200k)
Taxable individual retirement arrangement distribution: $10,333 (reported on 9.1% of returns)
62808:
$10,333
Illinois:
$21,613
(% of AGI for various income ranges: 181.4% for AGIs below $25k, 610.0% for AGIs $50k-75k)
Earned income credit: $1,967 (reported on 13.6% of returns)
Here:
$1,967
State:
$2,311
(% of AGI for various income ranges: 72.9% for AGIs below $25k, 62.5% for AGIs $25k-50k)
Percentage of individuals using paid preparers for their 2020 taxes: 98.5%
Here:
98%
State:
93%
(% for various income ranges: 95.7% for AGIs below $25k, 100.0% for AGIs $25k-50k, 100.0% for AGIs $50k-75k, 100.0% for AGIs $75k-100k, 100.0% for AGIs $100k-200k)
Averages for the 2012 tax year for zip code 62808, filed in 2013:
Average Adjusted Gross Income (AGI) in 2012: $40,908 (Individual Income Tax Returns)
Here:
$40,908
State:
$68,058
Salary/wage: $36,167 (reported on 85.9% of returns)
Here:
$36,167
State:
$55,396
(% of AGI for various income ranges: 71.7% for AGIs below $25k, 80.3% for AGIs $25k-50k, 75.5% for AGIs $50k-75k, 75.0% for AGIs $75k-100k, 75.0% for AGIs $100k-200k)
Taxable interest for individuals: $786 (reported on 40.8% of returns)
This zip code:
$786
Illinois:
$1,969
(% of AGI for various income ranges: 1.9% for AGIs below $25k, 0.7% for AGIs $25k-50k, 0.3% for AGIs $50k-75k, 0.6% for AGIs $75k-100k, 0.9% for AGIs $100k-200k)
Ordinary dividends: $873 (reported on 21.1% of returns)
Here:
$873
State:
$7,786
(% of AGI for various income ranges: 0.3% for AGIs below $25k, 0.2% for AGIs $25k-50k, 0.9% for AGIs $50k-75k, 0.6% for AGIs $100k-200k)
Net capital gain/loss in AGI: +$2,008 (reported on 16.9% of returns)
Here:
+$2,008
State:
+$22,183
(% of AGI for various income ranges: 1.1% for AGIs below $25k, 2.6% for AGIs $50k-75k, 0.2% for AGIs $100k-200k)
Profit/loss from business: +$6,767 (reported on 12.7% of returns)
Here:
+$6,767
State:
+$12,903
(% of AGI for various income ranges: 4.3% for AGIs below $25k, 4.5% for AGIs $25k-50k, 3.7% for AGIs $75k-100k)
Taxable individual retirement arrangement distribution: $8,800 (reported on 8.5% of returns)
62808:
$8,800
Illinois:
$17,929
Total itemized deductions: $17,145 (22% of AGI, reported on 15.5% of returns)
Here:
$17,145
State:
$26,433
Here:
22.4% of AGI
State:
19.2% of AGI
(% of AGI for various income ranges: 8.5% for AGIs $25k-50k, 10.1% for AGIs $50k-75k, 8.0% for AGIs $100k-200k)
Charity contributions: $2,200 (reported on 9.9% of returns)
Here:
$2,200
State:
$4,525
Taxes paid: $7,018 (reported on 15.5% of returns)
62808:
$7,018
State:
$11,968
(% of AGI for various income ranges: 2.2% for AGIs $25k-50k, 4.2% for AGIs $50k-75k, 4.3% for AGIs $100k-200k)
Earned income credit: $1,850 (reported on 16.9% of returns)
Here:
$1,850
State:
$2,349
(% of AGI for various income ranges: 5.1% for AGIs below $25k, 0.6% for AGIs $25k-50k)
Percentage of individuals using paid preparers for their 2012 taxes: 74.6%
Here:
75%
State:
57%
(% for various income ranges: 70.0% for AGIs below $25k, 72.2% for AGIs $25k-50k, 83.3% for AGIs $50k-75k, 80.0% for AGIs $75k-100k, 83.3% for AGIs $100k-200k)
Averages for the 2004 tax year for zip code 62808, filed in 2005:
Average Adjusted Gross Income (AGI) in 2004: $33,107 (Individual Income Tax Returns)
Here:
$33,107
State:
$54,625
Salary/wage: $31,710 (reported on 83.9% of returns)
Here:
$31,710
State:
$46,811
(% of AGI for various income ranges: 115.6% for AGIs below $10k, 76.1% for AGIs $10k-25k, 84.2% for AGIs $25k-50k, 86.2% for AGIs $50k-75k, 84.3% for AGIs $75k-100k, 49.2% for AGIs over 100k)
Taxable interest for individuals: $988 (reported on 47.7% of returns)
This zip code:
$988
Illinois:
$2,101
(% of AGI for various income ranges: 9.1% for AGIs below $10k, 2.7% for AGIs $10k-25k, 1.6% for AGIs $25k-50k, 0.6% for AGIs $50k-75k, 0.7% for AGIs $75k-100k, 0.5% for AGIs over 100k)
Taxable dividends: $451 (reported on 22.9% of returns)
Here:
$451
State:
$4,306
(% of AGI for various income ranges: 1.3% for AGIs below $10k, 0.2% for AGIs $10k-25k, 0.3% for AGIs $25k-50k, 0.1% for AGIs $50k-75k, 0.5% for AGIs $75k-100k, 0.3% for AGIs over 100k)
Net capital gain/loss: +$721 (reported on 15.7% of returns)
Here:
+$721
State:
+$17,321
(% of AGI for various income ranges: 0.2% for AGIs below $10k, 0.4% for AGIs $10k-25k, 0.3% for AGIs $25k-50k, -0.0% for AGIs $50k-75k, 1.2% for AGIs $75k-100k)
Profit/loss from business: +$2,896 (reported on 13.6% of returns)
Here:
+$2,896
State:
+$11,771
(% of AGI for various income ranges: 6.0% for AGIs below $10k, 1.2% for AGIs $10k-25k, 2.6% for AGIs $25k-50k, -0.2% for AGIs $50k-75k, 0.5% for AGIs $75k-100k)
IRA payment deduction: $2,643 (reported on 2.0% of returns)
62808:
$2,643
Illinois:
$3,087
Total itemized deductions: $13,162 (22% of AGI, reported on 16.5% of returns)
Here:
$13,162
State:
$20,239
Here:
21.8% of AGI
State:
19.5% of AGI
(% of AGI for various income ranges: 8.9% for AGIs $10k-25k, 6.2% for AGIs $25k-50k, 5.9% for AGIs $50k-75k, 5.7% for AGIs $75k-100k, 8.8% for AGIs over 100k)
Charity contributions deductions: $1,962 (3% of AGI, reported on 11.2% of returns)
Here:
$1,962
State:
$3,719
Here:
3.0% of AGI
State:
3.4% of AGI
(% of AGI for various income ranges: 0.8% for AGIs below $10k, 0.6% for AGIs $25k-50k, 0.7% for AGIs $50k-75k, 1.8% for AGIs $75k-100k)
Total tax: $4,106 (reported on 73.4% of returns)
62808:
$4,106
State:
$9,882
(% of AGI for various income ranges: 3.8% for AGIs below $10k, 4.7% for AGIs $10k-25k, 7.2% for AGIs $25k-50k, 8.5% for AGIs $50k-75k, 10.6% for AGIs $75k-100k, 19.8% for AGIs over 100k)
Earned income credit: $1,500 (reported on 14.1% of returns)
Here:
$1,500
State:
$1,788
Percentage of individuals using paid preparers for their 2004 taxes: 75.6%
Here:
76%
State:
61%
(% for various income ranges: 68.9% for AGIs below $10k, 77.2% for AGIs $10k-25k, 76.2% for AGIs $25k-50k, 83.3% for AGIs $50k-75k, 72.1% for AGIs $75k-100k, 81.2% for AGIs over 100k)
Household received Food Stamps/SNAP in the past 12 months: 123 Household did not receive Food Stamps/SNAP in the past 12 months: 593
Women who had a birth in the past 12 months: 8 (7 now married, 0 unmarried) Women who did not have a birth in the past 12 months: 409 (194 now married, 213 unmarried)
Housing units in zip code 62808 with a mortgage: 266 (31 second mortgage, 23 both second mortgage and home equity loan) Houses without a mortgage: 16
Median monthly owner costs for units with a mortgage: $1,331 Median monthly owner costs for units without a mortgage: $539
Residents with income below the poverty level in 2022:
This zip code:
16.5%
Whole state:
11.9%
Residents with income below 50% of the poverty level in 2022:
This zip code:
6.1%
Whole state:
5.7%
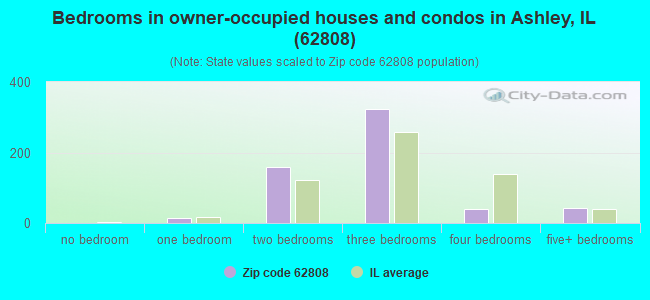
Median number of rooms in houses and condos:
Here:
6.0
State:
6.4
Median number of rooms in apartments:
Here:
5.0
State:
4.1
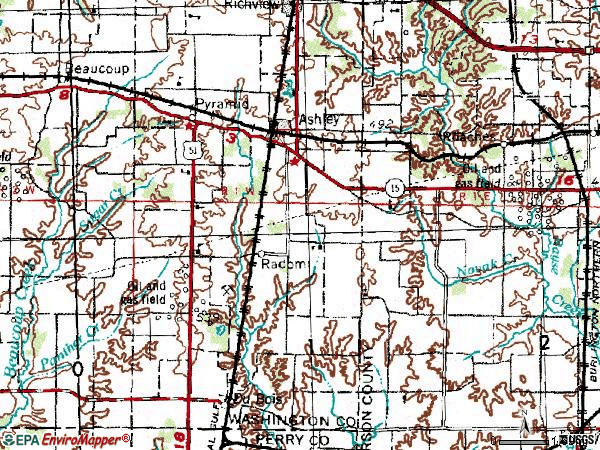
Notable locations in this zip code not listed on our city pages
Cemeteries: Mount Zion Cemetery (1), Beaucoup Cemetery (2), Brick Cemetery (3), Liberty Cemetery (4), Logan Cemetery (5), Minson Cemetery (6), Quinn Cemetery (7). Display/hide their locations on the map
Size of family households: 207 2-persons, 69 3-persons, 112 4-persons, 73 5-persons, 10 6-persons, 20 7-or-more-persons
Size of nonfamily households: 161 1-person, 54 2-persons, 2 3-persons
157 married couples with children.
186 single-parent households (28 men, 158 women).
98.5% of residents of 62808 zip code speak English at home.
0.5% of residents speak other Indo-European language at home (100% very well).
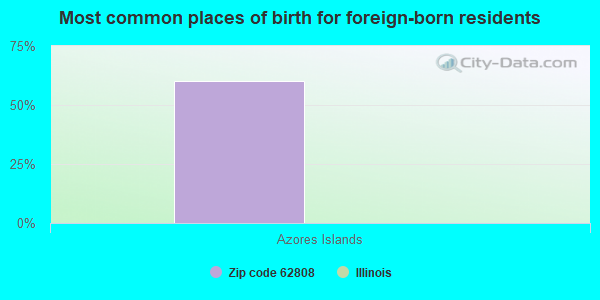
Foreign born population: 14 (0.8%) (0.0% of them are naturalized citizens)
:
0.8%
Whole state:
14.4%
60%Azores Islands
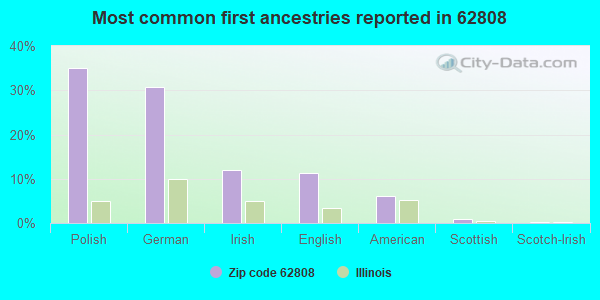
35%Polish
31%German
12%Irish
11%English
6%American
1%Scottish
0%Scotch-Irish
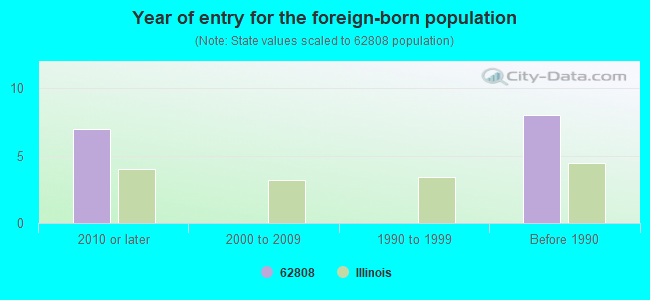
Year of entry for the foreign-born population
72010 or later
02000 to 2009
01990 to 1999
8Before 1990
Facilities with environmental interests located in this zip code:
ASHLEY ELEVATOR (134 E MAIN in ASHLEY, IL)
STATE MASTER (Illinois EPA Project) - AIR PROGRAM AIR MINOR (AIRS/AFS) CRITERIA AND HAZARDOUS AIR POLLUTANT INVENTORY (Inventory of air pollution sources) Business SIC classification: GRAIN AND FIELD BEANS
ASHLEY STP (EAST MAIN & CITY PARK DRIVE in ASHLEY, IL)
STATE MASTER (Illinois EPA Project) - National Pollutant Discharge Elimination System Permit National Pollutant Discharge Elimination System NON-MAJOR (Tracking pollutant discharge elimination systems) - permit Business SIC classification: SEWERAGE SYSTEMS Alternative names: ASHLEY STP, CITY OF
MEP INVESTMENTS LLC (OKLAHOMA RD & TOWN HALL RD in BOLO, IL)
STATE MASTER (Illinois EPA Project) - AIR PROGRAM AIR MINOR (AIRS/AFS) Business SIC classification: NONCLASSIFIABLE ESTABLISHMENTS
RYAN ENERGY (5TH & MADISON in ASHLEY, IL)
STATE MASTER (Illinois EPA Project) - AIR PROGRAM AIR MINOR (AIRS/AFS) Business SIC classification: PETROLEUM BULK STATIONS AND TERMINALS
ASHLEY COM CONSOLIDATED SCHOOL (PO BOX 315 in ASHLEY, IL)
(National Center for Education Statistics) - STATE ID-1309501502001 Organizations: ASHLEY C C SCH DISTRICT 15 (SCHOOL DISTRICT)
ASHLEY ELEVATOR (CENTER OF ASHLEY ON HWY. 15 in ASHLEY, IL)
National Pollutant Discharge Elimination System NON-MAJOR (Tracking pollutant discharge elimination systems) - permit
ASHLEY SANITARY DISTRICT (CITY PARK DRIVE in ASHLEY, IL)
National Pollutant Discharge Elimination System NON-MAJOR (Tracking pollutant discharge elimination systems) - permit Business SIC classification: SEWERAGE SYSTEMS Alternative names: ASHLEY, CITY OF
AT AND T (1MI E OF ASHLEY RT 51 in ASHLEY, IL)
Conditionally Exempt Small Quantity Generators, less than 100 kg/month of hazardous waste (Resource Conservation and Recovery Act (tracking hazardous waste)) - notification Organizations: AT & T (CONTACT/OWNER)
Housing units lacking complete plumbing facilities: 4.5% Housing units lacking complete kitchen facilities: 2.4%
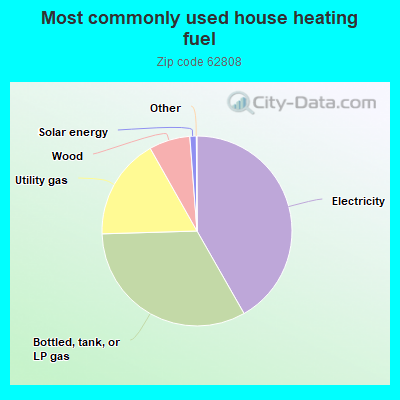
41.8%Electricity
32.8%Bottled, tank, or LP gas
17.3%Utility gas
7.0%Wood
1.1%Solar energy
Population in 1990: 1,260. Population change in the 1990s: +236 (+18.7%).
Place of birth for U.S.-born residents:
This state: 1,639
Midwest: 155
South: 43
West: 12
72% of the 62808 zip code residents lived in the same house 5 years ago. Out of people who lived in different houses, 49% lived in this county. Out of people who lived in different counties, 50% lived in Illinois.
96% of the 62808 zip code residents lived in the same house 1 year ago. Out of people who lived in different houses, 35% moved from this county. Out of people who lived in different houses, 69% moved from different county within same state.
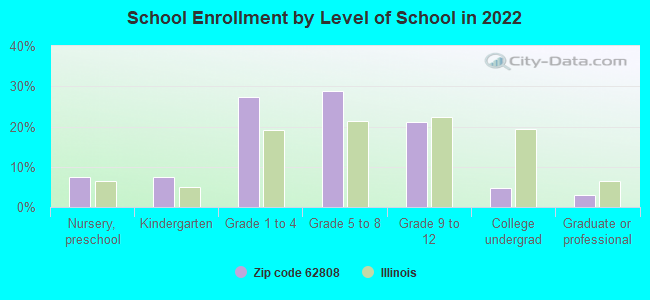
Private vs. public school enrollment:
Students in private schools in grades 1 to 8 (elementary and middle school): 52
Here:
22.1%
Illinois:
13.3%
Students in private schools in grades 9 to 12 (high school):
Here:
0.0%
Illinois:
9.9%
Students in private undergraduate colleges: 4
Here:
23.1%
Illinois:
27.4%
Occupation by median earnings in the past 12 months ($)
89,253Health diagnosing and treating practitioners and other technical occupations
78,509Installation, maintenance, and repair occupations
69,811Architecture and engineering occupations
63,942Transportation occupations
56,247Management occupations
51,682Material moving occupations
Top industries in this zip code by the number of employees in 2005:
Arts, Entertainment, and Recreation: All Other Amusement and Recreation Industries (10-19 employees: 1 establishment)
Construction: Highway, Street, and Bridge Construction (10-19: 1)
Accommodation and Food Services: Limited-Service Restaurants (5-9: 1)
Accommodation and Food Services: Drinking Places (Alcoholic Beverages) (5-9: 1)
Construction: Residential Remodelers (1-4: 2)
Finance and Insurance: Commercial Banking (1-4: 1)
Health Care and Social Assistance: Offices of Physicians (except Mental Health Specialists) (1-4: 1)
Fatal accident statistics in 2014:
Fatal accident count: 1
Vehicles involved in fatal accidents: 2
Fatal accidents caused by drunken drivers: 0
Fatalities: 1
Persons involved in fatal accidents: 3
Pedestrians involved in fatal accidents: 0
Fatal accident statistics in 2013:
Fatal accident count: 1
Vehicles involved in fatal accidents: 1
Fatal accidents caused by drunken drivers: 1
Fatalities: 1
Persons involved in fatal accidents: 2
Pedestrians involved in fatal accidents: 0
2002 - 2018 National Fire Incident Reporting System (NFIRS) incidents
According to the data from the years 2002 - 2018 the average number of fires per year is 13. The highest number of reported fires - 22 took place in 2007, and the least - 4 in 2005. The data has a declining trend.
When looking into fire subcategories, the most reports belonged to: Structure Fires (47.5%), and Outside Fires (36.2%).
Fire incident types reported to NFIRS in Zip Code 62808


 Nearest zip codes: 62876, 62831, 62877, 62848, 62898, 62883.


 According to the data from the years 2002 - 2018 the average number of fires per year is 13. The highest number of reported fires - 22 took place in 2007, and the least - 4 in 2005. The data has a declining trend.
 When looking into fire subcategories, the most reports belonged to: Structure Fires (47.5%), and Outside Fires (36.2%).