Estimated zip code population in 2022: 594 Zip code population in 2010: 647 Zip code population in 2000: 722
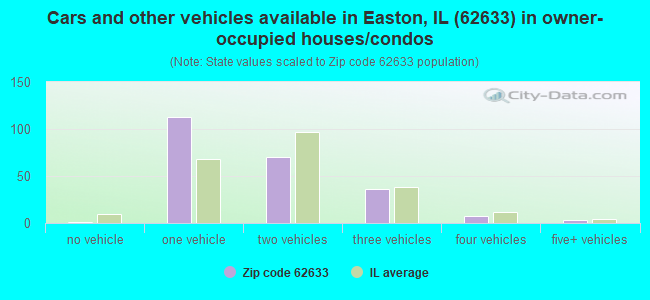
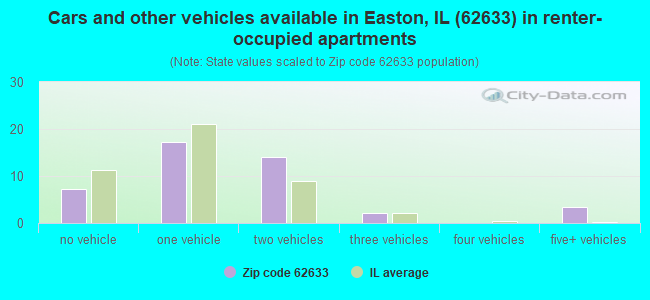
Houses and condos: 297 Renter-occupied apartments: 45
% of renters here:
17%
State:
33%
March 2022 cost of living index in zip code 62633: 84.1 (less than average, U.S. average is 100)
Land area: 68.9 sq. mi. Water area: 0.1 sq. mi.
Population density: 9 people per square mile
(very low).
OSM Map
General Map
Google Map
MSN Map
OSM Map
General Map
Google Map
MSN Map
OSM Map
General Map
Google Map
MSN Map
OSM Map
General Map
Google Map
MSN Map
Please wait while loading the map...
Real estate property taxes paid for housing units in 2022:
This zip code:
2.1% ($1,751)
Illinois:
2.0% ($4,912)
Median real estate property taxes paid for housing units with mortgages in 2022: $1,734 (2.5%) Median real estate property taxes paid for housing units with no mortgage in 2022: $1,740 (1.5%)
Business Search- 14 Million verified businesses
Males: 251
(42.3%)
Females: 343
(57.7%)
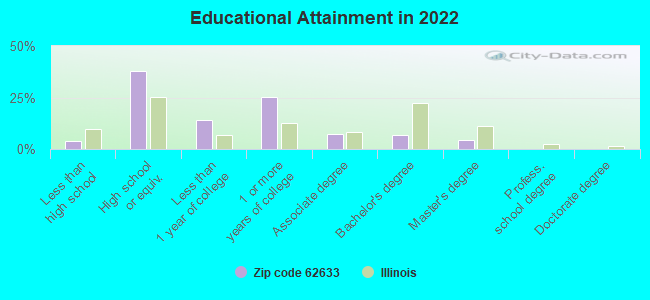
For population 25 years and over in 62633:
High school or higher: 93.8%
Bachelor's degree or higher: 11.4%
Graduate or professional degree: 4.7%
Unemployed: 12.5%
Mean travel time to work (commute): 32.5 minutes
For population 15 years and over in 62633:
Never married: 32.5%
Now married: 41.6%
Separated: 0.0%
Widowed: 9.4%
Divorced: 16.5%
Zip code 62633 compared to state average:
Median household income below state average.
Median house value significantly below state average.
Unemployed percentage above state average.
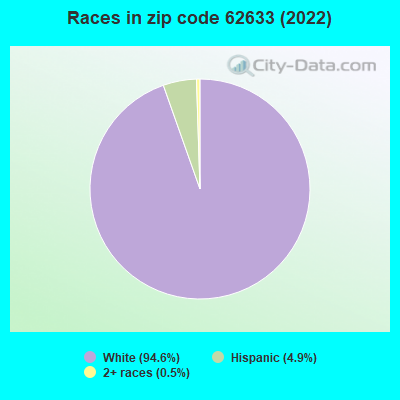
Black race population percentage significantly below state average.
Hispanic race population percentage significantly below state average.
Median age significantly above state average.
Foreign-born population percentage significantly below state average.
Renting percentage below state average.
Length of stay since moving in significantly above state average.
Number of rooms per house above state average.
House age above state average.
Percentage of population with a bachelor's degree or higher significantly below state average.
Estimated median house/condo value in 2022: $84,814
62633:
$84,814
Illinois:
$251,600
According to our research of Illinois and other state lists, there was 1 registered sex offender living in 62633 zip code as of July 04, 2024. The ratio of all residents to sex offenders in zip code 62633 is 694 to 1. The ratio of registered sex offenders to all residents in this zip code is near the state average.
Median resident age:
This zip code:
48.2 years
Illinois median age:
39.1 years
Average household size:
This zip code:
2.2 people
Illinois:
2.4 people
Averages for the 2020 tax year for zip code 62633, filed in 2021:
Average Adjusted Gross Income (AGI) in 2020: $64,403 (Individual Income Tax Returns)
Here:
$64,403
State:
$82,626
Salary/wage: $43,935 (reported on 83.9% of returns)
Here:
$43,935
State:
$66,640
(% of AGI for various income ranges: 1190.0% for AGIs below $25k, 3288.0% for AGIs $25k-50k, 5730.0% for AGIs $50k-75k, 8725.0% for AGIs $75k-100k, 12272.5% for AGIs $100k-200k)
Taxable interest for individuals: $667 (reported on 48.4% of returns)
This zip code:
$667
Illinois:
$2,376
(% of AGI for various income ranges: 14.3% for AGIs below $25k, 48.0% for AGIs $25k-50k, 32.5% for AGIs $50k-75k, 132.5% for AGIs $100k-200k)
Ordinary dividends: $2,383 (reported on 19.4% of returns)
Here:
$2,383
State:
$9,061
(% of AGI for various income ranges: 42.9% for AGIs below $25k, 282.5% for AGIs $100k-200k)
Net capital gain/loss in AGI: +$5,325 (reported on 12.9% of returns)
Here:
+$5,325
State:
+$31,684
(% of AGI for various income ranges: 1065.0% for AGIs $75k-100k)
Profit/loss from business: +$1,533 (reported on 9.7% of returns)
Here:
+$1,533
State:
+$12,175
(% of AGI for various income ranges: 115.0% for AGIs $50k-75k)
Earned income credit: $2,550 (reported on 12.9% of returns)
Here:
$2,550
State:
$2,311
(% of AGI for various income ranges: 145.7% for AGIs below $25k)
Percentage of individuals using paid preparers for their 2020 taxes: 93.5%
Here:
94%
State:
93%
(% for various income ranges: 88.9% for AGIs below $25k, 100.0% for AGIs $25k-50k, 100.0% for AGIs $50k-75k, 100.0% for AGIs $75k-100k, 85.7% for AGIs $100k-200k)
Averages for the 2012 tax year for zip code 62633, filed in 2013:
Average Adjusted Gross Income (AGI) in 2012: $54,276 (Individual Income Tax Returns)
Here:
$54,276
State:
$68,058
Salary/wage: $38,122 (reported on 81.8% of returns)
Here:
$38,122
State:
$55,396
(% of AGI for various income ranges: 64.9% for AGIs below $25k, 76.5% for AGIs $25k-50k, 75.2% for AGIs $50k-75k, 76.9% for AGIs $75k-100k, 33.5% for AGIs $100k-200k)
Taxable interest for individuals: $656 (reported on 48.5% of returns)
This zip code:
$656
Illinois:
$1,969
(% of AGI for various income ranges: 1.1% for AGIs below $25k, 0.8% for AGIs $25k-50k, 0.5% for AGIs $50k-75k, 0.7% for AGIs $100k-200k)
Ordinary dividends: $1,614 (reported on 21.2% of returns)
Here:
$1,614
State:
$7,786
Net capital gain/loss in AGI: +$6,125 (reported on 12.1% of returns)
Here:
+$6,125
State:
+$22,183
Profit/loss from business: +$7,425 (reported on 12.1% of returns)
Here:
+$7,425
State:
+$12,903
Taxable individual retirement arrangement distribution: $4,550 (reported on 6.1% of returns)
62633:
$4,550
Illinois:
$17,929
Total itemized deductions: $21,200 (22% of AGI, reported on 18.2% of returns)
Here:
$21,200
State:
$26,433
Here:
21.7% of AGI
State:
19.2% of AGI
Charity contributions: $2,250 (reported on 12.1% of returns)
Here:
$2,250
State:
$4,525
Taxes paid: $7,033 (reported on 18.2% of returns)
62633:
$7,033
State:
$11,968
Earned income credit: $2,140 (reported on 15.2% of returns)
Here:
$2,140
State:
$2,349
(% of AGI for various income ranges: 8.1% for AGIs below $25k)
Percentage of individuals using paid preparers for their 2012 taxes: 69.7%
Here:
70%
State:
57%
(% for various income ranges: 72.7% for AGIs below $25k, 66.7% for AGIs $25k-50k, 60.0% for AGIs $50k-75k, 66.7% for AGIs $75k-100k, 80.0% for AGIs $100k-200k)
Averages for the 2004 tax year for zip code 62633, filed in 2005:
Average Adjusted Gross Income (AGI) in 2004: $39,531 (Individual Income Tax Returns)
Here:
$39,531
State:
$54,625
Salary/wage: $32,582 (reported on 78.5% of returns)
Here:
$32,582
State:
$46,811
(% of AGI for various income ranges: 83.3% for AGIs below $10k, 59.1% for AGIs $10k-25k, 73.1% for AGIs $25k-50k, 76.7% for AGIs $50k-75k, 68.0% for AGIs $75k-100k, 36.8% for AGIs over 100k)
Taxable interest for individuals: $1,526 (reported on 57.9% of returns)
This zip code:
$1,526
Illinois:
$2,101
(% of AGI for various income ranges: 6.0% for AGIs below $10k, 8.1% for AGIs $10k-25k, 2.5% for AGIs $25k-50k, 0.8% for AGIs $50k-75k, 0.9% for AGIs $75k-100k, 1.8% for AGIs over 100k)
Taxable dividends: $1,102 (reported on 26.3% of returns)
Here:
$1,102
State:
$4,306
(% of AGI for various income ranges: 1.3% for AGIs below $10k, 0.4% for AGIs $10k-25k, 0.4% for AGIs $25k-50k, 0.1% for AGIs $50k-75k, 0.4% for AGIs $75k-100k, 2.2% for AGIs over 100k)
Net capital gain/loss: +$1,900 (reported on 11.9% of returns)
Here:
+$1,900
State:
+$17,321
Profit/loss from business: +$9,370 (reported on 13.7% of returns)
Here:
+$9,370
State:
+$11,771
Profit/loss from farming: +$8,194 (reported on 9.3% of returns)
Here:
+$8,194
State:
+$2,327
Total itemized deductions: $14,143 (23% of AGI, reported on 14.6% of returns)
Here:
$14,143
State:
$20,239
Here:
23.3% of AGI
State:
19.5% of AGI
Charity contributions deductions: $1,364 (2% of AGI, reported on 9.9% of returns)
Here:
$1,364
State:
$3,719
Here:
2.3% of AGI
State:
3.4% of AGI
Total tax: $5,098 (reported on 78.8% of returns)
62633:
$5,098
State:
$9,882
(% of AGI for various income ranges: 1.6% for AGIs below $10k, 3.9% for AGIs $10k-25k, 6.9% for AGIs $25k-50k, 10.2% for AGIs $50k-75k, 13.1% for AGIs $75k-100k, 15.1% for AGIs over 100k)
Earned income credit: $1,634 (reported on 12.2% of returns)
Here:
$1,634
State:
$1,788
Percentage of individuals using paid preparers for their 2004 taxes: 67.5%
Here:
67%
State:
61%
(% for various income ranges: 62.0% for AGIs below $10k, 67.9% for AGIs $10k-25k, 67.1% for AGIs $25k-50k, 69.0% for AGIs $50k-75k, 79.3% for AGIs $75k-100k, 64.7% for AGIs over 100k)
Household received Food Stamps/SNAP in the past 12 months: 24 Household did not receive Food Stamps/SNAP in the past 12 months: 246
Women who did not have a birth in the past 12 months: 145 (32 now married, 113 unmarried)
Housing units in zip code 62633 with a mortgage: 108 (3 second mortgage, 3 both second mortgage and home equity loan) Median monthly owner costs for units with a mortgage: $911 Median monthly owner costs for units without a mortgage: $486
Residents with income below the poverty level in 2022:
This zip code:
20.7%
Whole state:
11.9%
Residents with income below 50% of the poverty level in 2022:
This zip code:
5.8%
Whole state:
5.7%
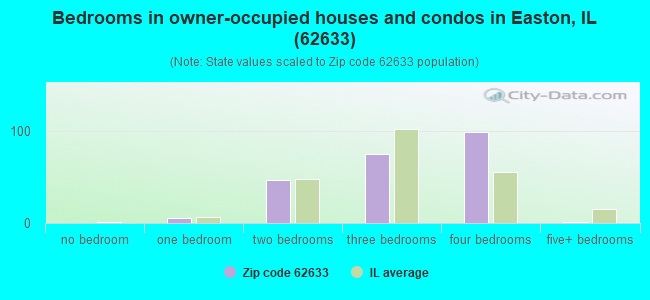
Median number of rooms in houses and condos:
Here:
7.0
State:
6.4
Median number of rooms in apartments:
Here:
5.0
State:
4.1
Notable locations in this zip code not listed on our city pages
Size of family households: 71 2-persons, 73 3-persons, 24 4-persons, 3 5-persons, 6 6-persons
Size of nonfamily households: 83 1-person, 9 2-persons, 1 3-persons
43 married couples with children.
18 single-parent households (18 men).
93.5% of residents of 62633 zip code speak English at home.
6.0% of residents speak Spanish at home (68% very well, 32% well).
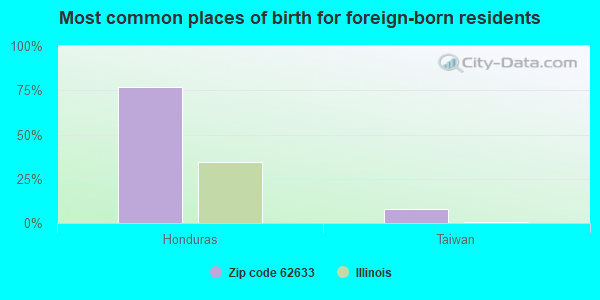
Foreign born population: 13 (2.2%) (100.0% of them are naturalized citizens)
This zip code:
2.2%
Whole state:
14.4%
77%Honduras
8%Taiwan
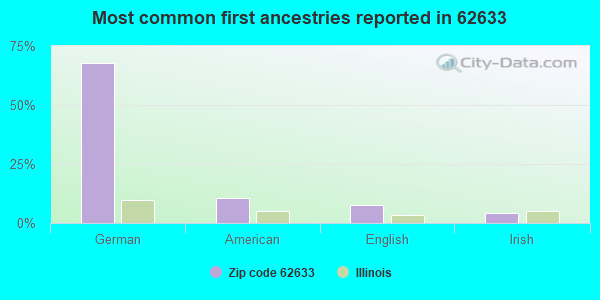
68%German
11%American
8%English
4%Irish
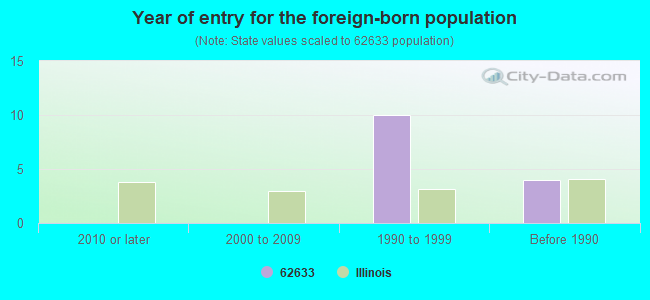
Year of entry for the foreign-born population
02010 or later
02000 to 2009
101990 to 1999
4Before 1990
Facilities with environmental interests located in this zip code:
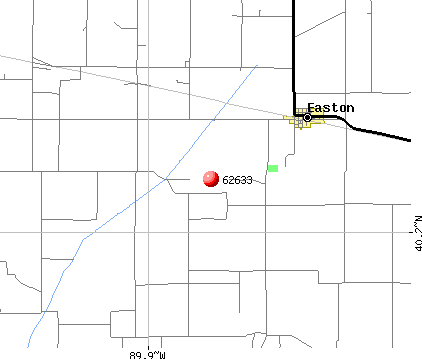
KNUPPEL OIL CO (R R #2 in EASTON, IL)
STATE MASTER (Illinois EPA Project) - AIR PROGRAM AIR MINOR (AIRS/AFS) Business SIC classification: PETROLEUM BULK STATIONS AND TERMINALS
MAHAN S FIBERGLAS CO (PO BOX 112 in EASTON, IL)
STATE MASTER (Illinois EPA Project) - AIR PROGRAM AIR MINOR (AIRS/AFS) Business SIC classification: NONCLASSIFIABLE ESTABLISHMENTS Alternative names: MAHAN'S FIBERGLAS CO.
ILLINI CENTRAL CUSD 189 (12544 STATE RTE 10 in EASTON, IL)
STATE MASTER (Illinois EPA Project) - SOLID WASTE PROGRAM Conditionally Exempt Small Quantity Generators, less than 100 kg/month of hazardous waste (Resource Conservation and Recovery Act (tracking hazardous waste)) - notification Organizations: IL CENTRAL CUSD #189 (CONTACT/OWNER)
Alternative names: ILLINI CENTRAL CUSD #189
ILLINI CENTRAL MIDDLE SCHOOL (12544 SR10 BOX 80 in EASTON, IL)
(Geographic Names Information System) (National Center for Education Statistics) - STATE ID-3806018901001 Organizations: ILLINI CENTRAL C U SCH DIST 189 (SCHOOL DISTRICT)
MASON COUNTY SERVICE CO (FIRST ST in EASTON, IL)
(Resource Conservation and Recovery Act (tracking hazardous waste)) Organizations: MASON COUNTY SERVICE COMPANY (CONTACT/OWNER)
MASON COUNTY SERVICE CO (RR 1 EAST in EASTON, IL)
(Resource Conservation and Recovery Act (tracking hazardous waste)) Organizations: MASON COUNTY SERVICE COMPANY (CONTACT/OWNER)
MASON COUNTY SERVICE CO (RR 1 WEST in EASTON, IL)
(Resource Conservation and Recovery Act (tracking hazardous waste)) Organizations: MASON COUNTY SERVICE COMPANY (CONTACT/OWNER)
OIL FILTER RECYCLERS (956 13TH LA #12 in VERO BEACH, FL)
Housing units lacking complete kitchen facilities: 4.2%
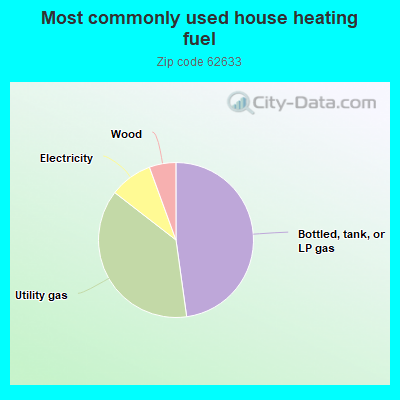
48.1%Bottled, tank, or LP gas
37.9%Utility gas
9.0%Electricity
5.6%Wood
Population in 1990: 1,056.
Place of birth for U.S.-born residents:
This state: 534
Northeast: 2
Midwest: 14
South: 10
West: 15
70% of the 62633 zip code residents lived in the same house 5 years ago. Out of people who lived in different houses, 65% lived in this county. Out of people who lived in different counties, 50% lived in Illinois.
99% of the 62633 zip code residents lived in the same house 1 year ago. Out of people who lived in different houses, 25% moved from this county. Out of people who lived in different houses, 50% moved from different county within same state.
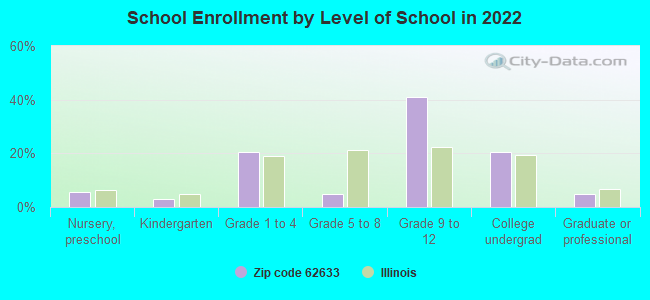
Private vs. public school enrollment:
Students in private schools in grades 1 to 8 (elementary and middle school): 17
Here:
59.2%
Illinois:
13.3%
Students in private schools in grades 9 to 12 (high school):
Here:
0.0%
Illinois:
9.9%
Students in private undergraduate colleges:
Here:
0.0%
Illinois:
27.4%
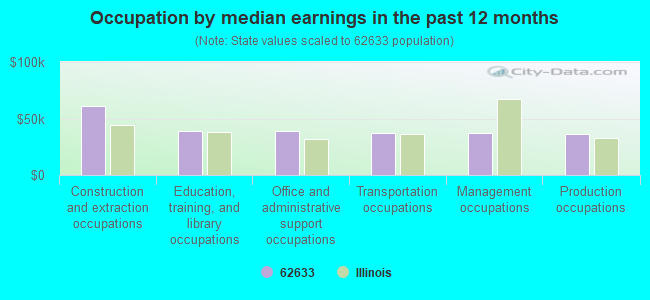
Occupation by median earnings in the past 12 months ($)
61,713Construction and extraction occupations
38,876Education, training, and library occupations
38,635Office and administrative support occupations
37,541Transportation occupations
37,099Management occupations
36,579Production occupations
Companies with federal contracts located in this zip code:
OIL FILTER RECYCLERS, INC (102 E MAIN ST in EASTON, IL; small business) : $780 in 3 contractsfrom 2004 to 2005
$4,680 with Air Force for Waste Treatment and Storage. Signed on 2004-10-01. Completion date: 2005-09-30.
-$780, same as above.Signed on 2005-11-03. Completion date: 2005-09-30.
-$3,120, same as above.Signed on 2005-07-25. Completion date: 2005-09-30.
Top industries in this zip code by the number of employees in 2005:
Wholesale Trade: Grain and Field Bean Merchant Wholesalers (5-9 employees: 1 establishment)
Finance and Insurance: Commercial Banking (1-4: 1)
Construction: Commercial and Institutional Building Construction (1-4: 1)
Other Services (except Public Administration): Religious Organizations (1-4: 1)
Construction: New Single-Family Housing Construction (except Operative Builders) (1-4: 1)
Construction: Residential Remodelers (1-4: 1)
Fatal accident statistics in 2010:
Fatal accident count: 1
Vehicles involved in fatal accidents: 1
Fatal accidents caused by drunken drivers: 1
Fatalities: 2
Persons involved in fatal accidents: 3
Pedestrians involved in fatal accidents: 0
2002 - 2018 National Fire Incident Reporting System (NFIRS) incidents
Based on the data from the years 2002 - 2018 the average number of fires per year is 11. The highest number of fires - 19 took place in 2014, and the least - 0 in 2004. The data has a dropping trend.
When looking into fire subcategories, the most reports belonged to: Outside Fires (61.5%), and Structure Fires (22.9%).
Fire incident types reported to NFIRS in Zip Code 62633

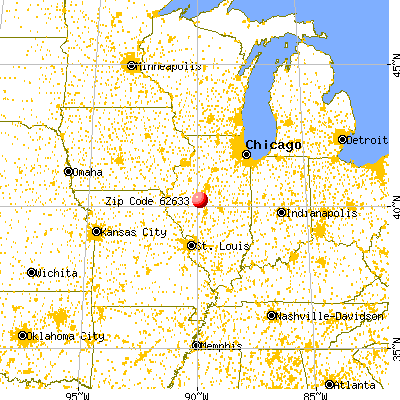


 Nearest zip codes: 61532, 62655, 61567, 62664, 62673, 62675.
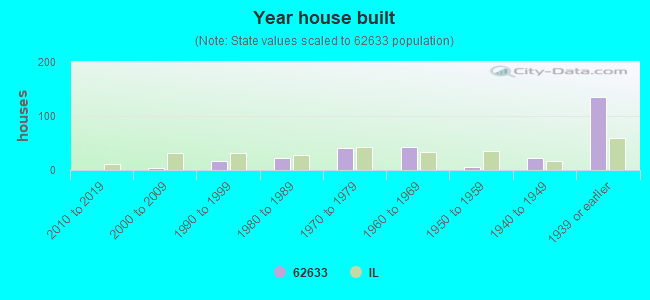


 Based on the data from the years 2002 - 2018 the average number of fires per year is 11. The highest number of fires - 19 took place in 2014, and the least - 0 in 2004. The data has a dropping trend.
 When looking into fire subcategories, the most reports belonged to: Outside Fires (61.5%), and Structure Fires (22.9%).