Estimated zip code population in 2022: 2,285 Zip code population in 2010: 2,449 Zip code population in 2000: 2,602
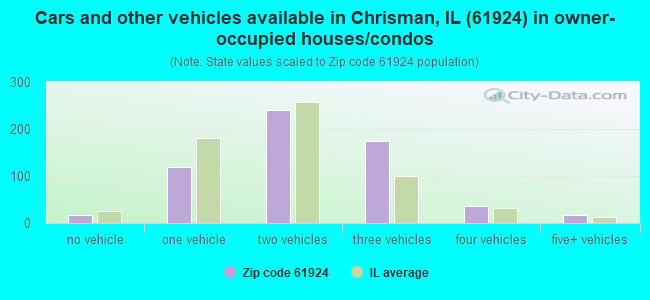
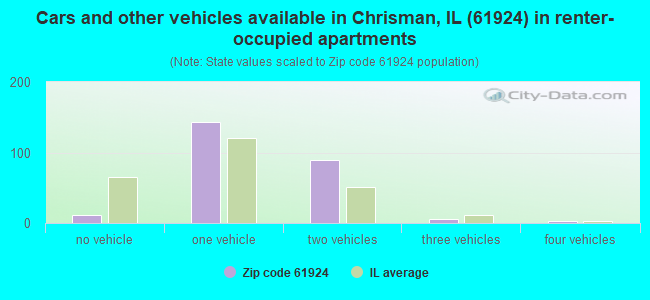
Houses and condos: 983 Renter-occupied apartments: 256
% of renters here:
29%
State:
33%
March 2022 cost of living index in zip code 61924: 83.8 (less than average, U.S. average is 100)
Land area: 144.9 sq. mi. Water area: 0.0 sq. mi.
Population density: 16 people per square mile
(very low).
OSM Map
General Map
Google Map
MSN Map
OSM Map
General Map
Google Map
MSN Map
OSM Map
General Map
Google Map
MSN Map
OSM Map
General Map
Google Map
MSN Map
Please wait while loading the map...
Real estate property taxes paid for housing units in 2022:
This zip code:
1.6% ($1,761)
Illinois:
2.0% ($4,912)
Median real estate property taxes paid for housing units with mortgages in 2022: $1,931 (1.5%) Median real estate property taxes paid for housing units with no mortgage in 2022: $1,305 (1.4%)
Business Search- 14 Million verified businesses
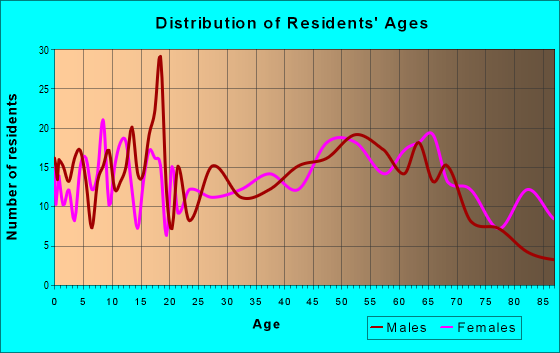
Males: 1,186
(51.9%)
Females: 1,098
(48.1%)
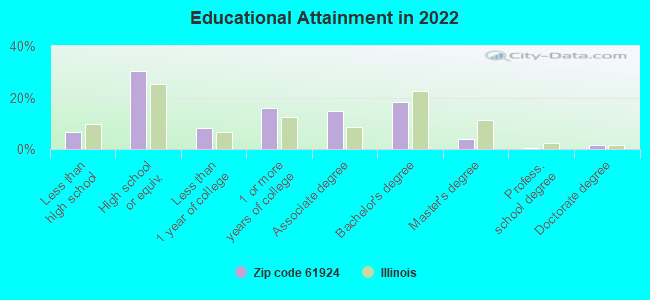
For population 25 years and over in 61924:
High school or higher: 92.9%
Bachelor's degree or higher: 24.2%
Graduate or professional degree: 6.1%
Unemployed: 6.6%
Mean travel time to work (commute): 21.3 minutes
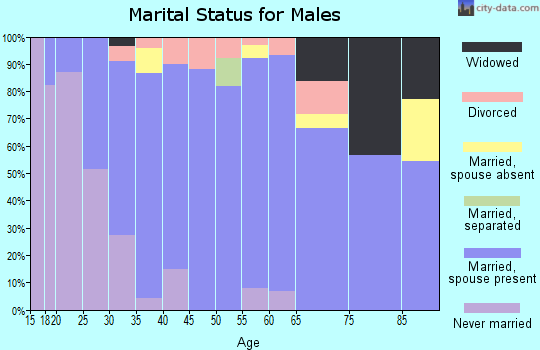
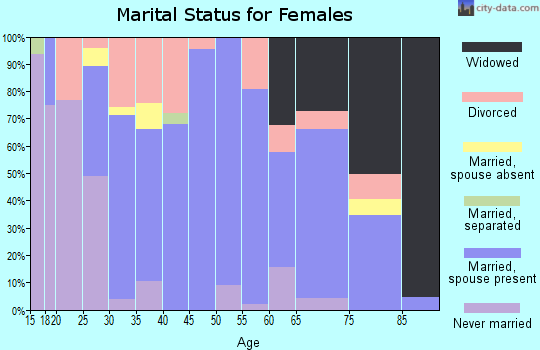
For population 15 years and over in 61924:
Never married: 18.6%
Now married: 62.0%
Separated: 0.7%
Widowed: 7.3%
Divorced: 11.4%
Zip code 61924 compared to state average:
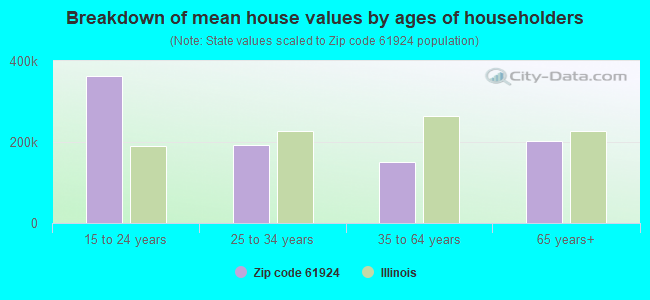
Median house value below state average.
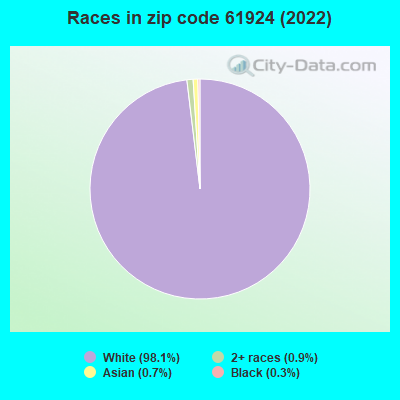
Black race population percentage significantly below state average.
Hispanic race population percentage significantly below state average.
Median age above state average.
Foreign-born population percentage significantly below state average.
Length of stay since moving in significantly above state average.
Number of college students below state average.
Percentage of population with a bachelor's degree or higher below state average.
Averages for the 2020 tax year for zip code 61924, filed in 2021:
Average Adjusted Gross Income (AGI) in 2020: $59,356 (Individual Income Tax Returns)
Here:
$59,356
State:
$82,626
Salary/wage: $48,523 (reported on 76.3% of returns)
Here:
$48,523
State:
$66,640
(% of AGI for various income ranges: 1024.0% for AGIs below $25k, 3210.5% for AGIs $25k-50k, 5261.8% for AGIs $50k-75k, 7680.0% for AGIs $75k-100k, 14738.0% for AGIs $100k-200k)
Taxable interest for individuals: $917 (reported on 36.1% of returns)
This zip code:
$917
Illinois:
$2,376
(% of AGI for various income ranges: 12.5% for AGIs below $25k, 29.0% for AGIs $25k-50k, 30.0% for AGIs $50k-75k, 20.0% for AGIs $75k-100k, 187.0% for AGIs $100k-200k)
Ordinary dividends: $3,538 (reported on 16.5% of returns)
Here:
$3,538
State:
$9,061
(% of AGI for various income ranges: 53.5% for AGIs $25k-50k, 110.9% for AGIs $50k-75k, 100.0% for AGIs $75k-100k, 247.0% for AGIs $100k-200k)
Net capital gain/loss in AGI: +$7,587 (reported on 15.5% of returns)
Here:
+$7,587
State:
+$31,684
(% of AGI for various income ranges: 22.5% for AGIs below $25k, 80.0% for AGIs $25k-50k, 159.1% for AGIs $50k-75k, 180.0% for AGIs $75k-100k, 596.0% for AGIs $100k-200k)
Profit/loss from business: +$4,467 (reported on 12.4% of returns)
Here:
+$4,467
State:
+$12,175
(% of AGI for various income ranges: 125.5% for AGIs below $25k, 22.7% for AGIs $50k-75k, 260.0% for AGIs $100k-200k)
Taxable individual retirement arrangement distribution: $15,375 (reported on 12.4% of returns)
61924:
$15,375
Illinois:
$21,613
(% of AGI for various income ranges: 205.0% for AGIs $25k-50k, 553.6% for AGIs $50k-75k, 826.0% for AGIs $100k-200k)
Earned income credit: $2,138 (reported on 13.4% of returns)
Here:
$2,138
State:
$2,311
(% of AGI for various income ranges: 82.0% for AGIs below $25k, 57.0% for AGIs $25k-50k)
Percentage of individuals using paid preparers for their 2020 taxes: 95.9%
Here:
96%
State:
93%
(% for various income ranges: 96.6% for AGIs below $25k, 96.0% for AGIs $25k-50k, 100.0% for AGIs $50k-75k, 90.9% for AGIs $75k-100k, 93.3% for AGIs $100k-200k, 100.0% for AGIs over 200k)
Averages for the 2012 tax year for zip code 61924, filed in 2013:
Average Adjusted Gross Income (AGI) in 2012: $55,112 (Individual Income Tax Returns)
Here:
$55,112
State:
$68,058
Salary/wage: $39,761 (reported on 82.2% of returns)
Here:
$39,761
State:
$55,396
(% of AGI for various income ranges: 68.5% for AGIs below $25k, 72.2% for AGIs $25k-50k, 68.7% for AGIs $50k-75k, 71.6% for AGIs $75k-100k, 77.1% for AGIs $100k-200k)
Taxable interest for individuals: $907 (reported on 43.6% of returns)
This zip code:
$907
Illinois:
$1,969
(% of AGI for various income ranges: 1.7% for AGIs below $25k, 0.8% for AGIs $25k-50k, 0.4% for AGIs $50k-75k, 0.7% for AGIs $75k-100k, 0.9% for AGIs $100k-200k, 0.3% for AGIs over 200k)
Ordinary dividends: $2,252 (reported on 20.8% of returns)
Here:
$2,252
State:
$7,786
(% of AGI for various income ranges: 1.3% for AGIs below $25k, 0.7% for AGIs $25k-50k, 0.7% for AGIs $50k-75k, 0.9% for AGIs $75k-100k, 1.5% for AGIs $100k-200k)
Net capital gain/loss in AGI: +$2,844 (reported on 15.8% of returns)
Here:
+$2,844
State:
+$22,183
(% of AGI for various income ranges: 0.6% for AGIs below $25k, 0.3% for AGIs $50k-75k, 0.3% for AGIs $75k-100k, 2.8% for AGIs $100k-200k)
Profit/loss from business: +$4,908 (reported on 11.9% of returns)
Here:
+$4,908
State:
+$12,903
(% of AGI for various income ranges: 1.8% for AGIs below $25k, 2.5% for AGIs $25k-50k, 2.1% for AGIs $50k-75k, 0.7% for AGIs $100k-200k)
Taxable individual retirement arrangement distribution: $11,255 (reported on 10.9% of returns)
61924:
$11,255
Illinois:
$17,929
(% of AGI for various income ranges: 3.8% for AGIs below $25k, 2.1% for AGIs $25k-50k, 3.8% for AGIs $50k-75k, 3.9% for AGIs $100k-200k)
Total itemized deductions: $18,326 (17% of AGI, reported on 22.8% of returns)
Here:
$18,326
State:
$26,433
Here:
17.0% of AGI
State:
19.2% of AGI
(% of AGI for various income ranges: 9.4% for AGIs below $25k, 5.9% for AGIs $25k-50k, 7.2% for AGIs $50k-75k, 6.9% for AGIs $75k-100k, 8.8% for AGIs $100k-200k, 7.6% for AGIs over 200k)
Charity contributions: $3,773 (reported on 14.9% of returns)
Here:
$3,773
State:
$4,525
(% of AGI for various income ranges: 0.6% for AGIs $25k-50k, 0.7% for AGIs $50k-75k, 0.6% for AGIs $75k-100k, 1.3% for AGIs $100k-200k, 2.0% for AGIs over 200k)
Taxes paid: $6,745 (reported on 21.8% of returns)
61924:
$6,745
State:
$11,968
(% of AGI for various income ranges: 1.1% for AGIs below $25k, 1.2% for AGIs $25k-50k, 2.2% for AGIs $50k-75k, 2.4% for AGIs $75k-100k, 3.8% for AGIs $100k-200k, 3.7% for AGIs over 200k)
Earned income credit: $1,979 (reported on 13.9% of returns)
Here:
$1,979
State:
$2,349
(% of AGI for various income ranges: 5.1% for AGIs below $25k, 0.8% for AGIs $25k-50k)
Percentage of individuals using paid preparers for their 2012 taxes: 70.3%
Here:
70%
State:
57%
(% for various income ranges: 61.1% for AGIs below $25k, 69.2% for AGIs $25k-50k, 73.3% for AGIs $50k-75k, 80.0% for AGIs $75k-100k, 81.8% for AGIs $100k-200k, 100.0% for AGIs over 200k)
Averages for the 2004 tax year for zip code 61924, filed in 2005:
Average Adjusted Gross Income (AGI) in 2004: $40,658 (Individual Income Tax Returns)
Here:
$40,658
State:
$54,625
Salary/wage: $35,858 (reported on 82.2% of returns)
Here:
$35,858
State:
$46,811
(% of AGI for various income ranges: 98.1% for AGIs below $10k, 71.8% for AGIs $10k-25k, 73.3% for AGIs $25k-50k, 76.2% for AGIs $50k-75k, 80.1% for AGIs $75k-100k, 58.1% for AGIs over 100k)
Taxable interest for individuals: $1,183 (reported on 52.8% of returns)
This zip code:
$1,183
Illinois:
$2,101
(% of AGI for various income ranges: 9.1% for AGIs below $10k, 4.7% for AGIs $10k-25k, 1.8% for AGIs $25k-50k, 0.7% for AGIs $50k-75k, 0.7% for AGIs $75k-100k, 0.8% for AGIs over 100k)
Taxable dividends: $1,156 (reported on 24.6% of returns)
Here:
$1,156
State:
$4,306
(% of AGI for various income ranges: 3.9% for AGIs below $10k, 1.0% for AGIs $10k-25k, 0.4% for AGIs $25k-50k, 0.3% for AGIs $50k-75k, 0.3% for AGIs $75k-100k, 1.4% for AGIs over 100k)
Net capital gain/loss: +$7,117 (reported on 14.7% of returns)
Here:
+$7,117
State:
+$17,321
(% of AGI for various income ranges: -1.2% for AGIs below $10k, -0.5% for AGIs $10k-25k, -0.1% for AGIs $25k-50k, 2.1% for AGIs $50k-75k, 0.3% for AGIs $75k-100k, 10.3% for AGIs over 100k)
Profit/loss from business: +$3,720 (reported on 15.4% of returns)
Here:
+$3,720
State:
+$11,771
(% of AGI for various income ranges: -1.7% for AGIs below $10k, 3.4% for AGIs $10k-25k, 2.0% for AGIs $25k-50k, 1.3% for AGIs $50k-75k, 1.6% for AGIs $75k-100k)
Profit/loss from farming: +$12,134 (reported on 13.6% of returns)
Here:
+$12,134
State:
+$2,327
(% of AGI for various income ranges: -27.0% for AGIs below $10k, 0.3% for AGIs $10k-25k, 3.3% for AGIs $25k-50k, 3.7% for AGIs $50k-75k, 4.3% for AGIs $75k-100k, 9.8% for AGIs over 100k)
IRA payment deduction: $2,400 (reported on 2.4% of returns)
61924:
$2,400
Illinois:
$3,087
Total itemized deductions: $15,566 (23% of AGI, reported on 18.9% of returns)
Here:
$15,566
State:
$20,239
Here:
22.7% of AGI
State:
19.5% of AGI
(% of AGI for various income ranges: 11.4% for AGIs $10k-25k, 5.1% for AGIs $25k-50k, 7.5% for AGIs $50k-75k, 5.8% for AGIs $75k-100k, 9.5% for AGIs over 100k)
Charity contributions deductions: $3,849 (5% of AGI, reported on 13.3% of returns)
Here:
$3,849
State:
$3,719
Here:
5.2% of AGI
State:
3.4% of AGI
(% of AGI for various income ranges: 1.1% for AGIs $10k-25k, 0.6% for AGIs $25k-50k, 1.4% for AGIs $50k-75k, 0.8% for AGIs $75k-100k, 2.6% for AGIs over 100k)
Total tax: $5,380 (reported on 76.1% of returns)
61924:
$5,380
State:
$9,882
(% of AGI for various income ranges: 1.7% for AGIs below $10k, 4.3% for AGIs $10k-25k, 7.3% for AGIs $25k-50k, 9.4% for AGIs $50k-75k, 11.4% for AGIs $75k-100k, 16.6% for AGIs over 100k)
Earned income credit: $1,552 (reported on 11.1% of returns)
Here:
$1,552
State:
$1,788
Percentage of individuals using paid preparers for their 2004 taxes: 72.2%
Here:
72%
State:
61%
(% for various income ranges: 63.4% for AGIs below $10k, 66.5% for AGIs $10k-25k, 73.3% for AGIs $25k-50k, 76.4% for AGIs $50k-75k, 82.0% for AGIs $75k-100k, 90.0% for AGIs over 100k)
Household received Food Stamps/SNAP in the past 12 months: 123 Household did not receive Food Stamps/SNAP in the past 12 months: 745
Women who had a birth in the past 12 months: 14 (0 now married, 14 unmarried) Women who did not have a birth in the past 12 months: 413 (243 now married, 167 unmarried)
Housing units in zip code 61924 with a mortgage: 320 (19 second mortgage, 16 both second mortgage and home equity loan) Houses without a mortgage: 21
Median monthly owner costs for units with a mortgage: $1,124 Median monthly owner costs for units without a mortgage: $514
Residents with income below the poverty level in 2022:
This zip code:
15.1%
Whole state:
11.9%
Residents with income below 50% of the poverty level in 2022:
This zip code:
5.4%
Whole state:
5.7%
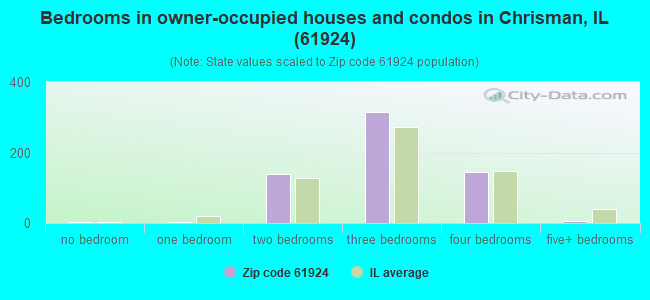
Median number of rooms in houses and condos:
Here:
6.3
State:
6.4
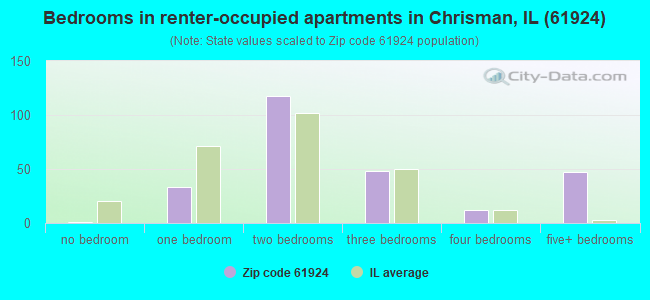
Median number of rooms in apartments:
Here:
5.1
State:
4.1
Notable locations in this zip code not listed on our city pages
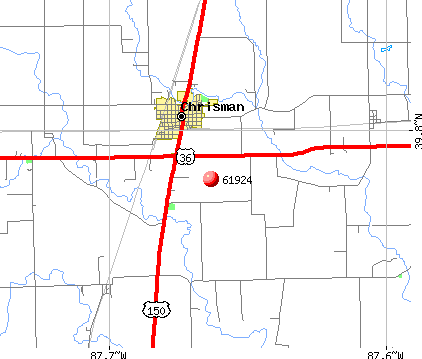
Notable locations in zip code 61924: Chrisman Fire Protection District (A), Northern Edgar County Ambulance Service (B). Display/hide their locations on the map
Churches in zip code 61924 include: Sugar Grove Church (A), Chrisman Christian Church (B), Chrisman First Baptist Church (C), Chrisman United Methodist Church (D), Wesley Chapel (E). Display/hide their locations on the map
Cemeteries: Adams Cemetery (1), McCauley Cemetery (2), Bloomfield Cemetery (3), Woodland Cemetery (4), Bright Cemetery (5), Wesley Chapel Cemetery (6), Sugar Grove Cemetery (7). Display/hide their locations on the map
Streams, rivers, and creeks: Bonwell Branch (A), Lick Run (B), Crabapple Creek (C), South Fork Brouilletts Creek (D), Snake Creek (E), Indian Creek (F), Willow Creek (G). Display/hide their locations on the map
In group quarters: 162 (-1 institutionalized population)
Size of family households: 310 2-persons, 126 3-persons, 157 4-persons, 33 5-persons, 4 6-persons
Size of nonfamily households: 176 1-person, 56 2-persons, 2 4-persons
423 married couples with children.
82 single-parent households (17 men, 65 women).
98.9% of residents of 61924 zip code speak English at home.
0.1% of residents speak other Indo-European language at home (100% very well).
0.6% of residents speak Asian or Pacific Island language at home (100% well).
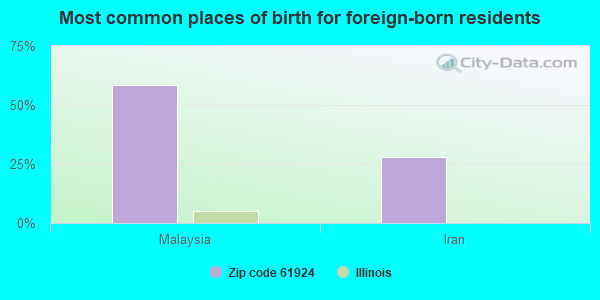
Foreign born population: 36 (1.6%) (75.2% of them are naturalized citizens)
This zip code:
1.6%
Whole state:
14.4%
58%Malaysia
28%Iran
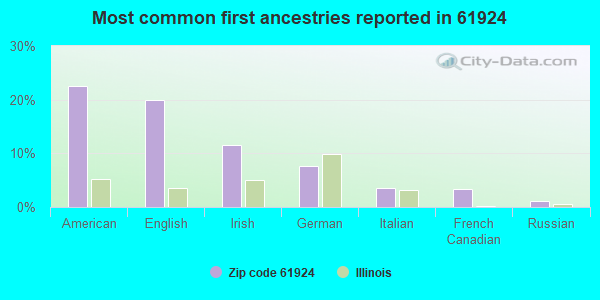
22%American
20%English
11%Irish
8%German
3%Italian
3%French Canadian
1%Russian
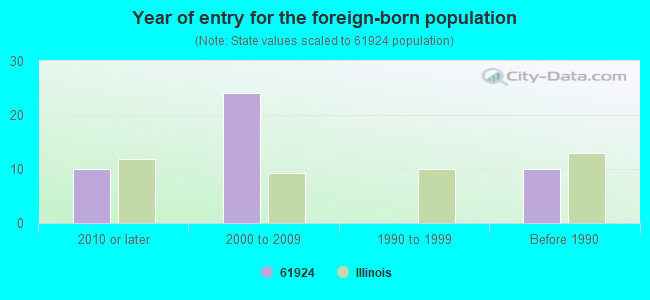
Year of entry for the foreign-born population
102010 or later
242000 to 2009
01990 to 1999
10Before 1990
Facilities with environmental interests located in this zip code:
CHRISMAN STP (700 EAST WASHINGTON in CHRISMAN, IL)
STATE MASTER (Illinois EPA Project) - National Pollutant Discharge Elimination System Permit National Pollutant Discharge Elimination System NON-MAJOR (Tracking pollutant discharge elimination systems) - permit National Pollutant Discharge Elimination System NON-MAJOR (Tracking pollutant discharge elimination systems) - permit Business SIC classification: SEWERAGE SYSTEMS Alternative names: CHRISMAN, CITY OF, CHRISMAN STP, CITY OF
RIGGEN OIL CO (WEST CLEVELAND AVE in CHRISMAN, IL)
STATE MASTER (Illinois EPA Project) - AIR PROGRAM AIR MINOR (AIRS/AFS) CRITERIA AND HAZARDOUS AIR POLLUTANT INVENTORY (Inventory of air pollution sources) Business SIC classification: PETROLEUM BULK STATIONS AND TERMINALS
KINDRED FARMS TRUCKING (U.S. RT. 36 APPROX. 1 MI. WEST in CHRISMAN, IL)
STATE MASTER (Illinois EPA Project) - National Pollutant Discharge Elimination System Permit National Pollutant Discharge Elimination System NON-MAJOR (Tracking pollutant discharge elimination systems) - permit
MOONEY MOTORS INC (115 W MONROE in CHRISMAN, IL)
STATE MASTER (Illinois EPA Project) - SOLID WASTE PROGRAM, HAZARDOUS WASTE PROGRAM Small Quantity Generators, between 100 kg and 1000 kg of hazardous waste/month (Resource Conservation and Recovery Act (tracking hazardous waste)) - notification TRANSPORTER (Resource Conservation and Recovery Act (tracking hazardous waste)) - notification Organizations: MOONEY NORMAN J (CONTACT/OWNER)
CHRISMAN WTP (214 EAST WASHINGTON STREET in CHRISMAN, IL)
STATE MASTER (Illinois EPA Project) - National Pollutant Discharge Elimination System Permit National Pollutant Discharge Elimination System NON-MAJOR (Tracking pollutant discharge elimination systems) - permit Business SIC classification: WATER SUPPLY Alternative names: CHRISMAN WTP, CITY OF
PHELPS, DON AND VICKY (23486 E 1575 RD in CHRISMAN, IL)
(Integrated Compliance Information System) - ICIS-05-2002-0047, FORMAL ENFORCEMENT ACTION COMPLIANCE ACTIVITY (Tracking inspections of insecticide, fungicide, and rodenticide, and toxic substances) Business SIC classification: REAL ESTATE AGENTS AND MANAGERS Alternative names: JOHN & VICKEY PHELPS, VICKEY PHELPS
CHRISMAN HIGH SCHOOL (23231 IL HWY 1 in CHRISMAN, IL)
(Geographic Names Information System) (National Center for Education Statistics) - STATE ID-1102300600001 Organizations: EDGAR COUNTY C U DIST 6 (SCHOOL DISTRICT)
CHRISMAN GRADE SCHOOL (111 N PENNSYLVANIA in CHRISMAN, IL)
(National Center for Education Statistics) - STATE ID-1102300602003 Organizations: EDGAR COUNTY C U DIST 6 (SCHOOL DISTRICT)
CHRISMAN-SCOTTLAND JR HIGH SCHOOL (23231 IL HWY 1 in CHRISMAN, IL)
(National Center for Education Statistics) - STATE ID-1102300601001 Organizations: EDGAR COUNTY C U DIST 6 (SCHOOL DISTRICT)
COMO OIL CO (109 S PENNA in CHRISMAN, IL)
Large Quantity Generators, more that 1000 kg of hazardous waste/month (Resource Conservation and Recovery Act (tracking hazardous waste)) - notification Organizations: LAHTI W A (CONTACT/OWNER)
ILLINI FS, INC. - CHRISMAN NH3 (15412 U.S. 36 in CHRISMAN, IL)
ENFORCEMENT/COMPLIANCE ACTIVITY (Integrated Compliance Information System)
Housing units lacking complete plumbing facilities: 2.5% Housing units lacking complete kitchen facilities: 2.6%
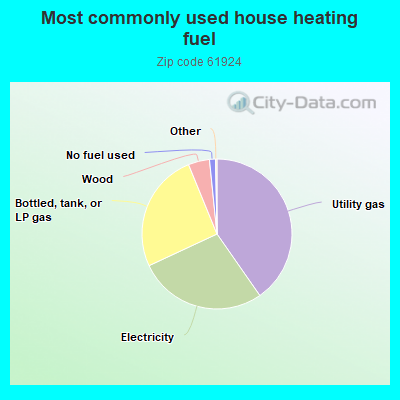
40.4%Utility gas
27.8%Electricity
25.8%Bottled, tank, or LP gas
4.6%Wood
1.3%No fuel used
Population in 1990: 2,269. Population change in the 1990s: +333 (+14.7%).
Place of birth for U.S.-born residents:
This state: 1,464
Northeast: 9
Midwest: 482
South: 233
West: 42
65% of the 61924 zip code residents lived in the same house 5 years ago. Out of people who lived in different houses, 57% lived in this county. Out of people who lived in different counties, 50% lived in Illinois.
89% of the 61924 zip code residents lived in the same house 1 year ago. Out of people who lived in different houses, 42% moved from this county. Out of people who lived in different houses, 52% moved from different county within same state. Out of people who lived in different houses, 5% moved from different state. Out of people who lived in different houses, 1% moved from abroad.
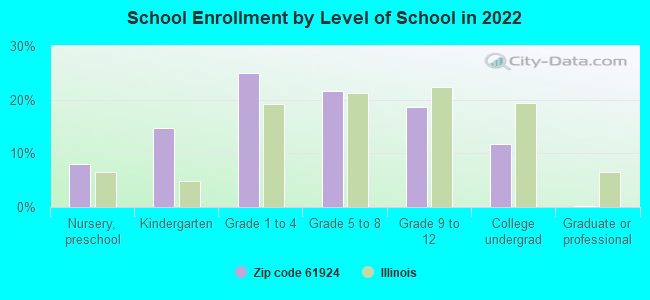
Private vs. public school enrollment:
Students in private schools in grades 1 to 8 (elementary and middle school): 13
Here:
7.4%
Illinois:
13.3%
Students in private schools in grades 9 to 12 (high school):
Here:
0.0%
Illinois:
9.9%
Students in private undergraduate colleges: 21
Here:
45.3%
Illinois:
27.4%
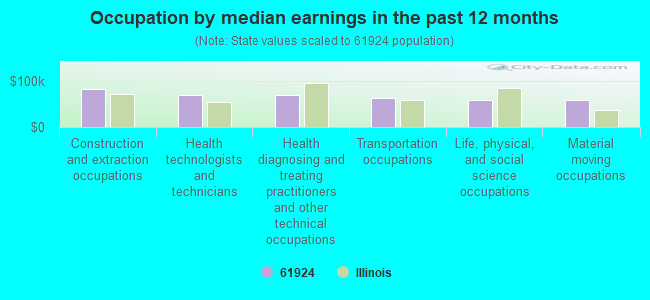
Occupation by median earnings in the past 12 months ($)
82,894Construction and extraction occupations
69,253Health technologists and technicians
68,498Health diagnosing and treating practitioners and other technical occupations
62,074Transportation occupations
59,597Life, physical, and social science occupations
59,222Material moving occupations
Top industries in this zip code by the number of employees in 2005:
Health Care and Social Assistance: Nursing Care Facilities (100-249 employees: 1 establishment)
Finance and Insurance: Commercial Banking (10-19: 2)
Wholesale Trade: Farm and Garden Machinery and Equipment Merchant Wholesalers (10-19: 1, 5-9: 1)
Health Care and Social Assistance: Offices of Dentists (10-19: 1)
Other Services (except Public Administration): Religious Organizations (1-4: 6)
Wholesale Trade: Grain and Field Bean Merchant Wholesalers (1-4: 4)
Accommodation and Food Services: Full-Service Restaurants (5-9: 1)
People in group quarters in 2010:
86 people in nursing facilities/skilled-nursing facilities
People in group quarters in 2000:
179 people in nursing homes
8 people in homes for abused, dependent, and neglected children
2002 - 2017 National Fire Incident Reporting System (NFIRS) incidents
Based on the data from the years 2002 - 2017 the average number of fires per year is 14. The highest number of reported fire incidents - 33 took place in 2010, and the least - 1 in 2015. The data has a dropping trend.
When looking into fire subcategories, the most reports belonged to: Structure Fires (44.4%), and Outside Fires (34.5%).
Fire incident types reported to NFIRS in Zip Code 61924
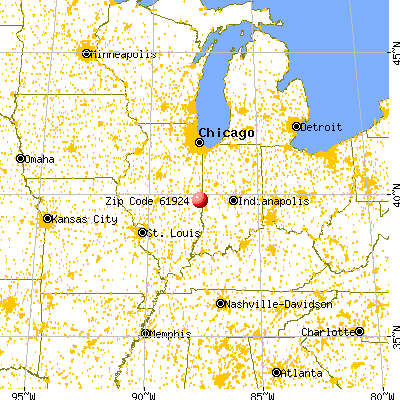


 Nearest zip codes: 61870, 61940, 61850, 47847, 61944, 61846.
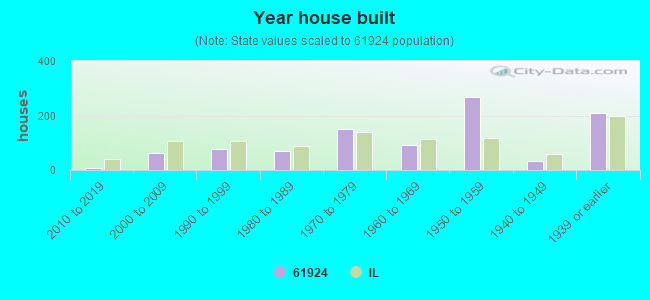


 Based on the data from the years 2002 - 2017 the average number of fires per year is 14. The highest number of reported fire incidents - 33 took place in 2010, and the least - 1 in 2015. The data has a dropping trend.
 When looking into fire subcategories, the most reports belonged to: Structure Fires (44.4%), and Outside Fires (34.5%).