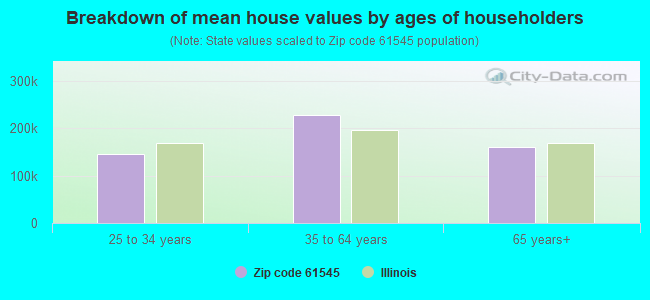
Estimated median house/condo value in 2022: $177,835
61545:
$177,835
Illinois:
$251,600
Median resident age:
This zip code:
39.0 years
Illinois median age:
39.1 years
Average household size:
This zip code:
2.3 people
Illinois:
2.4 people
Averages for the 2020 tax year for zip code 61545, filed in 2021:
Average Adjusted Gross Income (AGI) in 2020: $70,325 (Individual Income Tax Returns)
Here:
$70,325
State:
$82,626
Salary/wage: $55,808 (reported on 78.1% of returns)
Here:
$55,808
State:
$66,640
(% of AGI for various income ranges: 1196.0% for AGIs below $25k, 3758.3% for AGIs $25k-50k, 8413.3% for AGIs $50k-75k, 7270.0% for AGIs $75k-100k, 15985.0% for AGIs $100k-200k)
Taxable interest for individuals: $875 (reported on 50.0% of returns)
This zip code:
$875
Illinois:
$2,376
(% of AGI for various income ranges: 24.0% for AGIs below $25k, 73.3% for AGIs $25k-50k, 23.3% for AGIs $50k-75k, 40.0% for AGIs $75k-100k, 162.5% for AGIs $100k-200k)
Ordinary dividends: $2,257 (reported on 21.9% of returns)
Here:
$2,257
State:
$9,061
(% of AGI for various income ranges: 53.3% for AGIs $25k-50k, 315.0% for AGIs $100k-200k)
Net capital gain/loss in AGI: +$9,650 (reported on 18.8% of returns)
Here:
+$9,650
State:
+$31,684
(% of AGI for various income ranges: 108.3% for AGIs $25k-50k, 1285.0% for AGIs $100k-200k)
Profit/loss from business: +$1,025 (reported on 12.5% of returns)
Here:
+$1,025
State:
+$12,175
(% of AGI for various income ranges: 122.0% for AGIs below $25k)
Taxable individual retirement arrangement distribution: $10,650 (reported on 6.2% of returns)
61545:
$10,650
Illinois:
$21,613
(% of AGI for various income ranges: 426.0% for AGIs below $25k)
Earned income credit: $1,667 (reported on 9.4% of returns)
Here:
$1,667
State:
$2,311
(% of AGI for various income ranges: 100.0% for AGIs below $25k)
Percentage of individuals using paid preparers for their 2020 taxes: 84.4%
Here:
84%
State:
93%
(% for various income ranges: 87.5% for AGIs below $25k, 87.5% for AGIs $25k-50k, 80.0% for AGIs $50k-75k, 75.0% for AGIs $75k-100k, 85.7% for AGIs $100k-200k)
Averages for the 2012 tax year for zip code 61545, filed in 2013:
Average Adjusted Gross Income (AGI) in 2012: $62,681 (Individual Income Tax Returns)
Here:
$62,681
State:
$68,058
Salary/wage: $45,332 (reported on 80.6% of returns)
Here:
$45,332
State:
$55,396
(% of AGI for various income ranges: 65.1% for AGIs below $25k, 72.8% for AGIs $25k-50k, 62.4% for AGIs $50k-75k, 83.7% for AGIs $75k-100k, 44.0% for AGIs $100k-200k)
Taxable interest for individuals: $893 (reported on 48.4% of returns)
This zip code:
$893
Illinois:
$1,969
(% of AGI for various income ranges: 0.8% for AGIs below $25k, 0.4% for AGIs $25k-50k, 1.8% for AGIs $50k-75k, 0.2% for AGIs $75k-100k, 0.5% for AGIs $100k-200k)
Ordinary dividends: $1,371 (reported on 22.6% of returns)
Here:
$1,371
State:
$7,786
(% of AGI for various income ranges: 2.3% for AGIs below $25k, 0.5% for AGIs $50k-75k, 0.5% for AGIs $100k-200k)
Net capital gain/loss in AGI: +$125 (reported on 12.9% of returns)
Here:
+$125
State:
+$22,183
Profit/loss from business: +$8,520 (reported on 16.1% of returns)
Here:
+$8,520
State:
+$12,903
Taxable individual retirement arrangement distribution: $12,467 (reported on 9.7% of returns)
61545:
$12,467
Illinois:
$17,929
Total itemized deductions: $16,922 (16% of AGI, reported on 29.0% of returns)
Here:
$16,922
State:
$26,433
Here:
15.8% of AGI
State:
19.2% of AGI
Charity contributions: $2,500 (reported on 19.4% of returns)
Here:
$2,500
State:
$4,525
Taxes paid: $7,478 (reported on 29.0% of returns)
61545:
$7,478
State:
$11,968
Earned income credit: $1,800 (reported on 16.1% of returns)
Here:
$1,800
State:
$2,349
(% of AGI for various income ranges: 6.8% for AGIs below $25k)
Percentage of individuals using paid preparers for their 2012 taxes: 58.1%
Here:
58%
State:
57%
(% for various income ranges: 40.0% for AGIs below $25k, 62.5% for AGIs $25k-50k, 100.0% for AGIs $50k-75k, 80.0% for AGIs $100k-200k)
Averages for the 2004 tax year for zip code 61545, filed in 2005:
Average Adjusted Gross Income (AGI) in 2004: $38,454 (Individual Income Tax Returns)
Here:
$38,454
State:
$54,625
Salary/wage: $34,863 (reported on 81.8% of returns)
Here:
$34,863
State:
$46,811
(% of AGI for various income ranges: 110.2% for AGIs below $10k, 74.8% for AGIs $10k-25k, 82.4% for AGIs $25k-50k, 82.4% for AGIs $50k-75k, 72.6% for AGIs $75k-100k, 48.9% for AGIs over 100k)
Taxable interest for individuals: $917 (reported on 53.7% of returns)
This zip code:
$917
Illinois:
$2,101
(% of AGI for various income ranges: 3.4% for AGIs below $10k, 4.6% for AGIs $10k-25k, 0.5% for AGIs $25k-50k, 0.5% for AGIs $50k-75k, 0.7% for AGIs $75k-100k, 1.7% for AGIs over 100k)
Taxable dividends: $257 (reported on 23.6% of returns)
Here:
$257
State:
$4,306
(% of AGI for various income ranges: 0.3% for AGIs $10k-25k, 0.1% for AGIs $25k-50k, 0.1% for AGIs $50k-75k, 0.2% for AGIs $75k-100k, 0.2% for AGIs over 100k)
Net capital gain/loss: +$391 (reported on 14.7% of returns)
Here:
+$391
State:
+$17,321
Profit/loss from business: +$571 (reported on 13.4% of returns)
Here:
+$571
State:
+$11,771
Profit/loss from farming: +$4,714 (reported on 11.2% of returns)
Here:
+$4,714
State:
+$2,327
Total itemized deductions: $13,734 (21% of AGI, reported on 20.4% of returns)
Here:
$13,734
State:
$20,239
Here:
21.1% of AGI
State:
19.5% of AGI
(% of AGI for various income ranges: 8.0% for AGIs $25k-50k, 7.8% for AGIs $50k-75k, 9.9% for AGIs $75k-100k, 8.1% for AGIs over 100k)
Charity contributions deductions: $1,837 (3% of AGI, reported on 15.7% of returns)
Here:
$1,837
State:
$3,719
Here:
2.7% of AGI
State:
3.4% of AGI
Total tax: $5,016 (reported on 80.8% of returns)
61545:
$5,016
State:
$9,882
(% of AGI for various income ranges: 5.4% for AGIs below $10k, 4.5% for AGIs $10k-25k, 7.4% for AGIs $25k-50k, 9.9% for AGIs $50k-75k, 12.1% for AGIs $75k-100k, 18.3% for AGIs over 100k)
Earned income credit: $1,516 (reported on 9.9% of returns)
Here:
$1,516
State:
$1,788
Percentage of individuals using paid preparers for their 2004 taxes: 59.4%
Here:
59%
State:
61%
(% for various income ranges: 56.5% for AGIs below $10k, 56.4% for AGIs $10k-25k, 55.7% for AGIs $25k-50k, 64.7% for AGIs $50k-75k, 73.1% for AGIs $75k-100k, 64.7% for AGIs over 100k)
Household received Food Stamps/SNAP in the past 12 months: 33 Household did not receive Food Stamps/SNAP in the past 12 months: 299
Women who had a birth in the past 12 months: 7 (7 now married, 0 unmarried) Women who did not have a birth in the past 12 months: 127 (34 now married, 93 unmarried)
Housing units in zip code 61545 with a mortgage: 203 (7 second mortgage, 2 both second mortgage and home equity loan) Median monthly owner costs for units with a mortgage: $1,532 Median monthly owner costs for units without a mortgage: $575
Residents with income below the poverty level in 2022:
This zip code:
13.0%
Whole state:
11.9%
Residents with income below 50% of the poverty level in 2022:
This zip code:
6.4%
Whole state:
5.7%
Median number of rooms in houses and condos:
Here:
5.4
State:
6.4
Median number of rooms in apartments:
Here:
5.6
State:
4.1
Notable locations in this zip code not listed on our city pages
Size of family households: 146 2-persons, 32 3-persons, 19 4-persons, 26 5-persons, 6 6-persons
Size of nonfamily households: 85 1-person, 18 2-persons
139 married couples with children.
60 single-parent households (48 men, 12 women).
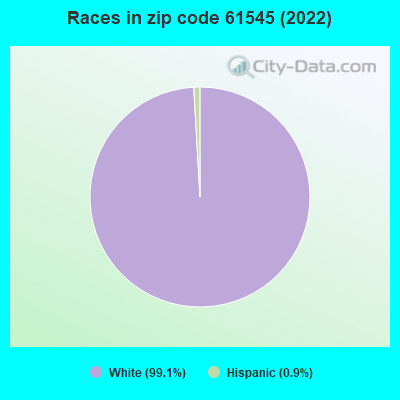
97.9% of residents of 61545 zip code speak English at home.
0.7% of residents speak Spanish at home (100% very well).
0.6% of residents speak other Indo-European language at home (100% not well).
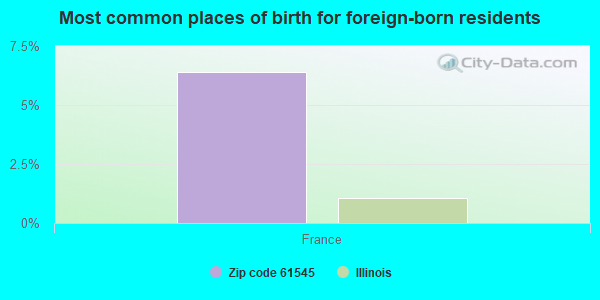
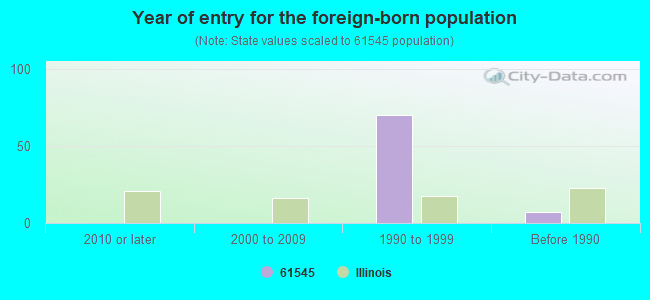
Foreign born population: 77 (10.3%) (0.0% of them are naturalized citizens)
:
10.3%
Whole state:
14.4%
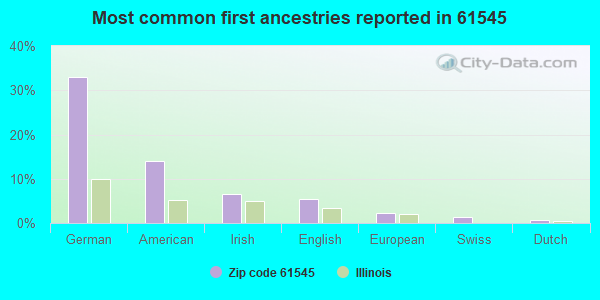
6%France
33%German
14%American
6%Irish
6%English
2%European
1%Swiss
1%Dutch
Year of entry for the foreign-born population
02010 or later
02000 to 2009
701990 to 1999
7Before 1990
Facilities with environmental interests located in this zip code:
ADM GRAIN CO (100 WASHINGTON STREET in LOWPOINT, IL)
STATE MASTER (Illinois EPA Project) - SOLID WASTE PROGRAM, AIR PROGRAM, HAZARDOUS WASTE PROGRAM AIR MINOR (AIRS/AFS) CRITERIA AND HAZARDOUS AIR POLLUTANT INVENTORY (Inventory of air pollution sources) (Resource Conservation and Recovery Act (tracking hazardous waste)) Business SIC classification: GRAIN AND FIELD BEANS Organizations: ARCHER DANIELS (CONTACT/OWNER)
Alternative names: TABOR GRAIN
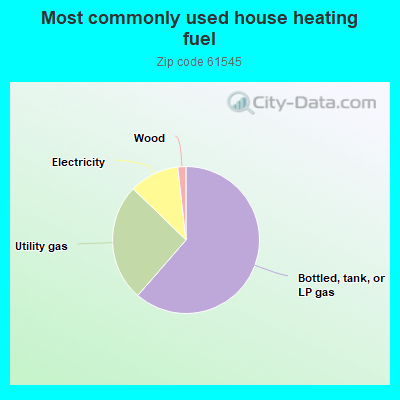
61.7%Bottled, tank, or LP gas
26.0%Utility gas
11.0%Electricity
1.8%Wood
Population in 1990: 1,247.
Place of birth for U.S.-born residents:
This state: 600
Midwest: 33
South: 16
West: 22
60% of the 61545 zip code residents lived in the same house 5 years ago. Out of people who lived in different houses, 40% lived in this county. Out of people who lived in different counties, 50% lived in Illinois.
96% of the 61545 zip code residents lived in the same house 1 year ago. Out of people who lived in different houses, 14% moved from this county. Out of people who lived in different houses, 90% moved from different county within same state.
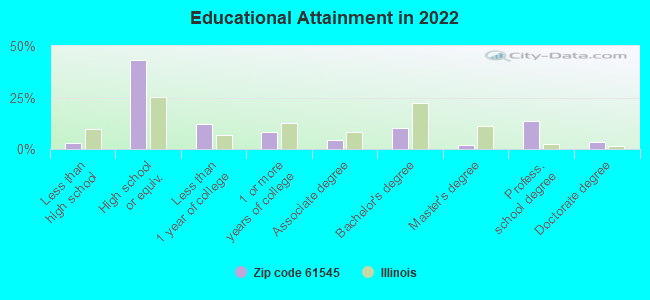
Private vs. public school enrollment:
Students in private schools in grades 1 to 8 (elementary and middle school): 7
Here:
7.2%
Illinois:
13.3%
Students in private schools in grades 9 to 12 (high school): 17
Here:
30.4%
Illinois:
9.9%
Students in private undergraduate colleges:
Here:
0.0%
Illinois:
27.4%
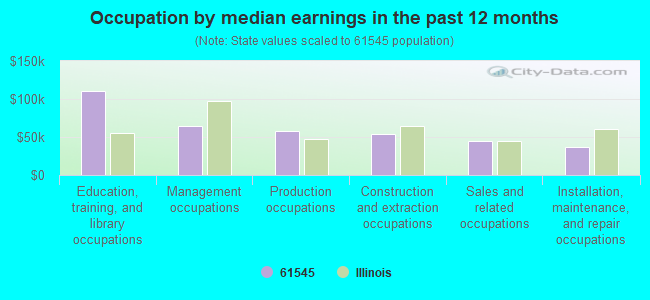
Occupation by median earnings in the past 12 months ($)
110,736Education, training, and library occupations
64,475Management occupations
58,316Production occupations
54,187Construction and extraction occupations
44,495Sales and related occupations
37,276Installation, maintenance, and repair occupations
Top industries in this zip code by the number of employees in 2005:
Accommodation and Food Services: Full-Service Restaurants (10-19 employees: 1 establishment)
Professional, Scientific, and Technical Services: Veterinary Services (5-9: 1)
Construction: Siding Contractors (5-9: 1)
Construction: Site Preparation Contractors (5-9: 1)
Other Services (except Public Administration): Religious Organizations (1-4: 2)
Construction: Residential Remodelers (1-4: 1)
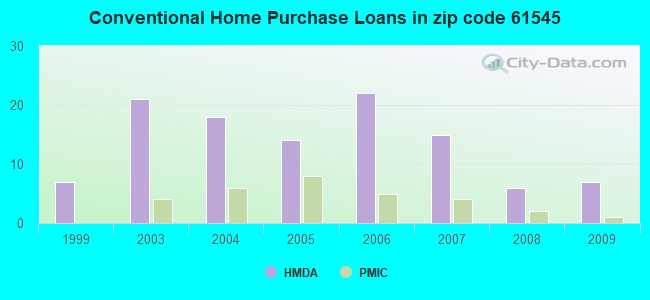
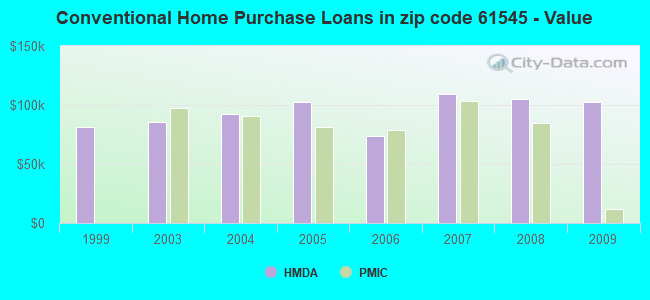
Home Mortgage Disclosure Act Aggregated Statistics For Year 2009 (Based on 4 partial tracts)
A) FHA, FSA/RHS & VA Home Purchase Loans
B) Conventional Home Purchase Loans
C) Refinancings
D) Home Improvement Loans
F) Non-occupant Loans on < 5 Family Dwellings (A B C & D)
Number
Average Value
Number
Average Value
Number
Average Value
Number
Average Value
Number
Average Value
LOANS ORIGINATED
5
$102,890
7
$102,247
42
$108,688
4
$24,125
2
$89,985
APPLICATIONS APPROVED, NOT ACCEPTED
0
$0
0
$0
4
$115,145
1
$1,180
0
$0
APPLICATIONS DENIED
1
$172,860
1
$5,920
11
$126,096
3
$23,287
1
$20,720
APPLICATIONS WITHDRAWN
0
$0
1
$95,900
5
$105,968
0
$0
0
$0
FILES CLOSED FOR INCOMPLETENESS
0
$0
0
$0
1
$163,390
0
$0
0
$0
Aggregated Statistics For Year 2008 (Based on 4 partial tracts)
A) FHA, FSA/RHS & VA Home Purchase Loans
B) Conventional Home Purchase Loans
C) Refinancings
D) Home Improvement Loans
F) Non-occupant Loans on < 5 Family Dwellings (A B C & D)
Number
Average Value
Number
Average Value
Number
Average Value
Number
Average Value
Number
Average Value
LOANS ORIGINATED
3
$74,000
6
$104,783
28
$131,952
5
$73,172
5
$106,086
APPLICATIONS APPROVED, NOT ACCEPTED
1
$55,060
0
$0
2
$95,610
1
$76,960
0
$0
APPLICATIONS DENIED
0
$0
1
$57,420
10
$108,395
1
$98,270
0
$0
APPLICATIONS WITHDRAWN
1
$60,380
0
$0
4
$91,465
1
$82,880
0
$0
FILES CLOSED FOR INCOMPLETENESS
0
$0
0
$0
1
$132,020
0
$0
0
$0
Aggregated Statistics For Year 2007 (Based on 4 partial tracts)
A) FHA, FSA/RHS & VA Home Purchase Loans
B) Conventional Home Purchase Loans
C) Refinancings
D) Home Improvement Loans
F) Non-occupant Loans on < 5 Family Dwellings (A B C & D)
Number
Average Value
Number
Average Value
Number
Average Value
Number
Average Value
Number
Average Value
LOANS ORIGINATED
2
$78,145
15
$109,086
30
$111,079
7
$72,140
5
$60,858
APPLICATIONS APPROVED, NOT ACCEPTED
0
$0
1
$103,600
4
$66,452
1
$24,860
1
$20,720
APPLICATIONS DENIED
0
$0
5
$110,822
9
$93,404
6
$62,950
4
$71,485
APPLICATIONS WITHDRAWN
0
$0
1
$71,040
5
$79,446
1
$37,300
1
$26,050
FILES CLOSED FOR INCOMPLETENESS
0
$0
1
$134,380
1
$271,140
1
$50,320
0
$0
Aggregated Statistics For Year 2006 (Based on 4 partial tracts)
A) FHA, FSA/RHS & VA Home Purchase Loans
B) Conventional Home Purchase Loans
C) Refinancings
D) Home Improvement Loans
F) Non-occupant Loans on < 5 Family Dwellings (A B C & D)
Number
Average Value
Number
Average Value
Number
Average Value
Number
Average Value
Number
Average Value
LOANS ORIGINATED
2
$95,015
22
$73,596
24
$95,583
3
$16,180
5
$67,488
APPLICATIONS APPROVED, NOT ACCEPTED
0
$0
4
$64,380
1
$116,620
0
$0
1
$34,340
APPLICATIONS DENIED
0
$0
8
$69,264
14
$114,171
7
$32,814
2
$85,250
APPLICATIONS WITHDRAWN
0
$0
4
$113,515
11
$113,180
2
$76,960
1
$14,210
FILES CLOSED FOR INCOMPLETENESS
0
$0
0
$0
1
$121,360
0
$0
0
$0
Aggregated Statistics For Year 2005 (Based on 4 partial tracts)
A) FHA, FSA/RHS & VA Home Purchase Loans
B) Conventional Home Purchase Loans
C) Refinancings
D) Home Improvement Loans
F) Non-occupant Loans on < 5 Family Dwellings (A B C & D)
G) Loans On Manufactured Home Dwelling (A B C & D)
Number
Average Value
Number
Average Value
Number
Average Value
Number
Average Value
Number
Average Value
Number
Average Value
LOANS ORIGINATED
3
$65,317
14
$102,754
27
$93,076
5
$43,572
2
$172,570
0
$0
APPLICATIONS APPROVED, NOT ACCEPTED
0
$0
2
$127,280
4
$87,765
0
$0
0
$0
0
$0
APPLICATIONS DENIED
0
$0
5
$53,516
14
$113,072
4
$17,465
0
$0
1
$12,430
APPLICATIONS WITHDRAWN
0
$0
1
$47,360
10
$115,381
2
$170,790
0
$0
0
$0
FILES CLOSED FOR INCOMPLETENESS
0
$0
1
$35,520
2
$142,970
0
$0
0
$0
0
$0
Aggregated Statistics For Year 2004 (Based on 4 partial tracts)
A) FHA, FSA/RHS & VA Home Purchase Loans
B) Conventional Home Purchase Loans
C) Refinancings
D) Home Improvement Loans
F) Non-occupant Loans on < 5 Family Dwellings (A B C & D)
G) Loans On Manufactured Home Dwelling (A B C & D)
Number
Average Value
Number
Average Value
Number
Average Value
Number
Average Value
Number
Average Value
Number
Average Value
LOANS ORIGINATED
0
$0
18
$92,385
30
$100,009
6
$27,923
2
$36,110
0
$0
APPLICATIONS APPROVED, NOT ACCEPTED
0
$0
1
$10,660
2
$104,490
1
$58,020
0
$0
1
$10,660
APPLICATIONS DENIED
1
$103,600
3
$61,963
11
$105,161
3
$20,917
1
$44,400
0
$0
APPLICATIONS WITHDRAWN
0
$0
2
$67,785
9
$100,377
1
$47,360
0
$0
0
$0
FILES CLOSED FOR INCOMPLETENESS
0
$0
1
$81,700
0
$0
0
$0
0
$0
0
$0
Aggregated Statistics For Year 2003 (Based on 4 partial tracts)
A) FHA, FSA/RHS & VA Home Purchase Loans
B) Conventional Home Purchase Loans
C) Refinancings
D) Home Improvement Loans
F) Non-occupant Loans on < 5 Family Dwellings (A B C & D)
Number
Average Value
Number
Average Value
Number
Average Value
Number
Average Value
Number
Average Value
LOANS ORIGINATED
4
$58,312
21
$85,304
63
$96,289
4
$8,880
6
$52,885
APPLICATIONS APPROVED, NOT ACCEPTED
0
$0
1
$96,500
3
$59,793
1
$11,840
0
$0
APPLICATIONS DENIED
1
$75,180
4
$44,252
17
$63,588
2
$17,170
1
$69,260
APPLICATIONS WITHDRAWN
1
$75,180
1
$111,890
5
$109,284
0
$0
0
$0
FILES CLOSED FOR INCOMPLETENESS
0
$0
1
$52,100
0
$0
0
$0
0
$0
Aggregated Statistics For Year 1999 (Based on 2 partial tracts)
A) FHA, FSA/RHS & VA Home Purchase Loans
B) Conventional Home Purchase Loans
C) Refinancings
D) Home Improvement Loans
F) Non-occupant Loans on < 5 Family Dwellings (A B C & D)


 Nearest zip codes: 61570, 61548, 61540, 61562, 61541, 61561.