Estimated zip code population in 2022: 567 Zip code population in 2010: 867 Zip code population in 2000: 944
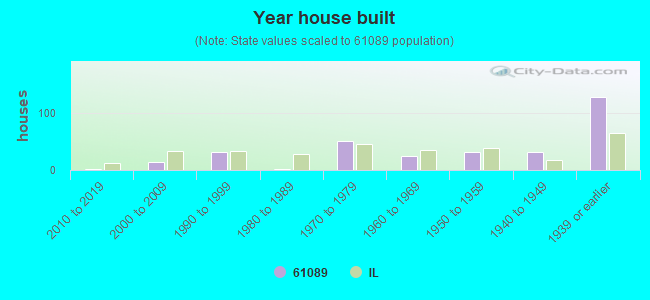
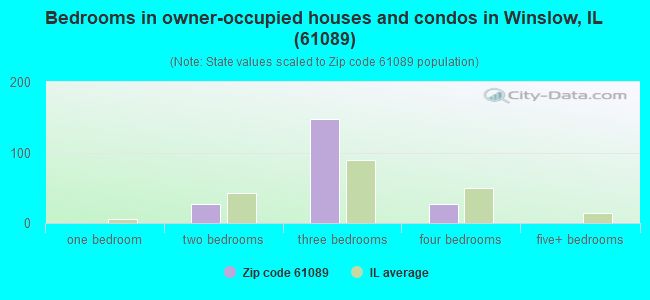
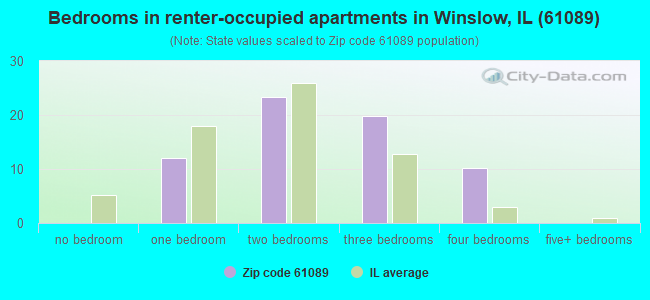
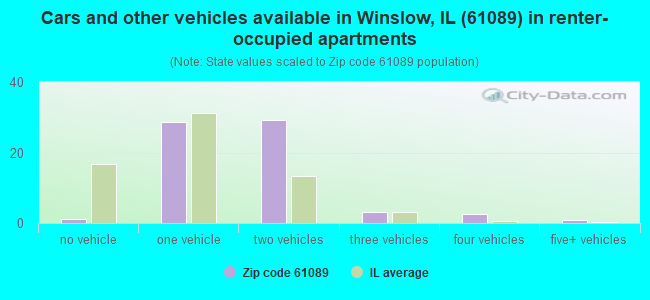
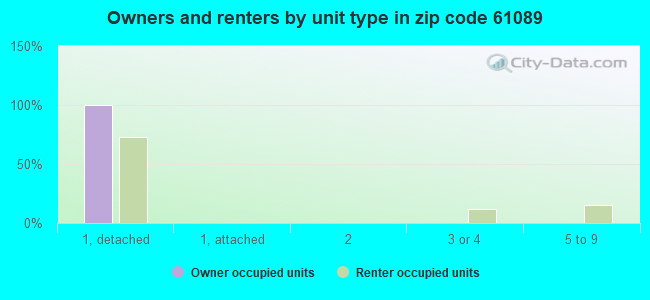
Houses and condos: 323 Renter-occupied apartments: 67
% of renters here:
25%
State:
33%
March 2022 cost of living index in zip code 61089: 84.4 (less than average, U.S. average is 100)
Land area: 42.9 sq. mi. Water area: 0.0 sq. mi.
Population density: 13 people per square mile
(very low).
OSM Map
General Map
Google Map
MSN Map
OSM Map
General Map
Google Map
MSN Map
OSM Map
General Map
Google Map
MSN Map
OSM Map
General Map
Google Map
MSN Map
Please wait while loading the map...
Real estate property taxes paid for housing units in 2022:
This zip code:
2.1% ($2,709)
Illinois:
2.0% ($4,912)
Median real estate property taxes paid for housing units with mortgages in 2022: $2,604 (1.6%) Median real estate property taxes paid for housing units with no mortgage in 2022: $3,107 (2.8%)
Business Search- 14 Million verified businesses
Males: 284
(50.1%)
Females: 282
(49.9%)
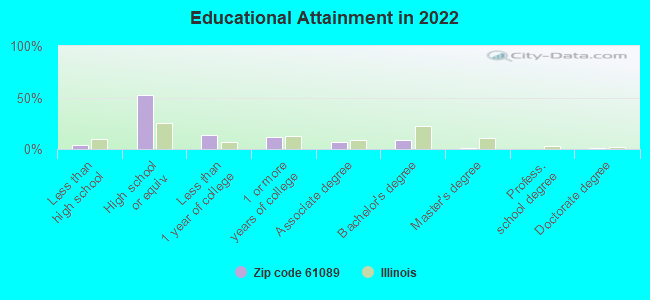
For population 25 years and over in 61089:
High school or higher: 94.3%
Bachelor's degree or higher: 11.7%
Graduate or professional degree: 2.7%
Mean travel time to work (commute): 21.9 minutes
For population 15 years and over in 61089:
Never married: 31.5%
Now married: 55.1%
Separated: 0.0%
Widowed: 6.5%
Divorced: 6.9%
Zip code 61089 compared to state average:
Median house value below state average.
Unemployed percentage significantly below state average.
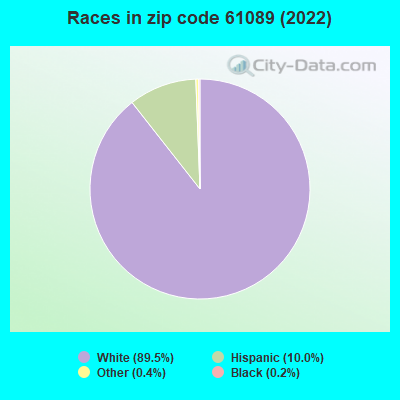
Black race population percentage significantly below state average.
Hispanic race population percentage below state average.
Median age significantly above state average.
Foreign-born population percentage below state average.
Length of stay since moving in significantly above state average.
Percentage of population with a bachelor's degree or higher significantly below state average.
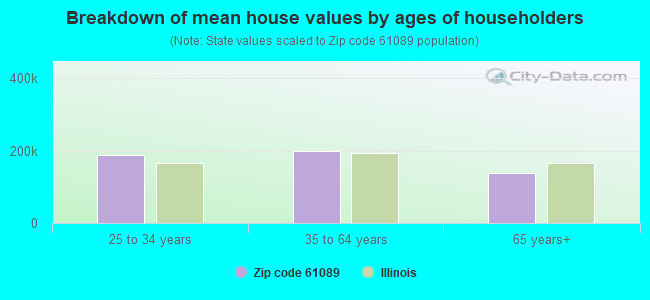
Estimated median house/condo value in 2022: $130,588
61089:
$130,588
Illinois:
$251,600
According to our research of Illinois and other state lists, there was 1 registered sex offender living in 61089 zip code as of July 03, 2024. The ratio of all residents to sex offenders in zip code 61089 is 732 to 1. The ratio of registered sex offenders to all residents in this zip code is near the state average.
Median resident age:
This zip code:
50.5 years
Illinois median age:
39.1 years
Average household size:
This zip code:
2.1 people
Illinois:
2.4 people
Averages for the 2020 tax year for zip code 61089, filed in 2021:
Average Adjusted Gross Income (AGI) in 2020: $63,703 (Individual Income Tax Returns)
Here:
$63,703
State:
$82,626
Salary/wage: $46,044 (reported on 86.5% of returns)
Here:
$46,044
State:
$66,640
(% of AGI for various income ranges: 1420.0% for AGIs below $25k, 3512.5% for AGIs $25k-50k, 7200.0% for AGIs $50k-75k, 9346.7% for AGIs $75k-100k, 17486.7% for AGIs $100k-200k)
Taxable interest for individuals: $2,023 (reported on 35.1% of returns)
This zip code:
$2,023
Illinois:
$2,376
(% of AGI for various income ranges: 20.0% for AGIs below $25k, 23.8% for AGIs $25k-50k, 37.5% for AGIs $50k-75k, 73.3% for AGIs $75k-100k, 643.3% for AGIs $100k-200k)
Ordinary dividends: $3,243 (reported on 18.9% of returns)
Here:
$3,243
State:
$9,061
(% of AGI for various income ranges: 22.9% for AGIs below $25k, 47.5% for AGIs $50k-75k, 640.0% for AGIs $100k-200k)
Net capital gain/loss in AGI: +$10,667 (reported on 16.2% of returns)
Here:
+$10,667
State:
+$31,684
(% of AGI for various income ranges: 133.8% for AGIs $25k-50k, 1776.7% for AGIs $100k-200k)
Profit/loss from business: +$6,300 (reported on 13.5% of returns)
Here:
+$6,300
State:
+$12,175
(% of AGI for various income ranges: 75.7% for AGIs below $25k, 655.0% for AGIs $50k-75k)
Taxable individual retirement arrangement distribution: $4,667 (reported on 8.1% of returns)
61089:
$4,667
Illinois:
$21,613
(% of AGI for various income ranges: 200.0% for AGIs below $25k)
Earned income credit: $2,560 (reported on 13.5% of returns)
Here:
$2,560
State:
$2,311
(% of AGI for various income ranges: 84.3% for AGIs below $25k, 86.2% for AGIs $25k-50k)
Percentage of individuals using paid preparers for their 2020 taxes: 100.0%
Here:
100%
State:
93%
(% for various income ranges: 100.0% for AGIs below $25k, 100.0% for AGIs $25k-50k, 100.0% for AGIs $50k-75k, 100.0% for AGIs $75k-100k, 100.0% for AGIs $100k-200k)
Averages for the 2012 tax year for zip code 61089, filed in 2013:
Average Adjusted Gross Income (AGI) in 2012: $46,118 (Individual Income Tax Returns)
Here:
$46,118
State:
$68,058
Salary/wage: $37,132 (reported on 85.0% of returns)
Here:
$37,132
State:
$55,396
(% of AGI for various income ranges: 80.0% for AGIs below $25k, 72.6% for AGIs $25k-50k, 77.8% for AGIs $50k-75k, 70.8% for AGIs $75k-100k, 52.1% for AGIs $100k-200k)
Taxable interest for individuals: $1,087 (reported on 37.5% of returns)
This zip code:
$1,087
Illinois:
$1,969
(% of AGI for various income ranges: 1.2% for AGIs below $25k, 1.8% for AGIs $25k-50k, 1.1% for AGIs $50k-75k, 0.6% for AGIs $100k-200k)
Ordinary dividends: $3,725 (reported on 20.0% of returns)
Here:
$3,725
State:
$7,786
(% of AGI for various income ranges: 0.5% for AGIs below $25k, 0.5% for AGIs $25k-50k, 7.2% for AGIs $75k-100k)
Net capital gain/loss in AGI: +$6,820 (reported on 12.5% of returns)
Here:
+$6,820
State:
+$22,183
Profit/loss from business: +$6,240 (reported on 12.5% of returns)
Here:
+$6,240
State:
+$12,903
Taxable individual retirement arrangement distribution: $5,300 (reported on 10.0% of returns)
61089:
$5,300
Illinois:
$17,929
Total itemized deductions: $17,167 (21% of AGI, reported on 22.5% of returns)
Here:
$17,167
State:
$26,433
Here:
21.4% of AGI
State:
19.2% of AGI
(% of AGI for various income ranges: 9.8% for AGIs $25k-50k, 17.6% for AGIs $50k-75k, 9.0% for AGIs $100k-200k)
Charity contributions: $3,333 (reported on 15.0% of returns)
Here:
$3,333
State:
$4,525
(% of AGI for various income ranges: 2.8% for AGIs $50k-75k, 2.1% for AGIs $75k-100k)
Taxes paid: $6,944 (reported on 22.5% of returns)
61089:
$6,944
State:
$11,968
(% of AGI for various income ranges: 3.0% for AGIs $25k-50k, 6.0% for AGIs $50k-75k, 5.1% for AGIs $100k-200k)
Earned income credit: $2,043 (reported on 17.5% of returns)
Here:
$2,043
State:
$2,349
(% of AGI for various income ranges: 6.1% for AGIs below $25k, 0.9% for AGIs $25k-50k)
Percentage of individuals using paid preparers for their 2012 taxes: 80.0%
Here:
80%
State:
57%
(% for various income ranges: 81.2% for AGIs below $25k, 77.8% for AGIs $25k-50k, 85.7% for AGIs $50k-75k, 60.0% for AGIs $75k-100k, 100.0% for AGIs $100k-200k)
Averages for the 2004 tax year for zip code 61089, filed in 2005:
Average Adjusted Gross Income (AGI) in 2004: $30,606 (Individual Income Tax Returns)
Here:
$30,606
State:
$54,625
Salary/wage: $30,063 (reported on 84.3% of returns)
Here:
$30,063
State:
$46,811
(% of AGI for various income ranges: 74.4% for AGIs $10k-25k, 78.7% for AGIs $25k-50k, 88.8% for AGIs $50k-75k, 76.6% for AGIs $75k-100k, 44.4% for AGIs over 100k)
Taxable interest for individuals: $1,860 (reported on 44.9% of returns)
This zip code:
$1,860
Illinois:
$2,101
(% of AGI for various income ranges: 3.1% for AGIs $10k-25k, 3.5% for AGIs $25k-50k, 0.6% for AGIs $50k-75k, 1.5% for AGIs $75k-100k, 3.1% for AGIs over 100k)
Taxable dividends: $697 (reported on 18.4% of returns)
Here:
$697
State:
$4,306
(% of AGI for various income ranges: 0.4% for AGIs $10k-25k, 0.6% for AGIs $25k-50k, 0.3% for AGIs $50k-75k, 0.8% for AGIs $75k-100k)
Net capital gain/loss: +$10,970 (reported on 16.2% of returns)
Here:
+$10,970
State:
+$17,321
(% of AGI for various income ranges: 0.5% for AGIs $10k-25k, 3.1% for AGIs $25k-50k, 3.0% for AGIs $50k-75k, 23.5% for AGIs over 100k)
Profit/loss from business: +$1,755 (reported on 12.8% of returns)
Here:
+$1,755
State:
+$11,771
Total itemized deductions: $14,651 (24% of AGI, reported on 20.8% of returns)
Here:
$14,651
State:
$20,239
Here:
24.0% of AGI
State:
19.5% of AGI
(% of AGI for various income ranges: 12.9% for AGIs $25k-50k, 11.2% for AGIs $50k-75k, 8.0% for AGIs $75k-100k, 9.9% for AGIs over 100k)
Charity contributions deductions: $2,271 (3% of AGI, reported on 16.9% of returns)
Here:
$2,271
State:
$3,719
Here:
3.5% of AGI
State:
3.4% of AGI
Total tax: $3,739 (reported on 71.3% of returns)
61089:
$3,739
State:
$9,882
(% of AGI for various income ranges: 3.7% for AGIs $10k-25k, 6.0% for AGIs $25k-50k, 6.9% for AGIs $50k-75k, 11.4% for AGIs $75k-100k, 15.2% for AGIs over 100k)
Earned income credit: $1,953 (reported on 15.5% of returns)
Here:
$1,953
State:
$1,788
Percentage of individuals using paid preparers for their 2004 taxes: 76.1%
Here:
76%
State:
61%
(% for various income ranges: 70.9% for AGIs below $10k, 75.7% for AGIs $10k-25k, 79.4% for AGIs $25k-50k, 79.4% for AGIs $50k-75k, 68.2% for AGIs $75k-100k, 92.9% for AGIs over 100k)
Household received Food Stamps/SNAP in the past 12 months: 25 Household did not receive Food Stamps/SNAP in the past 12 months: 242
Women who had a birth in the past 12 months: 11 (0 now married, 11 unmarried) Women who did not have a birth in the past 12 months: 96 (40 now married, 55 unmarried)
Housing units in zip code 61089 with a mortgage: 114 (15 second mortgage, 14 both second mortgage and home equity loan) Houses without a mortgage: 1
Median monthly owner costs for units with a mortgage: $1,266 Median monthly owner costs for units without a mortgage: $566
Residents with income below the poverty level in 2022:
This zip code:
13.9%
Whole state:
11.9%
Residents with income below 50% of the poverty level in 2022:
This zip code:
4.9%
Whole state:
5.7%
Median number of rooms in houses and condos:
Here:
6.8
State:
6.4
Median number of rooms in apartments:
Here:
5.3
State:
4.1
Notable locations in this zip code not listed on our city pages
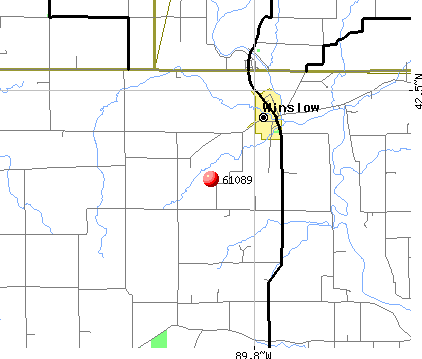
Notable locations in zip code 61089: Brewster Public Access (A), Balduaf Beef Farm (B), Winslow Volunteer Fire Department (C). Display/hide their locations on the map
Cemeteries: Mount Pleasant Cemetery (1), Christian Hollow Cemetery (2), Winslow Cemetery (3), Basswood Cemetery (4). Display/hide their locations on the map
Size of family households: 132 2-persons, 20 3-persons, 19 4-persons, 7 5-persons, 1 6-persons
Size of nonfamily households: 55 1-person, 35 2-persons
39 married couples with children.
46 single-parent households (33 men, 13 women).
93.5% of residents of 61089 zip code speak English at home.
2.5% of residents speak Spanish at home (23% very well, 31% well, 38% not well, 8% not at all).
4.0% of residents speak other Indo-European language at home (100% very well).
0.2% of residents speak Asian or Pacific Island language at home (100% very well).
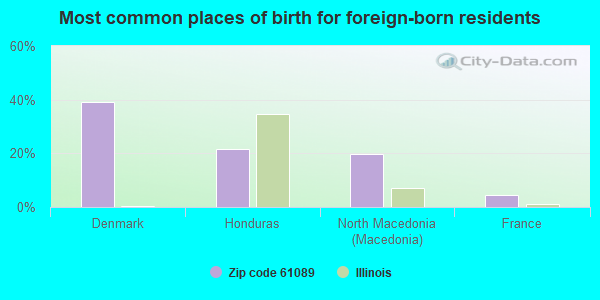
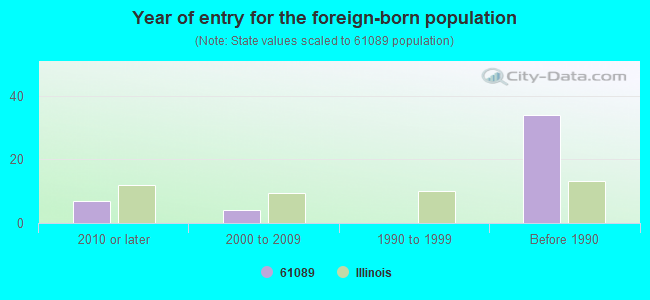
Foreign born population: 46 (8.2%) (74.1% of them are naturalized citizens)
This zip code:
8.2%
Whole state:
14.4%
39%Denmark
22%Honduras
20%North Macedonia (Macedonia)
4%France
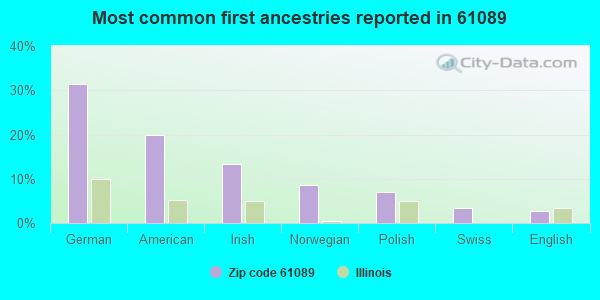
31%German
20%American
13%Irish
9%Norwegian
7%Polish
3%Swiss
3%English
Year of entry for the foreign-born population
72010 or later
42000 to 2009
01990 to 1999
34Before 1990
Facilities with environmental interests located in this zip code:
MITEK GROUP (1 MITEK PLAZA in WINSLOW, IL)
STATE MASTER (Illinois EPA Project) - SOLID WASTE PROGRAM, HAZARDOUS WASTE PROGRAM (Resource Conservation and Recovery Act (tracking hazardous waste))
Housing units lacking complete plumbing facilities: 1.0% Housing units lacking complete kitchen facilities: 1.5%
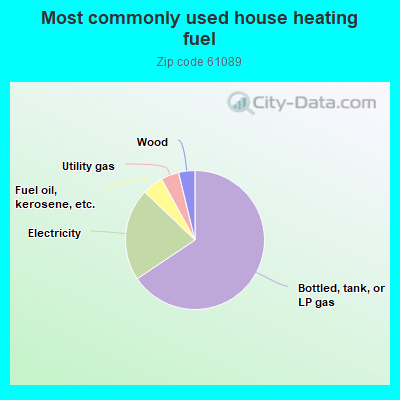
65.8%Bottled, tank, or LP gas
21.6%Electricity
4.9%Fuel oil, kerosene, etc.
4.2%Utility gas
3.8%Wood
Population in 1990: 887. Population change in the 1990s: +57 (+6.4%).
Place of birth for U.S.-born residents:
This state: 271
Northeast: 2
Midwest: 221
South: 21
West: 4
58% of the 61089 zip code residents lived in the same house 5 years ago. Out of people who lived in different houses, 49% lived in this county. Out of people who lived in different counties, 50% lived in Illinois.
92% of the 61089 zip code residents lived in the same house 1 year ago. Out of people who lived in different houses, 24% moved from this county. Out of people who lived in different houses, 52% moved from different county within same state. Out of people who lived in different houses, 15% moved from different state. Out of people who lived in different houses, 9% moved from abroad.
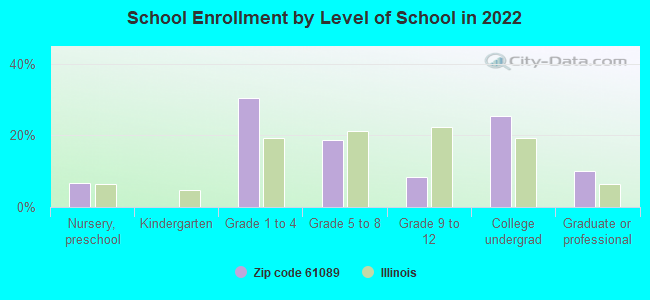
Private vs. public school enrollment:
Students in private schools in grades 1 to 8 (elementary and middle school):
Here:
0.0%
Illinois:
13.3%
Students in private schools in grades 9 to 12 (high school):
Here:
0.0%
Illinois:
9.9%
Students in private undergraduate colleges: 3
Here:
23.9%
Illinois:
27.4%
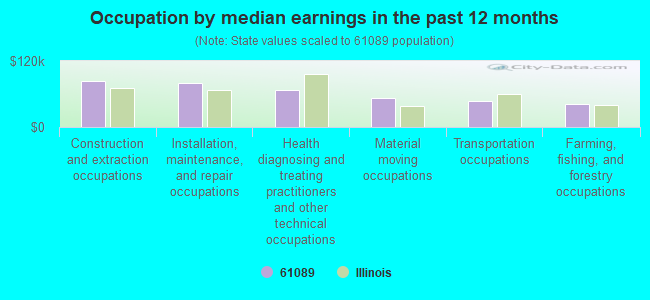
Occupation by median earnings in the past 12 months ($)
83,603Construction and extraction occupations
80,710Installation, maintenance, and repair occupations
66,561Health diagnosing and treating practitioners and other technical occupations
52,785Material moving occupations
47,086Transportation occupations
42,468Farming, fishing, and forestry occupations
Top industries in this zip code by the number of employees in 2005:
Finance and Insurance: Commercial Banking (5-9 employees: 1 establishment)
Finance and Insurance: Insurance Agencies and Brokerages (1-4: 1)
Construction: Drywall and Insulation Contractors (1-4: 1)
Wholesale Trade: Wholesale Trade Agents and Brokers (1-4: 1)
Accommodation and Food Services: Drinking Places (Alcoholic Beverages) (1-4: 1)
Construction: Site Preparation Contractors (1-4: 1)

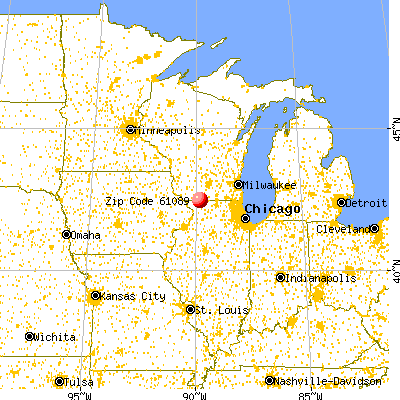


 Nearest zip codes: 53522, 61050, 61048, 61059, 53587, 61027.