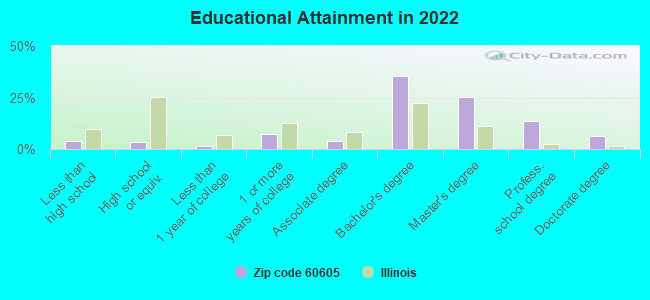
Estimated zip code population in 2022: 33,841 Zip code population in 2010: 24,668 Zip code population in 2000: 12,423
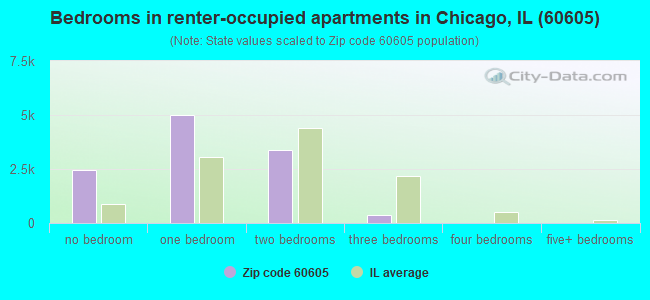
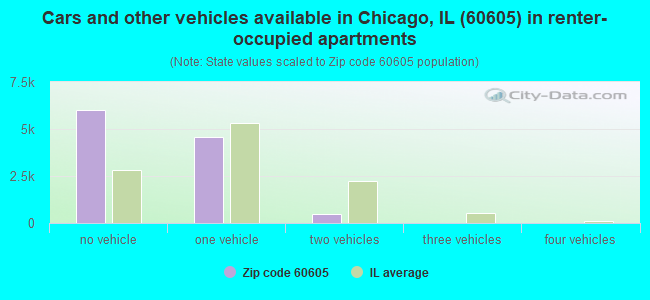
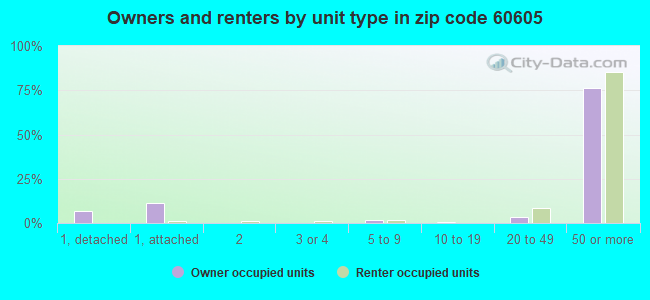
Houses and condos: 20,668 Renter-occupied apartments: 10,834
% of renters here:
57%
State:
33%
March 2022 cost of living index in zip code 60605: 105.4 (more than average, U.S. average is 100)
Land area: 1.2 sq. mi. Water area: 0.8 sq. mi.
Population density: 27,174 people per square mile
(very high).
OSM Map
General Map
Google Map
MSN Map
OSM Map
General Map
Google Map
MSN Map
OSM Map
General Map
Google Map
MSN Map
OSM Map
General Map
Google Map
MSN Map
Please wait while loading the map...
Real estate property taxes paid for housing units in 2022:
This zip code:
1.6% ($8,204)
Illinois:
2.0% ($4,912)
Median real estate property taxes paid for housing units with mortgages in 2022: $8,209 (1.6%) Median real estate property taxes paid for housing units with no mortgage in 2022: $8,080 (1.6%)
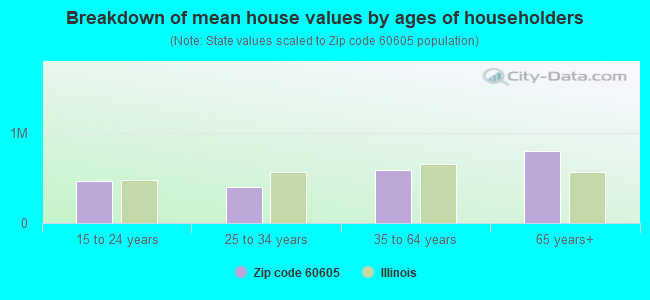
Estimated median house/condo value in 2022: $505,094
60605:
$505,094
Illinois:
$251,600
According to our research of Illinois and other state lists, there were 11 registered sex offenders living in 60605 zip code as of July 03, 2024. The ratio of all residents to sex offenders in zip code 60605 is 2,455 to 1. The ratio of registered sex offenders to all residents in this zip code is much lower than the state average.
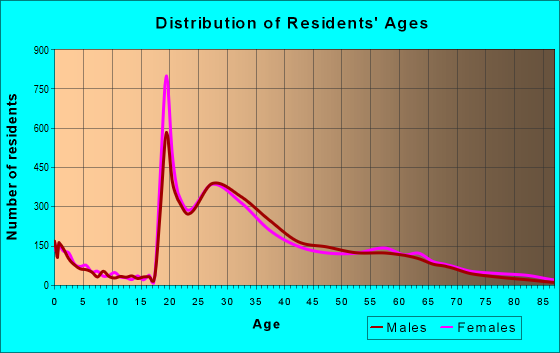
Median resident age:
This zip code:
33.2 years
Illinois median age:
39.1 years
Average household size:
This zip code:
1.6 people
Illinois:
2.4 people
Averages for the 2020 tax year for zip code 60605, filed in 2021:
Average Adjusted Gross Income (AGI) in 2020: $148,117 (Individual Income Tax Returns)
Here:
$148,117
State:
$82,626
Salary/wage: $119,256 (reported on 87.7% of returns)
Here:
$119,256
State:
$66,640
(% of AGI for various income ranges: 1098.9% for AGIs below $25k, 3842.5% for AGIs $25k-50k, 7155.1% for AGIs $50k-75k, 10379.9% for AGIs $75k-100k, 19399.2% for AGIs $100k-200k, 91099.6% for AGIs over 200k)
Taxable interest for individuals: $2,094 (reported on 40.5% of returns)
This zip code:
$2,094
Illinois:
$2,376
(% of AGI for various income ranges: 18.7% for AGIs below $25k, 35.5% for AGIs $25k-50k, 29.7% for AGIs $50k-75k, 38.4% for AGIs $75k-100k, 90.9% for AGIs $100k-200k, 1063.7% for AGIs over 200k)
Ordinary dividends: $7,958 (reported on 38.4% of returns)
Here:
$7,958
State:
$9,061
(% of AGI for various income ranges: 38.7% for AGIs below $25k, 76.7% for AGIs $25k-50k, 71.5% for AGIs $50k-75k, 121.0% for AGIs $75k-100k, 310.9% for AGIs $100k-200k, 4142.1% for AGIs over 200k)
Net capital gain/loss in AGI: +$39,633 (reported on 36.4% of returns)
Here:
+$39,633
State:
+$31,684
(% of AGI for various income ranges: 42.5% for AGIs below $25k, 109.5% for AGIs $25k-50k, 75.6% for AGIs $50k-75k, 155.5% for AGIs $75k-100k, 508.1% for AGIs $100k-200k, 24513.6% for AGIs over 200k)
Profit/loss from business: +$23,899 (reported on 16.2% of returns)
Here:
+$23,899
State:
+$12,175
(% of AGI for various income ranges: 95.9% for AGIs below $25k, 133.6% for AGIs $25k-50k, 171.5% for AGIs $50k-75k, 200.5% for AGIs $75k-100k, 544.2% for AGIs $100k-200k, 4363.5% for AGIs over 200k)
Taxable individual retirement arrangement distribution: $32,123 (reported on 6.6% of returns)
60605:
$32,123
Illinois:
$21,613
(% of AGI for various income ranges: 56.0% for AGIs below $25k, 91.0% for AGIs $25k-50k, 113.0% for AGIs $50k-75k, 188.2% for AGIs $75k-100k, 396.4% for AGIs $100k-200k, 1877.9% for AGIs over 200k)
Self-employed (Keogh) retirement plans: $30,967 (reported on 1.7% of returns)
60605:
$30,967
Illinois:
$30,962
(% of AGI for various income ranges: 16.1% for AGIs $50k-75k, 52.9% for AGIs $100k-200k, 801.9% for AGIs over 200k)
Total itemized deductions: $31,440 (reported on 20.2% of returns)
Here:
$31,440
State:
$34,948
(% of AGI for various income ranges: 84.3% for AGIs below $25k, 215.9% for AGIs $25k-50k, 300.0% for AGIs $50k-75k, 514.9% for AGIs $75k-100k, 1147.5% for AGIs $100k-200k, 6173.5% for AGIs over 200k)
Charity contributions: $11,314 (reported on 16.4% of returns)
Here:
$11,314
State:
$13,122
(% of AGI for various income ranges: 4.9% for AGIs below $25k, 23.6% for AGIs $25k-50k, 44.6% for AGIs $50k-75k, 68.2% for AGIs $75k-100k, 214.5% for AGIs $100k-200k, 2517.3% for AGIs over 200k)
Taxes paid: $9,069 (reported on 20.1% of returns)
60605:
$9,069
State:
$8,563
(% of AGI for various income ranges: 23.7% for AGIs below $25k, 57.4% for AGIs $25k-50k, 107.6% for AGIs $50k-75k, 202.0% for AGIs $75k-100k, 427.1% for AGIs $100k-200k, 1344.4% for AGIs over 200k)
Earned income credit: $997 (reported on 3.8% of returns)
Here:
$997
State:
$2,311
(% of AGI for various income ranges: 29.0% for AGIs below $25k, 10.1% for AGIs $25k-50k)
Percentage of individuals using paid preparers for their 2020 taxes: 93.6%
Here:
94%
State:
93%
(% for various income ranges: 91.0% for AGIs below $25k, 92.3% for AGIs $25k-50k, 95.1% for AGIs $50k-75k, 95.2% for AGIs $75k-100k, 93.6% for AGIs $100k-200k, 94.1% for AGIs over 200k)
Averages for the 2012 tax year for zip code 60605, filed in 2013:
Average Adjusted Gross Income (AGI) in 2012: $117,298 (Individual Income Tax Returns)
Here:
$117,298
State:
$68,058
Salary/wage: $103,524 (reported on 88.7% of returns)
Here:
$103,524
State:
$55,396
(% of AGI for various income ranges: 81.8% for AGIs below $25k, 85.4% for AGIs $25k-50k, 88.0% for AGIs $50k-75k, 88.5% for AGIs $75k-100k, 85.8% for AGIs $100k-200k, 68.8% for AGIs over 200k)
Taxable interest for individuals: $2,527 (reported on 45.4% of returns)
This zip code:
$2,527
Illinois:
$1,969
(% of AGI for various income ranges: 1.1% for AGIs below $25k, 0.6% for AGIs $25k-50k, 0.4% for AGIs $50k-75k, 0.4% for AGIs $75k-100k, 0.4% for AGIs $100k-200k, 1.6% for AGIs over 200k)
Ordinary dividends: $7,203 (reported on 33.9% of returns)
Here:
$7,203
State:
$7,786
(% of AGI for various income ranges: 3.2% for AGIs below $25k, 1.2% for AGIs $25k-50k, 1.1% for AGIs $50k-75k, 1.1% for AGIs $75k-100k, 1.1% for AGIs $100k-200k, 3.1% for AGIs over 200k)
Net capital gain/loss in AGI: +$29,009 (reported on 28.4% of returns)
Here:
+$29,009
State:
+$22,183
(% of AGI for various income ranges: 0.7% for AGIs below $25k, 0.4% for AGIs $25k-50k, 0.3% for AGIs $50k-75k, 0.4% for AGIs $75k-100k, 1.3% for AGIs $100k-200k, 14.2% for AGIs over 200k)
Profit/loss from business: +$19,583 (reported on 16.8% of returns)
Here:
+$19,583
State:
+$12,903
(% of AGI for various income ranges: 11.4% for AGIs below $25k, 5.7% for AGIs $25k-50k, 2.3% for AGIs $50k-75k, 2.6% for AGIs $75k-100k, 2.4% for AGIs $100k-200k, 2.6% for AGIs over 200k)
Taxable individual retirement arrangement distribution: $27,209 (reported on 7.7% of returns)
60605:
$27,209
Illinois:
$17,929
(% of AGI for various income ranges: 2.6% for AGIs below $25k, 2.1% for AGIs $25k-50k, 1.6% for AGIs $50k-75k, 1.3% for AGIs $75k-100k, 2.0% for AGIs $100k-200k, 1.8% for AGIs over 200k)
Self-employment retirement plans: $22,300 (reported on 1.9% of returns)
60605:
$22,300
Illinois:
$24,666
(% of AGI for various income ranges: 0.5% for AGIs $50k-75k, 0.2% for AGIs $100k-200k, 0.6% for AGIs over 200k)
Total itemized deductions: $29,693 (16% of AGI, reported on 50.7% of returns)
Here:
$29,693
State:
$26,433
Here:
16.3% of AGI
State:
19.2% of AGI
(% of AGI for various income ranges: 14.2% for AGIs below $25k, 10.0% for AGIs $25k-50k, 11.0% for AGIs $50k-75k, 13.2% for AGIs $75k-100k, 14.0% for AGIs $100k-200k, 12.7% for AGIs over 200k)
Charity contributions: $5,029 (reported on 41.0% of returns)
Here:
$5,029
State:
$4,525
(% of AGI for various income ranges: 0.8% for AGIs below $25k, 0.9% for AGIs $25k-50k, 1.0% for AGIs $50k-75k, 1.3% for AGIs $75k-100k, 1.5% for AGIs $100k-200k, 2.3% for AGIs over 200k)
Taxes paid: $13,476 (reported on 50.6% of returns)
60605:
$13,476
State:
$11,968
(% of AGI for various income ranges: 4.3% for AGIs below $25k, 3.1% for AGIs $25k-50k, 3.9% for AGIs $50k-75k, 5.0% for AGIs $75k-100k, 6.3% for AGIs $100k-200k, 6.5% for AGIs over 200k)
Earned income credit: $960 (reported on 4.4% of returns)
Here:
$960
State:
$2,349
(% of AGI for various income ranges: 1.8% for AGIs below $25k)
Percentage of individuals using paid preparers for their 2012 taxes: 46.7%
Here:
47%
State:
57%
(% for various income ranges: 40.7% for AGIs below $25k, 40.4% for AGIs $25k-50k, 39.0% for AGIs $50k-75k, 45.2% for AGIs $75k-100k, 50.5% for AGIs $100k-200k, 69.1% for AGIs over 200k)
Averages for the 2004 tax year for zip code 60605, filed in 2005:
Average Adjusted Gross Income (AGI) in 2004: $93,888 (Individual Income Tax Returns)
Here:
$93,888
State:
$54,625
Salary/wage: $79,390 (reported on 88.2% of returns)
Here:
$79,390
State:
$46,811
(% of AGI for various income ranges: 13692.7% for AGIs below $10k, 74.4% for AGIs $10k-25k, 88.1% for AGIs $25k-50k, 88.7% for AGIs $50k-75k, 86.8% for AGIs $75k-100k, 67.2% for AGIs over 100k)
Taxable interest for individuals: $1,842 (reported on 58.1% of returns)
This zip code:
$1,842
Illinois:
$2,101
(% of AGI for various income ranges: 648.8% for AGIs below $10k, 1.9% for AGIs $10k-25k, 0.8% for AGIs $25k-50k, 1.0% for AGIs $50k-75k, 0.6% for AGIs $75k-100k, 1.2% for AGIs over 100k)
Taxable dividends: $4,384 (reported on 38.3% of returns)
Here:
$4,384
State:
$4,306
(% of AGI for various income ranges: 736.6% for AGIs below $10k, 2.5% for AGIs $10k-25k, 1.1% for AGIs $25k-50k, 0.7% for AGIs $50k-75k, 1.4% for AGIs $75k-100k, 2.0% for AGIs over 100k)
Net capital gain/loss: +$30,645 (reported on 32.7% of returns)
Here:
+$30,645
State:
+$17,321
(% of AGI for various income ranges: 1465.9% for AGIs below $10k, 1.0% for AGIs $10k-25k, 0.4% for AGIs $25k-50k, 0.8% for AGIs $50k-75k, 1.9% for AGIs $75k-100k, 15.4% for AGIs over 100k)
Profit/loss from business: +$18,018 (reported on 17.6% of returns)
Here:
+$18,018
State:
+$11,771
(% of AGI for various income ranges: 1119.5% for AGIs below $10k, 7.7% for AGIs $10k-25k, 3.5% for AGIs $25k-50k, 2.5% for AGIs $50k-75k, 2.5% for AGIs $75k-100k, 3.4% for AGIs over 100k)
IRA payment deduction: $2,938 (reported on 2.8% of returns)
60605:
$2,938
Illinois:
$3,087
(% of AGI for various income ranges: 0.4% for AGIs $10k-25k, 0.3% for AGIs $25k-50k, 0.1% for AGIs $50k-75k, 0.1% for AGIs $75k-100k, 0.0% for AGIs over 100k)
Self-employed pension: $18,545 (reported on 2.4% of returns)
Here:
$18,545
Illinois:
$16,965
(% of AGI for various income ranges: 0.2% for AGIs $25k-50k, 0.1% for AGIs $50k-75k, 0.2% for AGIs $75k-100k, 0.6% for AGIs over 100k)
Total itemized deductions: $23,206 (17% of AGI, reported on 55.6% of returns)
Here:
$23,206
State:
$20,239
Here:
16.6% of AGI
State:
19.5% of AGI
(% of AGI for various income ranges: 2002.4% for AGIs below $10k, 15.4% for AGIs $10k-25k, 14.2% for AGIs $25k-50k, 17.4% for AGIs $50k-75k, 17.2% for AGIs $75k-100k, 12.2% for AGIs over 100k)
Charity contributions deductions: $4,213 (3% of AGI, reported on 48.6% of returns)
Here:
$4,213
State:
$3,719
Here:
2.8% of AGI
State:
3.4% of AGI
(% of AGI for various income ranges: 73.2% for AGIs below $10k, 1.7% for AGIs $10k-25k, 1.4% for AGIs $25k-50k, 1.9% for AGIs $50k-75k, 2.1% for AGIs $75k-100k, 2.4% for AGIs over 100k)
Total tax: $19,150 (reported on 87.8% of returns)
60605:
$19,150
State:
$9,882
(% of AGI for various income ranges: 324.4% for AGIs below $10k, 5.3% for AGIs $10k-25k, 9.8% for AGIs $25k-50k, 12.7% for AGIs $50k-75k, 14.0% for AGIs $75k-100k, 20.9% for AGIs over 100k)
Earned income credit: $953 (reported on 4.8% of returns)
Here:
$953
State:
$1,788
Percentage of individuals using paid preparers for their 2004 taxes: 52.0%
Here:
52%
State:
61%
(% for various income ranges: 46.5% for AGIs below $10k, 46.8% for AGIs $10k-25k, 47.9% for AGIs $25k-50k, 50.8% for AGIs $50k-75k, 52.2% for AGIs $75k-100k, 60.6% for AGIs over 100k)
Likely homosexual households (counted as self-reported same-sex unmarried-partner households)
Lesbian couples: 0.2% of all households
Gay men: 0.4% of all households
Household received Food Stamps/SNAP in the past 12 months: 1,092 Household did not receive Food Stamps/SNAP in the past 12 months: 17,840
Women who had a birth in the past 12 months: 409 (407 now married, 0 unmarried) Women who did not have a birth in the past 12 months: 11,116 (2,544 now married, 8,639 unmarried)
Housing units in zip code 60605 with a mortgage: 5,833 (638 second mortgage, 491 both second mortgage and home equity loan) Median monthly owner costs for units with a mortgage: $3,173 Median monthly owner costs for units without a mortgage: $1,480
Residents with income below the poverty level in 2022:
This zip code:
9.8%
Whole state:
11.9%
Residents with income below 50% of the poverty level in 2022:
This zip code:
3.0%
Whole state:
5.7%
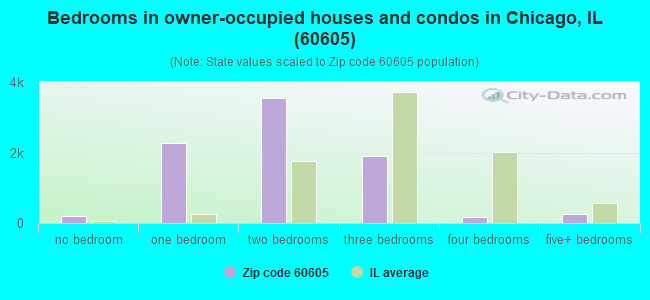
Median number of rooms in houses and condos:
Here:
4.1
State:
6.4
Median number of rooms in apartments:
Here:
2.7
State:
4.1
Notable locations in this zip code not listed on our city pages
Notable locations in zip code 60605: Congress Plaza (A), LaSalle Street Station (B), Eagle Fountain (C), Columbus Memorial (D), Hutchinson Field (E), Dearborn Station (F), Pasteur Monument (G), Burnham Point Yacht Club (H), Printing House Row (I), Soldier Field (J), Burnham Park Yacht Club (K), Merle Reskin Theatre (L), Natural History Museum (M), Terminals Building (N), Thirty-three East Congress Building (O), Thom Building (P), Traders Building (Q), Adler Planetarium (R), Blackstone Theatre (S), Brock and Rankin Building (T). Display/hide their locations on the map
Churches in zip code 60605 include: Christ Temple United Pentecostal Church (A), Garden Mission (B), Grace Episcopal Chapel (C), Old Saint Marys Paulist Church (D), First Church of Christ Scientist (E), Gospel Way Bible Church (F). Display/hide their locations on the map
Parks in zip code 60605 include: Lincoln Memorial (1), Northerly Island Park (2), Logan Monument (3), Buckingham Fountain (4), Dearborn Park (5), Northerly Island Park (6), Roosevelt Park (7), Park 479 (8). Display/hide their locations on the map
In group quarters: 3,012 (-1 institutionalized population)
Size of family households: 3,468 2-persons, 1,553 3-persons, 583 4-persons, 147 5-persons, 9 6-persons
Size of nonfamily households: 10,886 1-person, 2,530 2-persons, 294 3-persons
2,216 married couples with children.
542 single-parent households (45 men, 497 women).
74.2% of residents of 60605 zip code speak English at home.
6.7% of residents speak Spanish at home (87% very well, 10% well, 3% not well).
9.3% of residents speak other Indo-European language at home (92% very well, 6% well, 2% not well).
7.6% of residents speak Asian or Pacific Island language at home (73% very well, 19% well, 7% not well, 1% not at all).
2.1% of residents speak other language at home (90% very well, 10% well).
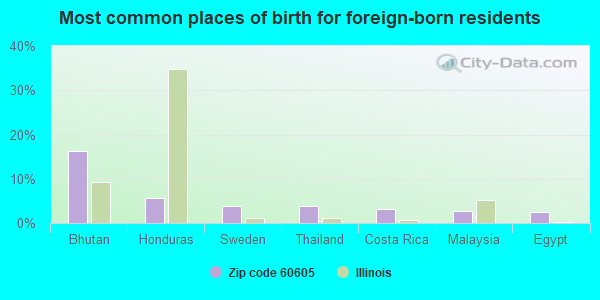
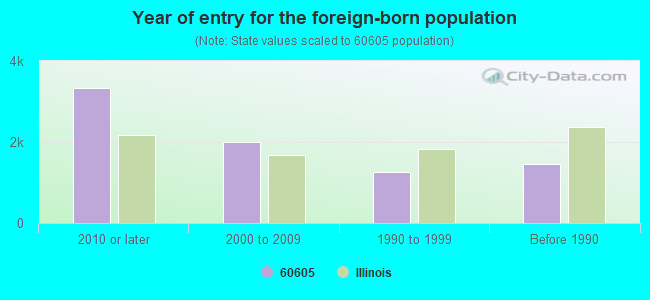
Foreign born population: 7,327 (21.7%) (50.5% of them are naturalized citizens)
Major facilities with environmental interests located in this zip code:
CHICAGO HILTON AND TOWERS (720 S MICHIGAN AVE in CHICAGO, IL)
STATE MASTER (Illinois EPA Project) - SOLID WASTE PROGRAM, AIR PROGRAM, HAZARDOUS WASTE PROGRAM AIR MINOR (AIRS/AFS) - ICIS-05-2004-0702, FORMAL ENFORCEMENT ACTION Small Quantity Generators, between 100 kg and 1000 kg of hazardous waste/month (Resource Conservation and Recovery Act (tracking hazardous waste)) - notification Business SIC classification: HOTELS AND MOTELS Organizations: HILTON HOTELS CORP (CONTACT/OWNER)
CHICAGO PARK DIST (425 E MCFETRIDGE DR in CHICAGO, IL)
STATE MASTER (Illinois EPA Project) - SOLID WASTE PROGRAM, HAZARDOUS WASTE PROGRAM (Integrated Compliance Information System) - ICIS-05-2001-0527, FORMAL ENFORCEMENT ACTION Small Quantity Generators, between 100 kg and 1000 kg of hazardous waste/month (Resource Conservation and Recovery Act (tracking hazardous waste)) - notification TRANSPORTER (Resource Conservation and Recovery Act (tracking hazardous waste)) - notification Alternative names: CHICAGO PARK DIST ADMIN BLDG
AT&T CORP (85 W CONGRESS in CHICAGO, IL)
STATE MASTER (Illinois EPA Project) - AIR PROGRAM, HAZARDOUS WASTE PROGRAM, SOLID WASTE PROGRAM AIR MINOR (AIRS/AFS) CRITERIA AND HAZARDOUS AIR POLLUTANT INVENTORY (Inventory of air pollution sources) (Resource Conservation and Recovery Act (tracking hazardous waste)) Business SIC classification: TELEPHONE COMMUNICATIONS, EXCEPT RADIOTELEPHONE Organizations: AMERICAN TELEPHONE AND TELEGRAPH (CONTACT/OWNER)
Alternative names: AT&T CORP/CHGHILCG-PONS, AT AND T LONG LINES CHICAGO
RIDER DICKERSON INC (626 S CLARK ST in CHICAGO, IL)
STATE MASTER (Illinois EPA Project) - AIR PROGRAM, HAZARDOUS WASTE PROGRAM, SOLID WASTE PROGRAM, AIR MINOR (AIRS/AFS) CRITERIA AND HAZARDOUS AIR POLLUTANT INVENTORY (Inventory of air pollution sources) Small Quantity Generators, between 100 kg and 1000 kg of hazardous waste/month (Resource Conservation and Recovery Act (tracking hazardous waste)) - notification Business SIC classification: COMMERCIAL PRINTING, LITHOGRAPHIC
LIBERTY PHOTO ENGRAVING CO (1112 SOUTH WABASH AVE in CHICAGO, IL)
STATE MASTER (Illinois EPA Project) - SOLID WASTE PROGRAM, HAZARDOUS WASTE PROGRAM, AIR PROGRAM AIR MINOR (AIRS/AFS) Small Quantity Generators, between 100 kg and 1000 kg of hazardous waste/month (Resource Conservation and Recovery Act (tracking hazardous waste)) - notification Business SIC classification: PLATEMAKING AND RELATED SERVICES
REINHARDT LASHORE PRESS INC (1104 S WABASH AVE in CHICAGO, IL)
STATE MASTER (Illinois EPA Project) - SOLID WASTE PROGRAM, HAZARDOUS WASTE PROGRAM Large Quantity Generators, more that 1000 kg of hazardous waste/month (Resource Conservation and Recovery Act (tracking hazardous waste)) - notification Organizations: REINHARDT LA SHORE (CONTACT/OWNER)
Alternative names: REINHARDT LA SHORE PRESS INC
ADLER PLANETARIUM (1300 S LAKE SHORE DR in CHICAGO, IL)
STATE MASTER (Illinois EPA Project) - SOLID WASTE PROGRAM, AIR PROGRAM AIR MINOR (AIRS/AFS) CRITERIA AND HAZARDOUS AIR POLLUTANT INVENTORY (Inventory of air pollution sources) Business SIC classification: MUSEUMS AND ART GALLERIES
AGFA DIVISION MILES INC (720 S MICHIGAN in CHICAGO, IL)
STATE MASTER (Illinois EPA Project) - HAZARDOUS WASTE PROGRAM (Resource Conservation and Recovery Act (tracking hazardous waste)) Organizations: CHICAGO HILTON AND TOWERS (CONTACT/OWNER)
AMERITECH (520 S FEDERAL in CHICAGO, IL)
STATE MASTER (Illinois EPA Project) - SOLID WASTE PROGRAM, HAZARDOUS WASTE PROGRAM, AIR PROGRAM AIR MINOR (AIRS/AFS) CRITERIA AND HAZARDOUS AIR POLLUTANT INVENTORY (Inventory of air pollution sources) Business SIC classification: TELEPHONE COMMUNICATIONS, EXCEPT RADIOTELEPHONE Alternative names: AMERITECH- WABASH CENTRAL OFFICE
PALMER PRINTING INC (739 S CLARK ST in CHICAGO, IL)
STATE MASTER (Illinois EPA Project) - AIR PROGRAM AIR MINOR (AIRS/AFS) CRITERIA AND HAZARDOUS AIR POLLUTANT INVENTORY (Inventory of air pollution sources) Business SIC classification: COMMERCIAL PRINTING
CHICAGO DEPT OF AVIATION-MEIGS (15TH STREET AT LAKE MICHIGAN in CHICAGO, IL)
STATE MASTER (Illinois EPA Project) - National Pollutant Discharge Elimination System Permit National Pollutant Discharge Elimination System NON-MAJOR (Tracking pollutant discharge elimination systems) - permit Organizations: CHICAGO DEPT. OF AVIATION (CONTACT/OWNER)
Alternative names: CHICAGO DEParTment OF AVIATION MEIGS field, MEIGS FIELD?MERRILL C., MEIGS, MERRILL C. FIELD
SAFEGUARD SELF STORAGE INC (1353 WABASH in CHICAGO, IL)
STATE MASTER (Illinois EPA Project) - HAZARDOUS WASTE PROGRAM (Resource Conservation and Recovery Act (tracking hazardous waste))
ROOSEVELT UNIVERSITY (425 S WABASH AVE in CHICAGO, IL)
STATE MASTER (Illinois EPA Project) - AIR PROGRAM AIR MINOR (AIRS/AFS) CRITERIA AND HAZARDOUS AIR POLLUTANT INVENTORY (Inventory of air pollution sources) Business SIC and NAICS classification: COLLEGES, UNIVERSITIES, AND PROFESSIONAL SCHOOLS Alternative names: ROOSEVELT UNIVERSITY PHYSICAL PLANT
Housing units lacking complete plumbing facilities: 0.2% Housing units lacking complete kitchen facilities: 0.3%
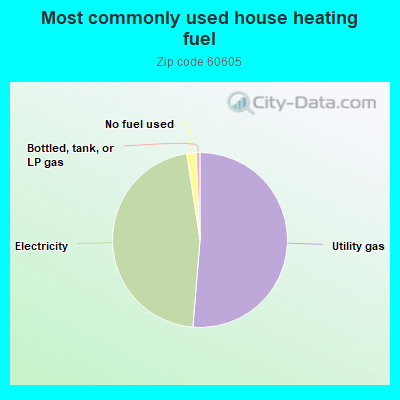
51.1%Utility gas
46.1%Electricity
1.7%No fuel used
0.7%Bottled, tank, or LP gas
Population in 1990: 7,709. Population change in the 1990s: +4,714 (+61.1%).
Place of birth for U.S.-born residents:
This state: 13,822
Northeast: 2,220
Midwest: 5,726
South: 3,083
West: 1,322
35% of the 60605 zip code residents lived in the same house 5 years ago. Out of people who lived in different houses, 60% lived in this county. Out of people who lived in different counties, 50% lived in Illinois.
73% of the 60605 zip code residents lived in the same house 1 year ago. Out of people who lived in different houses, 56% moved from this county. Out of people who lived in different houses, 17% moved from different county within same state. Out of people who lived in different houses, 23% moved from different state. Out of people who lived in different houses, 4% moved from abroad.
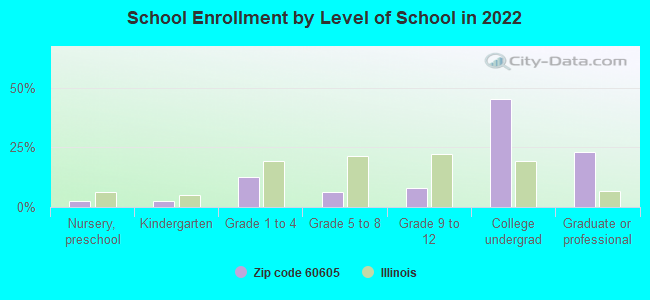
Private vs. public school enrollment:
Students in private schools in grades 1 to 8 (elementary and middle school): 597
Here:
41.3%
Illinois:
13.3%
Students in private schools in grades 9 to 12 (high school): 28
Here:
4.9%
Illinois:
9.9%
Students in private undergraduate colleges: 2,527
Here:
75.1%
Illinois:
27.4%
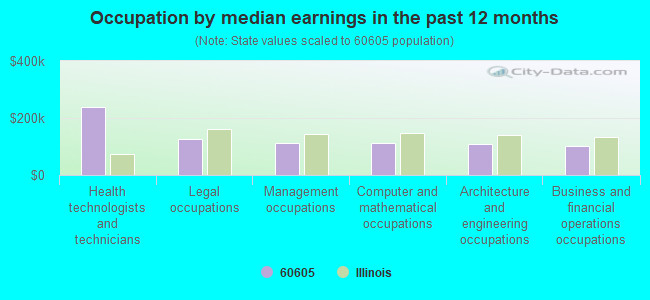
Occupation by median earnings in the past 12 months ($)
237,779Health technologists and technicians
126,490Legal occupations
112,761Management occupations
112,550Computer and mathematical occupations
107,396Architecture and engineering occupations
101,476Business and financial operations occupations
Companies with federal contracts located in this zip code (CHICAGO, IL):
HILTON HOTEL (720 S MICHIGAN AVE) : $208,219 in 18 contractsfrom 2002 to 2006
Contracts for Lodging - Hotel/Motel, Lease or Rental of Facilities -- Conference Space and Facilities, Telephone and/or Communications Services (includes Telegraph, Telex, and Cablevision Services) by Department of Veterans Affairs, EPA, Department of State, Army, and others Signed by year:2000: $0; 2001: $0; 2002: $16,533; 2003: $99,000; 2004: $54,655; 2005: $18,038; 2006: $19,993.
Biggest contracts:
$99,000 with Department of Veterans Affairs for Lodging - Hotel/Motel. Signed on 2003-03-15. Completion date: 2003-03-15.
$18,750 with EPA for Lease or Rental of Facilities -- Conference Space and Facilities. Signed on 2004-10-25. Completion date: 2004-12-02.
$17,113 with Department of State for Lodging - Hotel/Motel. Signed on 2006-04-19. Completion date: 2006-04-20.
$10,772 with Army for Lodging - Hotel/Motel. Signed on 2002-04-23. Completion date: 2002-04-30.
ENVIROCOM INCORPORATED (801 SOUTH PLYMOUTH COURT S; small business)
$21,140 with Army for Public Relations Services(includes writing services, event planning and management, media relations, radio and television analysis, and press services). Signed on 2004-07-14. Completion date: 2004-07-30.
H. M. wITT & CO. (626 S. CLARK; small business) : $4,660 in 3 contractsfrom 2003 to 2004
$2,850 with Public Buildings Service for Maintenance, Repair or Alteration of Real Property -- Office Buildings. Signed on 2004-01-22. Completion date: 2004-02-22.
$1,810, same as above.Signed on 2003-08-15. Completion date: 2003-09-15.
$0, same as above.Signed on 2003-08-15. Completion date: 2003-09-15.
COLUMBIA COLLEGE, (CHICAGO) IN (600 S MICHIGAN AVE)
$4,090 with Army for Educational Services. Signed on 2006-05-24. Completion date: 2006-01-01.
Top industries in this zip code by the number of employees in 2005:
2002 - 2018 National Fire Incident Reporting System (NFIRS) incidents
According to the data from the years 2002 - 2018 the average number of fires per year is 76. The highest number of fires - 182 took place in 2011, and the least - 0 in 2005. The data has a rising trend.
When looking into fire subcategories, the most incidents belonged to: Structure Fires (64.9%), and Outside Fires (15.5%).
Fire incident types reported to NFIRS in Zip Code 60605


 Nearest zip codes: 60603, 60604, 60601, 60602, 60616, 60606.
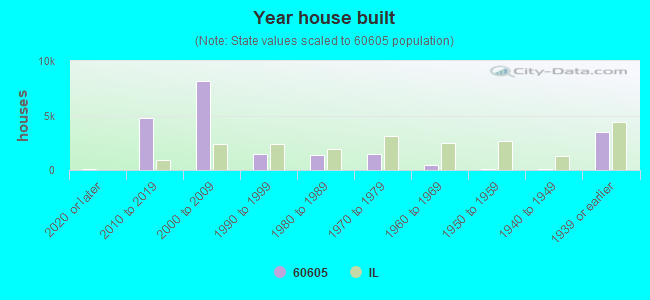


 According to the data from the years 2002 - 2018 the average number of fires per year is 76. The highest number of fires - 182 took place in 2011, and the least - 0 in 2005. The data has a rising trend.
 When looking into fire subcategories, the most incidents belonged to: Structure Fires (64.9%), and Outside Fires (15.5%).