Estimated zip code population in 2022: 652 Zip code population in 2010: 571 Zip code population in 2000: 623
Houses and condos: 308 Renter-occupied apartments: 32
% of renters here:
11%
State:
31%
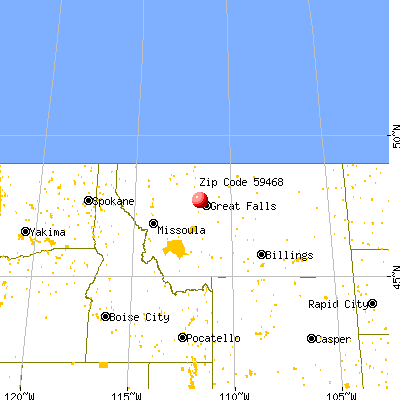
March 2022 cost of living index in zip code 59468: 86.3 (less than average, U.S. average is 100)
Land area: 252.0 sq. mi. Water area: 0.1 sq. mi.
Population density: 3 people per square mile
(very low).
OSM Map
General Map
Google Map
MSN Map
OSM Map
General Map
Google Map
MSN Map
OSM Map
General Map
Google Map
MSN Map
OSM Map
General Map
Google Map
MSN Map
Please wait while loading the map...
Real estate property taxes paid for housing units in 2022:
This zip code:
0.7% ($1,880)
Montana:
0.7% ($2,498)
Median real estate property taxes paid for housing units with mortgages in 2022: $1,962 (0.8%) Median real estate property taxes paid for housing units with no mortgage in 2022: $1,804 (0.7%)
Business Search- 14 Million verified businesses
Males: 338
(51.9%)
Females: 313
(48.1%)
For population 25 years and over in 59468:
High school or higher: 98.0%
Bachelor's degree or higher: 26.7%
Graduate or professional degree: 6.1%
Unemployed: 0.5%
Mean travel time to work (commute): 27.4 minutes
For population 15 years and over in 59468:
Never married: 20.9%
Now married: 65.2%
Separated: 2.2%
Widowed: 9.1%
Divorced: 2.8%
Zip code 59468 compared to state average:
Unemployed percentage significantly below state average.
Black race population percentage significantly below state average.
Hispanic race population percentage significantly below state average.
Foreign-born population percentage significantly below state average.
Renting percentage significantly below state average.
Length of stay since moving in significantly above state average.
Estimated median house/condo value in 2022: $272,433
59468:
$272,433
Montana:
$366,400
Median resident age:
This zip code:
41.4 years
Montana median age:
40.2 years
Average household size:
This zip code:
2.2 people
Montana:
2.4 people
Averages for the 2020 tax year for zip code 59468, filed in 2021:
Average Adjusted Gross Income (AGI) in 2020: $49,500 (Individual Income Tax Returns)
Here:
$49,500
State:
$70,533
Salary/wage: $44,557 (reported on 65.7% of returns)
Here:
$44,557
State:
$52,258
(% of AGI for various income ranges: 1468.0% for AGIs below $25k, 4052.5% for AGIs $25k-50k, 4666.7% for AGIs $50k-75k, 6943.3% for AGIs $75k-100k)
Taxable interest for individuals: $1,309 (reported on 31.4% of returns)
This zip code:
$1,309
Montana:
$1,928
(% of AGI for various income ranges: 46.0% for AGIs below $25k, 353.3% for AGIs $50k-75k)
Ordinary dividends: $1,586 (reported on 20.0% of returns)
Here:
$1,586
State:
$7,554
(% of AGI for various income ranges: 105.0% for AGIs $25k-50k, 230.0% for AGIs $75k-100k)
Net capital gain/loss in AGI: +$6,175 (reported on 22.9% of returns)
Here:
+$6,175
State:
+$26,730
(% of AGI for various income ranges: 58.0% for AGIs below $25k, 586.7% for AGIs $50k-75k)
Profit/loss from business: +$10,400 (reported on 14.3% of returns)
Here:
+$10,400
State:
+$13,757
(% of AGI for various income ranges: 448.0% for AGIs below $25k, 986.7% for AGIs $50k-75k)
Taxable individual retirement arrangement distribution: $7,950 (reported on 5.7% of returns)
59468:
$7,950
Montana:
$19,575
(% of AGI for various income ranges: 318.0% for AGIs below $25k)
Earned income credit: $2,233 (reported on 8.6% of returns)
Here:
$2,233
State:
$2,035
(% of AGI for various income ranges: 134.0% for AGIs below $25k)
Percentage of individuals using paid preparers for their 2020 taxes: 94.3%
Here:
94%
State:
94%
(% for various income ranges: 93.3% for AGIs below $25k, 100.0% for AGIs $25k-50k, 80.0% for AGIs $50k-75k, 100.0% for AGIs $75k-100k, 100.0% for AGIs $100k-200k)
Averages for the 2012 tax year for zip code 59468, filed in 2013:
Average Adjusted Gross Income (AGI) in 2012: $50,877 (Individual Income Tax Returns)
Here:
$50,877
State:
$53,401
Salary/wage: $37,960 (reported on 76.9% of returns)
Here:
$37,960
State:
$40,976
(% of AGI for various income ranges: 54.6% for AGIs below $25k, 60.9% for AGIs $25k-50k, 62.1% for AGIs $50k-75k, 57.8% for AGIs $75k-100k, 53.2% for AGIs $100k-200k)
Taxable interest for individuals: $1,350 (reported on 53.8% of returns)
This zip code:
$1,350
Montana:
$1,689
(% of AGI for various income ranges: 0.8% for AGIs below $25k, 1.7% for AGIs $25k-50k, 2.9% for AGIs $50k-75k, 1.6% for AGIs $75k-100k, 0.4% for AGIs $100k-200k)
Ordinary dividends: $2,238 (reported on 30.8% of returns)
Here:
$2,238
State:
$5,585
(% of AGI for various income ranges: 1.5% for AGIs below $25k, 3.8% for AGIs $25k-50k, 2.6% for AGIs $75k-100k)
Net capital gain/loss in AGI: +$5,071 (reported on 26.9% of returns)
Here:
+$5,071
State:
+$14,401
Profit/loss from business: +$6,025 (reported on 15.4% of returns)
Here:
+$6,025
State:
+$10,980
Taxable individual retirement arrangement distribution: $6,267 (reported on 11.5% of returns)
59468:
$6,267
Montana:
$13,434
Total itemized deductions: $15,738 (23% of AGI, reported on 30.8% of returns)
Here:
$15,738
State:
$21,750
Here:
22.8% of AGI
State:
20.5% of AGI
(% of AGI for various income ranges: 29.3% for AGIs below $25k, 17.4% for AGIs $50k-75k, 10.8% for AGIs $100k-200k)
Charity contributions: $2,100 (reported on 23.1% of returns)
Here:
$2,100
State:
$3,989
Taxes paid: $4,438 (reported on 30.8% of returns)
59468:
$4,438
State:
$7,640
(% of AGI for various income ranges: 5.2% for AGIs below $25k, 4.3% for AGIs $50k-75k, 4.3% for AGIs $100k-200k)
Earned income credit: $2,600 (reported on 11.5% of returns)
Here:
$2,600
State:
$2,015
(% of AGI for various income ranges: 6.5% for AGIs below $25k)
Percentage of individuals using paid preparers for their 2012 taxes: 69.2%
Here:
69%
State:
57%
(% for various income ranges: 66.7% for AGIs below $25k, 66.7% for AGIs $25k-50k, 75.0% for AGIs $50k-75k, 75.0% for AGIs $75k-100k, 66.7% for AGIs $100k-200k)
Averages for the 2004 tax year for zip code 59468, filed in 2005:
Average Adjusted Gross Income (AGI) in 2004: $33,245 (Individual Income Tax Returns)
Here:
$33,245
State:
$37,845
Salary/wage: $29,297 (reported on 75.1% of returns)
Here:
$29,297
State:
$31,190
(% of AGI for various income ranges: 131.2% for AGIs below $10k, 72.8% for AGIs $10k-25k, 62.2% for AGIs $25k-50k, 65.3% for AGIs $50k-75k, 61.2% for AGIs $75k-100k)
Taxable interest for individuals: $1,730 (reported on 59.1% of returns)
This zip code:
$1,730
Montana:
$1,879
(% of AGI for various income ranges: 8.7% for AGIs below $10k, 6.7% for AGIs $10k-25k, 2.4% for AGIs $25k-50k, 3.8% for AGIs $50k-75k, 0.6% for AGIs $75k-100k)
Taxable dividends: $1,796 (reported on 36.4% of returns)
Here:
$1,796
State:
$3,070
(% of AGI for various income ranges: 5.1% for AGIs below $10k, 2.0% for AGIs $10k-25k, 0.8% for AGIs $25k-50k, 4.3% for AGIs $50k-75k)
Net capital gain/loss: +$1,152 (reported on 29.4% of returns)
Here:
+$1,152
State:
+$10,237
(% of AGI for various income ranges: 8.3% for AGIs below $10k, -0.4% for AGIs $10k-25k, 1.2% for AGIs $25k-50k, 1.6% for AGIs $50k-75k)
Profit/loss from business: +$1,977 (reported on 16.0% of returns)
Here:
+$1,977
State:
+$8,849
Profit/loss from farming: +$5,127 (reported on 26.4% of returns)
Here:
+$5,127
State:
-$5,244
(% of AGI for various income ranges: -45.8% for AGIs below $10k, 7.0% for AGIs $10k-25k, 12.6% for AGIs $25k-50k, 3.7% for AGIs $50k-75k)
Total itemized deductions: $14,786 (25% of AGI, reported on 26.0% of returns)
Here:
$14,786
State:
$17,258
Here:
24.9% of AGI
State:
23.1% of AGI
(% of AGI for various income ranges: 24.1% for AGIs $10k-25k, 13.1% for AGIs $50k-75k, 16.5% for AGIs $75k-100k)
Charity contributions deductions: $1,188 (2% of AGI, reported on 17.8% of returns)
Here:
$1,188
State:
$2,921
Here:
2.0% of AGI
State:
3.7% of AGI
(% of AGI for various income ranges: 2.0% for AGIs $10k-25k, 0.7% for AGIs $50k-75k, 0.5% for AGIs $75k-100k)
Total tax: $3,457 (reported on 74.0% of returns)
59468:
$3,457
State:
$5,485
(% of AGI for various income ranges: 4.7% for AGIs below $10k, 5.3% for AGIs $10k-25k, 7.8% for AGIs $25k-50k, 8.7% for AGIs $50k-75k, 7.8% for AGIs $75k-100k)
Earned income credit: $1,679 (reported on 10.4% of returns)
Here:
$1,679
State:
$1,604
Percentage of individuals using paid preparers for their 2004 taxes: 73.6%
Here:
74%
State:
63%
(% for various income ranges: 69.0% for AGIs below $10k, 76.6% for AGIs $10k-25k, 73.4% for AGIs $25k-50k, 78.7% for AGIs $50k-75k, 69.6% for AGIs $75k-100k)
Household received Food Stamps/SNAP in the past 12 months: 11 Household did not receive Food Stamps/SNAP in the past 12 months: 284
Women who had a birth in the past 12 months: 10 (5 now married, 4 unmarried) Women who did not have a birth in the past 12 months: 85 (68 now married, 17 unmarried)
Housing units in zip code 59468 with a mortgage: 134 (14 second mortgage, 13 both second mortgage and home equity loan) Median monthly owner costs for units with a mortgage: $1,468 Median monthly owner costs for units without a mortgage: $635
Residents with income below the poverty level in 2022:
This zip code:
10.6%
Whole state:
12.1%
Residents with income below 50% of the poverty level in 2022:
This zip code:
8.5%
Whole state:
6.3%
Median number of rooms in houses and condos:
Here:
6.8
State:
6.4
Median number of rooms in apartments:
Here:
5.8
State:
4.2
Notable locations in this zip code not listed on our city pages
Notable locations in zip code 59468: Power (A), Harvest States Cooperatives Elevator (B), Gunderson Elevator (C), Vaughn Volunteer Fire Department - Newman Bench Volunteer Fire Company (D), Power Ambulance (E), Power Volunteer Fire Department (F). Display/hide their locations on the map
Churches in zip code 59468 include: Guardian Angel Catholic Church (A), United Church of Christ Congregational (B), Zion Lutheran Church (C). Display/hide their locations on the map
Size of family households: 104 2-persons, 13 3-persons, 11 4-persons, 31 5-persons, 15 7-or-more-persons
Size of nonfamily households: 103 1-person, 15 2-persons
163 married couples with children.
5 single-parent households (5 women).
99.0% of residents of 59468 zip code speak English at home.
0.7% of residents speak other Indo-European language at home (100% very well).
0.3% of residents speak Asian or Pacific Island language at home (100% well).
Foreign born population: 2 (0.4%) (0.0% of them are naturalized citizens)
:
0.4%
Whole state:
2.3%
18%German
16%Norwegian
11%English
9%European
6%Swedish
6%Irish
2%Scottish
Year of entry for the foreign-born population
02010 or later
02000 to 2009
51990 to 1999
1Before 1990
Facilities with environmental interests located in this zip code:
MOUNTAIN VIEW CO-OP POWER (307 CASCADE AVENUE in POWER, MT)
ENFORCEMENT/COMPLIANCE ACTIVITY (Integrated Compliance Information System)
78.8%Bottled, tank, or LP gas
11.1%Fuel oil, kerosene, etc.
4.7%Wood
3.9%Electricity
1.4%Utility gas
1.1%Other fuel
Population in 1990: 862.
Place of birth for U.S.-born residents:
This state: 436
Northeast: 11
Midwest: 67
South: 29
West: 91
73% of the 59468 zip code residents lived in the same house 5 years ago. Out of people who lived in different houses, 25% lived in this county. Out of people who lived in different counties, 50% lived in Montana.
92% of the 59468 zip code residents lived in the same house 1 year ago. Out of people who lived in different houses, 20% moved from this county. Out of people who lived in different houses, 71% moved from different county within same state.
Private vs. public school enrollment:
Students in private schools in grades 1 to 8 (elementary and middle school):
Here:
0.0%
Montana:
15.3%
Students in private schools in grades 9 to 12 (high school):
Here:
0.0%
Montana:
12.2%
Students in private undergraduate colleges: 4
Here:
38.5%
Montana:
15.0%
Occupation by median earnings in the past 12 months ($)
71,282Sales and related occupations
60,525Health diagnosing and treating practitioners and other technical occupations
56,956Business and financial operations occupations
49,110Management occupations
39,157Education, training, and library occupations
38,463Office and administrative support occupations
Companies with federal contracts located in this zip code:
REBECCA J BURGUESS (1550 9TH ROAD NE in POWER, NC; small business) : $3,316,979 in 16 contractsfrom 1999 to 2005
Contracts for Maintenance, Repair and Rebuilding of Equipment -- Instruments and Laboratory Equipment, Other Quality Control, Testing and Inspection Services -- Miscellaneous, Equipment and Materials Testing -- Measuring Tools, Operation of Government-Owned Facilities -- Testing and Measurement Buildings by Air Force Signed by year:2000: $532,405; 2001: $520,403; 2002: $222,104; 2003: $690,773; 2004: $445,110; 2005: $459,188; 2006: $0.
Biggest contracts:
$517,127 with Air Force for Maintenance, Repair and Rebuilding of Equipment -- Instruments and Laboratory Equipment. Signed on 2001-10-10. Completion date: 2002-09-30.
$504,114, same as above.Signed on 2000-10-06. Completion date: 2001-09-30.
$459,188 with Air Force for Other Quality Control, Testing and Inspection Services -- Miscellaneous. Signed on 2005-10-27. Completion date: 2006-09-30.
$446,996 with Air Force for Maintenance, Repair and Rebuilding of Equipment -- Instruments and Laboratory Equipment. Signed on 1999-10-01. Completion date: 2000-09-30.
SMOOT HONEY COMPANY (202 CENTRAL AVE in POWER, MT; small business) : $8,811 in 4 contractsfrom 2004 to 2006
$2,992 with Defense Commissary Agency for Food Items For Resale. Signed on 2004-10-01. Completion date: 2005-02-28.
$2,875, same as above.Signed on 2005-04-01. Completion date: 2005-08-31.
$1,988, same as above.Signed on 2006-01-01. Completion date: 2006-03-31.
$956, same as above.Signed on 2005-10-01. Completion date: 2005-12-31.
Top industries in this zip code by the number of employees in 2005:
Other Services (except Public Administration): Other Electronic and Precision Equipment Repair and Maintenance (10-19 employees: 1 establishment)
Construction: New Single-Family Housing Construction (except Operative Builders) (5-9: 1)
Professional, Scientific, and Technical Services: Veterinary Services (5-9: 1)
Accommodation and Food Services: Drinking Places (Alcoholic Beverages) (5-9: 1)
Other Services (except Public Administration): Religious Organizations (1-4: 1)
Construction: Plumbing, Heating, and Air-Conditioning Contractors (1-4: 1)
Construction: Commercial and Institutional Building Construction (1-4: 1)
Fatal accident statistics in 2014:
Fatal accident count: 3
Vehicles involved in fatal accidents: 5
Fatal accidents caused by drunken drivers: 2
Fatalities: 3
Persons involved in fatal accidents: 7
Pedestrians involved in fatal accidents: 0
Fatal accident statistics in 2012:
Fatal accident count: 1
Vehicles involved in fatal accidents: 1
Fatal accidents caused by drunken drivers: 0
Fatalities: 1
Persons involved in fatal accidents: 2
Pedestrians involved in fatal accidents: 0
Home Mortgage Disclosure Act Aggregated Statistics For Year 2009 (Based on 2 partial tracts)
A) FHA, FSA/RHS & VA Home Purchase Loans
B) Conventional Home Purchase Loans
C) Refinancings
D) Home Improvement Loans
F) Non-occupant Loans on < 5 Family Dwellings (A B C & D)
G) Loans On Manufactured Home Dwelling (A B C & D)
Number
Average Value
Number
Average Value
Number
Average Value
Number
Average Value
Number
Average Value
Number
Average Value
LOANS ORIGINATED
12
$112,877
7
$111,987
48
$144,582
10
$31,800
4
$65,095
17
$93,561
APPLICATIONS APPROVED, NOT ACCEPTED
1
$103,600
2
$156,505
5
$171,186
1
$2,220
0
$0
1
$59,830
APPLICATIONS DENIED
2
$92,240
3
$139,240
15
$143,523
6
$51,430
1
$77,560
5
$71,244
APPLICATIONS WITHDRAWN
1
$76,450
1
$122,430
14
$133,039
2
$31,025
1
$22,710
4
$90,580
FILES CLOSED FOR INCOMPLETENESS
0
$0
2
$109,970
2
$76,450
0
$0
0
$0
1
$60,390
Aggregated Statistics For Year 2008 (Based on 2 partial tracts)
A) FHA, FSA/RHS & VA Home Purchase Loans
B) Conventional Home Purchase Loans
C) Refinancings
D) Home Improvement Loans
F) Non-occupant Loans on < 5 Family Dwellings (A B C & D)
G) Loans On Manufactured Home Dwelling (A B C & D)
Number
Average Value
Number
Average Value
Number
Average Value
Number
Average Value
Number
Average Value
Number
Average Value
LOANS ORIGINATED
12
$121,095
12
$111,216
39
$114,678
7
$27,226
6
$57,617
9
$100,951
APPLICATIONS APPROVED, NOT ACCEPTED
1
$64,260
2
$139,330
4
$99,582
1
$23,270
1
$132,960
3
$77,743
APPLICATIONS DENIED
1
$123,540
3
$38,227
16
$132,268
7
$57,696
1
$225,480
6
$54,568
APPLICATIONS WITHDRAWN
1
$88,640
2
$231,570
10
$145,203
1
$55,400
0
$0
2
$106,920
FILES CLOSED FOR INCOMPLETENESS
0
$0
0
$0
1
$12,190
1
$19,390
0
$0
0
$0
Aggregated Statistics For Year 2007 (Based on 2 partial tracts)
A) FHA, FSA/RHS & VA Home Purchase Loans
B) Conventional Home Purchase Loans
C) Refinancings
D) Home Improvement Loans
F) Non-occupant Loans on < 5 Family Dwellings (A B C & D)
G) Loans On Manufactured Home Dwelling (A B C & D)
Number
Average Value
Number
Average Value
Number
Average Value
Number
Average Value
Number
Average Value
Number
Average Value
LOANS ORIGINATED
13
$115,999
12
$102,074
33
$113,939
8
$44,320
7
$63,156
12
$81,346
APPLICATIONS APPROVED, NOT ACCEPTED
1
$142,380
2
$71,745
2
$42,105
1
$16,070
1
$110,250
1
$36,010
APPLICATIONS DENIED
1
$27,700
5
$122,212
35
$94,813
11
$28,707
1
$14,960
13
$65,244
APPLICATIONS WITHDRAWN
2
$119,665
2
$182,820
14
$97,544
5
$44,652
1
$8,860
3
$66,297
FILES CLOSED FOR INCOMPLETENESS
1
$84,210
0
$0
1
$136,840
1
$16,620
0
$0
1
$16,620
Aggregated Statistics For Year 2006 (Based on 2 partial tracts)
A) FHA, FSA/RHS & VA Home Purchase Loans
B) Conventional Home Purchase Loans
C) Refinancings
D) Home Improvement Loans
F) Non-occupant Loans on < 5 Family Dwellings (A B C & D)
G) Loans On Manufactured Home Dwelling (A B C & D)
Number
Average Value
Number
Average Value
Number
Average Value
Number
Average Value
Number
Average Value
Number
Average Value
LOANS ORIGINATED
14
$110,879
19
$91,060
35
$98,343
11
$43,162
4
$84,070
12
$87,671
APPLICATIONS APPROVED, NOT ACCEPTED
2
$83,100
2
$63,155
4
$74,928
1
$27,150
0
$0
0
$0
APPLICATIONS DENIED
2
$79,220
7
$43,766
34
$106,857
6
$21,237
1
$52,080
13
$49,008
APPLICATIONS WITHDRAWN
0
$0
6
$90,025
16
$86,528
2
$5,540
1
$30,470
4
$55,815
FILES CLOSED FOR INCOMPLETENESS
1
$165,650
1
$70,910
1
$75,340
0
$0
0
$0
0
$0
Aggregated Statistics For Year 2005 (Based on 2 partial tracts)
A) FHA, FSA/RHS & VA Home Purchase Loans
B) Conventional Home Purchase Loans
C) Refinancings
D) Home Improvement Loans
F) Non-occupant Loans on < 5 Family Dwellings (A B C & D)
G) Loans On Manufactured Home Dwelling (A B C & D)
Number
Average Value
Number
Average Value
Number
Average Value
Number
Average Value
Number
Average Value
Number
Average Value
LOANS ORIGINATED
11
$122,635
20
$101,271
35
$107,887
12
$25,207
4
$50,690
8
$93,834
APPLICATIONS APPROVED, NOT ACCEPTED
1
$130,740
3
$86,053
6
$69,803
1
$27,700
0
$0
2
$58,170
APPLICATIONS DENIED
2
$99,720
7
$61,099
43
$80,704
7
$36,564
1
$75,900
17
$60,191
APPLICATIONS WITHDRAWN
2
$113,015
3
$60,017
23
$94,324
4
$38,088
1
$167,310
3
$55,583
FILES CLOSED FOR INCOMPLETENESS
0
$0
0
$0
3
$134,623
1
$13,850
0
$0
0
$0
Aggregated Statistics For Year 2004 (Based on 2 partial tracts)
A) FHA, FSA/RHS & VA Home Purchase Loans
B) Conventional Home Purchase Loans
C) Refinancings
D) Home Improvement Loans
F) Non-occupant Loans on < 5 Family Dwellings (A B C & D)
G) Loans On Manufactured Home Dwelling (A B C & D)
Number
Average Value
Number
Average Value
Number
Average Value
Number
Average Value
Number
Average Value
Number
Average Value
LOANS ORIGINATED
18
$95,596
16
$80,053
50
$93,604
9
$21,360
3
$80,883
12
$75,298
APPLICATIONS APPROVED, NOT ACCEPTED
1
$101,940
5
$71,244
8
$67,726
4
$27,562
0
$0
4
$74,512
APPLICATIONS DENIED
5
$96,618
9
$100,397
30
$96,008
12
$30,054
1
$1,110
13
$58,554
APPLICATIONS WITHDRAWN
1
$170,630
3
$77,743
20
$98,335
3
$42,657
2
$115,510
2
$66,755
FILES CLOSED FOR INCOMPLETENESS
1
$60,390
1
$35,460
2
$73,960
0
$0
1
$35,460
0
$0
Aggregated Statistics For Year 2003 (Based on 2 partial tracts)
A) FHA, FSA/RHS & VA Home Purchase Loans
B) Conventional Home Purchase Loans
C) Refinancings
D) Home Improvement Loans
F) Non-occupant Loans on < 5 Family Dwellings (A B C & D)
Number
Average Value
Number
Average Value
Number
Average Value
Number
Average Value
Number
Average Value
LOANS ORIGINATED
17
$97,276
23
$114,124
109
$94,734
12
$14,266
4
$79,360
APPLICATIONS APPROVED, NOT ACCEPTED
2
$89,195
3
$139,793
11
$91,259
2
$5,815
0
$0
APPLICATIONS DENIED
4
$113,848
6
$88,178
33
$81,975
5
$16,842
1
$37,120
APPLICATIONS WITHDRAWN
4
$105,260
3
$126,313
25
$88,596
0
$0
0
$0
FILES CLOSED FOR INCOMPLETENESS
0
$0
0
$0
2
$104,985
0
$0
0
$0
Aggregated Statistics For Year 2002 (Based on 2 partial tracts)
A) FHA, FSA/RHS & VA Home Purchase Loans
B) Conventional Home Purchase Loans
C) Refinancings
D) Home Improvement Loans
F) Non-occupant Loans on < 5 Family Dwellings (A B C & D)
Number
Average Value
Number
Average Value
Number
Average Value
Number
Average Value
Number
Average Value
LOANS ORIGINATED
8
$85,592
13
$84,975
52
$95,032
7
$14,246
3
$50,413
APPLICATIONS APPROVED, NOT ACCEPTED
0
$0
4
$70,498
8
$72,644
1
$1,110
1
$38,230
APPLICATIONS DENIED
0
$0
7
$49,069
24
$78,830
4
$19,805
1
$1,110
APPLICATIONS WITHDRAWN
0
$0
1
$33,240
17
$95,092
2
$20,775
1
$33,240
FILES CLOSED FOR INCOMPLETENESS
0
$0
1
$93,630
2
$90,855
1
$26,590
0
$0
Aggregated Statistics For Year 2001 (Based on 2 partial tracts)
A) FHA, FSA/RHS & VA Home Purchase Loans
B) Conventional Home Purchase Loans
C) Refinancings
D) Home Improvement Loans
F) Non-occupant Loans on < 5 Family Dwellings (A B C & D)
Number
Average Value
Number
Average Value
Number
Average Value
Number
Average Value
Number
Average Value
LOANS ORIGINATED
13
$73,426
17
$69,282
52
$81,555
9
$15,573
1
$72,020
APPLICATIONS APPROVED, NOT ACCEPTED
1
$57,060
6
$58,355
7
$68,459
1
$16,620
0
$0
APPLICATIONS DENIED
0
$0
12
$61,817
28
$61,355
3
$16,437
1
$34,900
APPLICATIONS WITHDRAWN
1
$73,130
3
$48,937
11
$78,617
2
$16,620
0
$0
FILES CLOSED FOR INCOMPLETENESS
0
$0
1
$44,870
4
$64,265
0
$0
0
$0
Aggregated Statistics For Year 2000 (Based on 2 partial tracts)
A) FHA, FSA/RHS & VA Home Purchase Loans
B) Conventional Home Purchase Loans
C) Refinancings
D) Home Improvement Loans
E) Loans on Dwellings For 5+ Families
F) Non-occupant Loans on < 5 Family Dwellings (A B C & D)
Number
Average Value
Number
Average Value
Number
Average Value
Number
Average Value
Number
Average Value
Number
Average Value
LOANS ORIGINATED
6
$87,532
17
$70,065
17
$58,626
6
$13,018
1
$34,900
1
$38,230
APPLICATIONS APPROVED, NOT ACCEPTED
1
$94,730
8
$71,328
6
$62,602
1
$19,390
0
$0
0
$0
APPLICATIONS DENIED
1
$5,540
11
$45,025
22
$47,921
5
$24,154
0
$0
0
$0
APPLICATIONS WITHDRAWN
1
$43,770
1
$38,780
8
$65,649
1
$18,280
0
$0
0
$0
FILES CLOSED FOR INCOMPLETENESS
0
$0
0
$0
1
$68,140
1
$11,080
0
$0
0
$0
Aggregated Statistics For Year 1999 (Based on 1 partial tract)
A) FHA, FSA/RHS & VA Home Purchase Loans
B) Conventional Home Purchase Loans
C) Refinancings
D) Home Improvement Loans
F) Non-occupant Loans on < 5 Family Dwellings (A B C & D)


+$5,127
-$5,244
(% of AGI for various income ranges: -45.8% for AGIs below $10k, 7.0% for AGIs $10k-25k, 12.6% for AGIs $25k-50k, 3.7% for AGIs $50k-75k)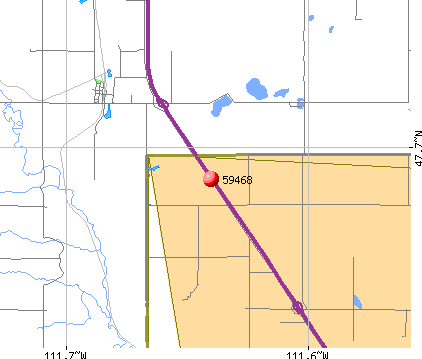 Nearest zip codes: 59487, 59433, 59443, 59483, 59485, 59404.


