Estimated zip code population in 2022: 605 Zip code population in 2010: 544 Zip code population in 2000: 631
Houses and condos: 304 Renter-occupied apartments: 10
% of renters here:
4%
State:
28%
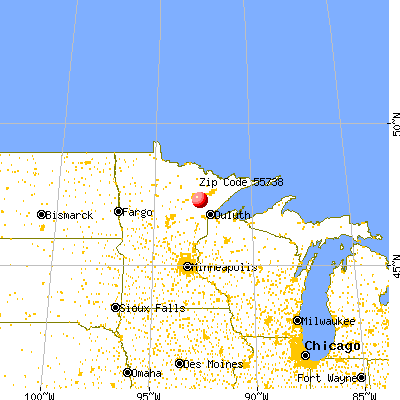
March 2022 cost of living index in zip code 55738: 83.6 (less than average, U.S. average is 100)
Land area: 108.7 sq. mi. Water area: 1.6 sq. mi.
Population density: 6 people per square mile
(very low).
OSM Map
General Map
Google Map
MSN Map
OSM Map
General Map
Google Map
MSN Map
OSM Map
General Map
Google Map
MSN Map
OSM Map
General Map
Google Map
MSN Map
Please wait while loading the map...
Real estate property taxes paid for housing units in 2022:
This zip code:
0.5% ($797)
Minnesota:
1.0% ($3,087)
Median real estate property taxes paid for housing units with mortgages in 2022: $1,012 (0.6%) Median real estate property taxes paid for housing units with no mortgage in 2022: $756 (0.6%)
Business Search- 14 Million verified businesses
Males: 316
(52.3%)
Females: 289
(47.7%)
For population 25 years and over in 55738:
High school or higher: 95.6%
Bachelor's degree or higher: 15.5%
Graduate or professional degree: 9.4%
Unemployed: 4.0%
Mean travel time to work (commute): 31.8 minutes
For population 15 years and over in 55738:
Never married: 21.7%
Now married: 63.8%
Separated: 0.9%
Widowed: 7.1%
Divorced: 6.5%
Zip code 55738 compared to state average:
Median house value below state average.
Black race population percentage significantly below state average.
Hispanic race population percentage significantly below state average.
Median age significantly above state average.
Foreign-born population percentage significantly below state average.
Renting percentage significantly below state average.
Length of stay since moving in significantly above state average.
Percentage of population with a bachelor's degree or higher significantly below state average.
Estimated median house/condo value in 2022: $145,782
55738:
$145,782
Minnesota:
$314,600
Median resident age:
This zip code:
48.5 years
Minnesota median age:
39.0 years
Average household size:
This zip code:
2.5 people
Minnesota:
2.4 people
Averages for the 2020 tax year for zip code 55738, filed in 2021:
Average Adjusted Gross Income (AGI) in 2020: $60,575 (Individual Income Tax Returns)
Here:
$60,575
State:
$82,178
Salary/wage: $50,357 (reported on 82.1% of returns)
Here:
$50,357
State:
$67,438
(% of AGI for various income ranges: 1617.5% for AGIs below $25k, 3705.0% for AGIs $25k-50k, 4208.0% for AGIs $50k-75k, 18393.3% for AGIs $100k-200k)
Taxable interest for individuals: $200 (reported on 21.4% of returns)
This zip code:
$200
Minnesota:
$1,814
(% of AGI for various income ranges: 22.5% for AGIs $25k-50k)
Ordinary dividends: $750 (reported on 14.3% of returns)
Here:
$750
State:
$6,928
(% of AGI for various income ranges: 60.0% for AGIs $50k-75k)
Net capital gain/loss in AGI: +$2,367 (reported on 10.7% of returns)
Here:
+$2,367
State:
+$20,591
(% of AGI for various income ranges: 142.0% for AGIs $50k-75k)
Profit/loss from business: +$7,367 (reported on 10.7% of returns)
Here:
+$7,367
State:
+$14,342
(% of AGI for various income ranges: 552.5% for AGIs $25k-50k)
Earned income credit: $2,600 (reported on 7.1% of returns)
Here:
$2,600
State:
$2,055
(% of AGI for various income ranges: 130.0% for AGIs below $25k)
Percentage of individuals using paid preparers for their 2020 taxes: 85.7%
Here:
86%
State:
94%
(% for various income ranges: 100.0% for AGIs below $25k, 83.3% for AGIs $25k-50k, 80.0% for AGIs $50k-75k, 75.0% for AGIs $75k-100k, 83.3% for AGIs $100k-200k)
Averages for the 2012 tax year for zip code 55738, filed in 2013:
Average Adjusted Gross Income (AGI) in 2012: $50,273 (Individual Income Tax Returns)
Here:
$50,273
State:
$67,192
Salary/wage: $45,568 (reported on 84.6% of returns)
Here:
$45,568
State:
$55,182
(% of AGI for various income ranges: 65.9% for AGIs below $25k, 76.8% for AGIs $25k-50k, 76.9% for AGIs $50k-75k, 82.9% for AGIs $75k-100k, 72.0% for AGIs $100k-200k)
Taxable interest for individuals: $156 (reported on 34.6% of returns)
This zip code:
$156
Minnesota:
$1,664
Ordinary dividends: $533 (reported on 11.5% of returns)
Here:
$533
State:
$5,665
Net capital gain/loss in AGI: +$100 (reported on 11.5% of returns)
Here:
+$100
State:
+$16,131
Profit/loss from business: +$4,000 (reported on 11.5% of returns)
Here:
+$4,000
State:
+$12,430
Taxable individual retirement arrangement distribution: $9,933 (reported on 11.5% of returns)
55738:
$9,933
Minnesota:
$15,212
Total itemized deductions: $17,443 (20% of AGI, reported on 26.9% of returns)
Here:
$17,443
State:
$24,665
Here:
19.8% of AGI
State:
19.6% of AGI
Charity contributions: $2,140 (reported on 19.2% of returns)
Here:
$2,140
State:
$3,948
Taxes paid: $5,871 (reported on 26.9% of returns)
55738:
$5,871
State:
$10,589
Earned income credit: $1,867 (reported on 11.5% of returns)
Here:
$1,867
State:
$2,037
(% of AGI for various income ranges: 5.0% for AGIs below $25k)
Percentage of individuals using paid preparers for their 2012 taxes: 53.8%
Here:
54%
State:
55%
(% for various income ranges: 44.4% for AGIs below $25k, 83.3% for AGIs $25k-50k, 100.0% for AGIs $75k-100k)
Averages for the 2004 tax year for zip code 55738, filed in 2005:
Average Adjusted Gross Income (AGI) in 2004: $35,638 (Individual Income Tax Returns)
Here:
$35,638
State:
$53,560
Salary/wage: $33,167 (reported on 87.3% of returns)
Here:
$33,167
State:
$46,177
(% of AGI for various income ranges: 76.0% for AGIs below $10k, 68.3% for AGIs $10k-25k, 78.2% for AGIs $25k-50k, 88.2% for AGIs $50k-75k, 82.3% for AGIs $75k-100k)
Taxable interest for individuals: $414 (reported on 41.4% of returns)
This zip code:
$414
Minnesota:
$1,796
(% of AGI for various income ranges: 0.4% for AGIs below $10k, 0.9% for AGIs $10k-25k, 0.6% for AGIs $25k-50k, 0.4% for AGIs $50k-75k, 0.3% for AGIs $75k-100k)
Taxable dividends: $139 (reported on 13.4% of returns)
Here:
$139
State:
$3,096
Net capital gain/loss: +$207 (reported on 10.8% of returns)
Here:
+$207
State:
+$10,864
Profit/loss from business: +$2,622 (reported on 13.8% of returns)
Here:
+$2,622
State:
+$10,442
Total itemized deductions: $13,949 (23% of AGI, reported on 22.0% of returns)
Here:
$13,949
State:
$20,035
Here:
22.7% of AGI
State:
21.3% of AGI
Charity contributions deductions: $1,878 (3% of AGI, reported on 18.3% of returns)
Here:
$1,878
State:
$3,333
Here:
2.9% of AGI
State:
3.4% of AGI
Total tax: $4,298 (reported on 70.1% of returns)
55738:
$4,298
State:
$8,485
(% of AGI for various income ranges: 2.3% for AGIs below $10k, 3.5% for AGIs $10k-25k, 6.8% for AGIs $25k-50k, 8.9% for AGIs $50k-75k, 11.9% for AGIs $75k-100k)
Earned income credit: $1,702 (reported on 17.5% of returns)
Here:
$1,702
State:
$1,523
Percentage of individuals using paid preparers for their 2004 taxes: 57.5%
Here:
57%
State:
59%
(% for various income ranges: 35.6% for AGIs below $10k, 65.3% for AGIs $10k-25k, 55.0% for AGIs $25k-50k, 70.8% for AGIs $50k-75k, 65.5% for AGIs $75k-100k)
Household received Food Stamps/SNAP in the past 12 months: 6 Household did not receive Food Stamps/SNAP in the past 12 months: 231
Women who had a birth in the past 12 months: 2 (2 now married, 0 unmarried) Women who did not have a birth in the past 12 months: 90 (56 now married, 34 unmarried)
Housing units in zip code 55738 with a mortgage: 98 (7 second mortgage, 6 both second mortgage and home equity loan) Median monthly owner costs for units with a mortgage: $1,234 Median monthly owner costs for units without a mortgage: $395
Residents with income below the poverty level in 2022:
This zip code:
10.5%
Whole state:
9.6%
Residents with income below 50% of the poverty level in 2022:
This zip code:
7.3%
Whole state:
5.2%
Median number of rooms in houses and condos:
Here:
6.3
State:
7.1
Median number of rooms in apartments:
Here:
4.2
State:
3.8
Notable locations in this zip code not listed on our city pages
Lakes and reservoirs: Clover Lake (A), Hammer Lake (B), Perch Lake (C), Twin Lakes (D), Eveleth Taconite Tailings Basin (E). Display/hide their locations on the map
Size of family households: 99 2-persons, 24 3-persons, 20 4-persons, 17 5-persons, 7 6-persons, 4 7-or-more-persons
Size of nonfamily households: 56 1-person, 7 2-persons
102 married couples with children.
1 single-parent households (1 men).
99.7% of residents of 55738 zip code speak English at home.
0.5% of residents speak other Indo-European language at home (100% very well).
Foreign born population: 1 (0.2%) (100.0% of them are naturalized citizens)
This zip code:
0.2%
Whole state:
8.7%
14%Finnish
14%Irish
12%German
11%American
7%English
5%Italian
5%Norwegian
Year of entry for the foreign-born population
02010 or later
02000 to 2009
01990 to 1999
6Before 1990
Facilities with environmental interests located in this zip code:
EVTAC MINING - PLANT (HIGHWAY 16 in FORBES, MN)
AIR MAJOR (AIRS/AFS) OIL CONTROL (Facility Response Plan for oil discharge) STATE MASTER (Minnesota Pollution Control Agency permits and compilance tracking) - AIRS-2713700113, AIR PROGRAM, RCRAINFO-MNT280011073, LQG, PCS-MN0052116, NPDES NON-MAJOR, AFS-2713700113, AIR MAJOR, RCRIS-MNT280011073, SQG COMPLIANCE ACTIVITY (Tracking inspections of insecticide, fungicide, and rodenticide, and toxic substances) CRITERIA AND HAZARDOUS AIR POLLUTANT INVENTORY (Inventory of air pollution sources) National Pollutant Discharge Elimination System NON-MAJOR (Tracking pollutant discharge elimination systems) - permit HAZARDOUS WASTE BIENNIAL REPORTER (Resource Conservation and Recovery Act (tracking hazardous waste)) Small Quantity Generators, between 100 kg and 1000 kg of hazardous waste/month (Resource Conservation and Recovery Act (tracking hazardous waste)) Business SIC classification: IRON ORES Business NAICS classification: IRON ORE MINING.; IRON ORE MINING. Organizations: EVELETH MINES (CONTACT/GENERAL)
, UNITED TACONITE LLC (CONTACT/OWNER)
Alternative names: EVELETH MINES, EVELETH MINES FAIRLANE PLT, EVELETH MINES LLC DBA EVTAC, EVELETH MINES,LLC EVATC MINING, EVELETH TACONITE/EX-FAIRLANE
NTT OF MINNESOTA INC - METALLIC (8822 NORWAY RIDGE RD in FORBES, MN)
AIR SYNTHETIC MINOR (AIRS/AFS) CRITERIA AND HAZARDOUS AIR POLLUTANT INVENTORY (Inventory of air pollution sources) Business SIC classification: IRON ORES
Housing units lacking complete plumbing facilities: 13.7% Housing units lacking complete kitchen facilities: 12.8%
44.5%Bottled, tank, or LP gas
22.2%Fuel oil, kerosene, etc.
18.8%Wood
9.6%Electricity
6.1%Utility gas
Place of birth for U.S.-born residents:
This state: 508
Midwest: 47
South: 5
West: 35
71% of the 55738 zip code residents lived in the same house 5 years ago. Out of people who lived in different houses, 60% lived in this county. Out of people who lived in different counties, 50% lived in Minnesota.
99% of the 55738 zip code residents lived in the same house 1 year ago. Out of people who lived in different houses, 33% moved from this county. Out of people who lived in different houses, 50% moved from different county within same state. Out of people who lived in different houses, 17% moved from different state.
Private vs. public school enrollment:
Students in private schools in grades 1 to 8 (elementary and middle school): 1
Here:
1.7%
Minnesota:
12.9%
Students in private schools in grades 9 to 12 (high school): 1
Here:
2.9%
Minnesota:
8.6%
Students in private undergraduate colleges: 3
Here:
34.3%
Minnesota:
26.2%
Occupation by median earnings in the past 12 months ($)
115,429Architecture and engineering occupations
97,600Installation, maintenance, and repair occupations
63,736Health diagnosing and treating practitioners and other technical occupations
59,454Transportation occupations
53,536Business and financial operations occupations
50,375Management occupations
Top industries in this zip code by the number of employees in 2005:
Mining: Construction Sand and Gravel Mining (10-19 employees: 1 establishment)
Accommodation and Food Services: Full-Service Restaurants (5-9: 1)
Construction: Electrical Contractors (1-4: 1)
Other Services (except Public Administration): General Automotive Repair (1-4: 1)
Fatal accident statistics in 2011:
Fatal accident count: 1
Vehicles involved in fatal accidents: 1
Fatal accidents caused by drunken drivers: 1
Fatalities: 2
Persons involved in fatal accidents: 3
Pedestrians involved in fatal accidents: 0
Home Mortgage Disclosure Act Aggregated Statistics For Year 2009 (Based on 2 partial tracts)
A) FHA, FSA/RHS & VA Home Purchase Loans
B) Conventional Home Purchase Loans
C) Refinancings
D) Home Improvement Loans
F) Non-occupant Loans on < 5 Family Dwellings (A B C & D)
G) Loans On Manufactured Home Dwelling (A B C & D)
Number
Average Value
Number
Average Value
Number
Average Value
Number
Average Value
Number
Average Value
Number
Average Value
LOANS ORIGINATED
1
$132,400
1
$106,480
21
$121,672
1
$104,490
1
$131,600
1
$47,860
APPLICATIONS APPROVED, NOT ACCEPTED
0
$0
0
$0
2
$93,120
0
$0
0
$0
0
$0
APPLICATIONS DENIED
0
$0
2
$43,870
11
$134,432
0
$0
0
$0
2
$110,070
APPLICATIONS WITHDRAWN
0
$0
1
$41,080
2
$64,005
0
$0
0
$0
0
$0
FILES CLOSED FOR INCOMPLETENESS
0
$0
0
$0
2
$118,840
1
$25,920
0
$0
0
$0
Aggregated Statistics For Year 2008 (Based on 2 partial tracts)
A) FHA, FSA/RHS & VA Home Purchase Loans
B) Conventional Home Purchase Loans
C) Refinancings
D) Home Improvement Loans
F) Non-occupant Loans on < 5 Family Dwellings (A B C & D)
G) Loans On Manufactured Home Dwelling (A B C & D)
Number
Average Value
Number
Average Value
Number
Average Value
Number
Average Value
Number
Average Value
Number
Average Value
LOANS ORIGINATED
1
$120,840
4
$124,325
14
$148,411
2
$33,500
2
$249,650
2
$99,100
APPLICATIONS APPROVED, NOT ACCEPTED
0
$0
0
$0
4
$133,398
1
$81,750
0
$0
0
$0
APPLICATIONS DENIED
0
$0
2
$78,765
8
$125,671
3
$58,093
1
$49,050
1
$121,240
APPLICATIONS WITHDRAWN
0
$0
2
$122,630
4
$112,462
1
$52,240
0
$0
0
$0
FILES CLOSED FOR INCOMPLETENESS
0
$0
0
$0
2
$100,895
0
$0
0
$0
0
$0
Aggregated Statistics For Year 2007 (Based on 2 partial tracts)
B) Conventional Home Purchase Loans
C) Refinancings
D) Home Improvement Loans
F) Non-occupant Loans on < 5 Family Dwellings (A B C & D)
G) Loans On Manufactured Home Dwelling (A B C & D)
Number
Average Value
Number
Average Value
Number
Average Value
Number
Average Value
Number
Average Value
LOANS ORIGINATED
10
$145,602
18
$120,039
5
$61,416
4
$123,230
1
$188,230
APPLICATIONS APPROVED, NOT ACCEPTED
1
$78,960
3
$78,963
1
$11,170
0
$0
0
$0
APPLICATIONS DENIED
2
$124,625
11
$103,905
1
$35,890
1
$116,850
2
$103,690
APPLICATIONS WITHDRAWN
1
$78,960
4
$137,288
0
$0
0
$0
0
$0
FILES CLOSED FOR INCOMPLETENESS
0
$0
1
$107,680
0
$0
0
$0
0
$0
Aggregated Statistics For Year 2006 (Based on 2 partial tracts)
B) Conventional Home Purchase Loans
C) Refinancings
D) Home Improvement Loans
F) Non-occupant Loans on < 5 Family Dwellings (A B C & D)
G) Loans On Manufactured Home Dwelling (A B C & D)
Number
Average Value
Number
Average Value
Number
Average Value
Number
Average Value
Number
Average Value
LOANS ORIGINATED
9
$115,298
15
$116,237
8
$50,449
2
$126,620
3
$79,893
APPLICATIONS APPROVED, NOT ACCEPTED
1
$70,990
5
$82,472
0
$0
0
$0
0
$0
APPLICATIONS DENIED
2
$100,100
12
$94,715
4
$50,348
0
$0
1
$88,530
APPLICATIONS WITHDRAWN
1
$114,850
7
$91,097
0
$0
0
$0
0
$0
FILES CLOSED FOR INCOMPLETENESS
0
$0
3
$74,310
1
$95,310
0
$0
0
$0
Aggregated Statistics For Year 2005 (Based on 2 partial tracts)
B) Conventional Home Purchase Loans
C) Refinancings
D) Home Improvement Loans
F) Non-occupant Loans on < 5 Family Dwellings (A B C & D)
G) Loans On Manufactured Home Dwelling (A B C & D)
Number
Average Value
Number
Average Value
Number
Average Value
Number
Average Value
Number
Average Value
LOANS ORIGINATED
7
$113,771
23
$104,035
2
$22,930
1
$92,120
1
$99,300
APPLICATIONS APPROVED, NOT ACCEPTED
2
$91,725
3
$113,790
0
$0
1
$100,900
0
$0
APPLICATIONS DENIED
2
$96,510
14
$115,082
3
$40,943
1
$69,390
1
$36,290
APPLICATIONS WITHDRAWN
4
$113,160
10
$120,757
2
$102,095
1
$97,710
0
$0
FILES CLOSED FOR INCOMPLETENESS
0
$0
4
$126,420
0
$0
0
$0
0
$0
Aggregated Statistics For Year 2004 (Based on 2 partial tracts)
A) FHA, FSA/RHS & VA Home Purchase Loans
B) Conventional Home Purchase Loans
C) Refinancings
D) Home Improvement Loans
F) Non-occupant Loans on < 5 Family Dwellings (A B C & D)
G) Loans On Manufactured Home Dwelling (A B C & D)
Number
Average Value
Number
Average Value
Number
Average Value
Number
Average Value
Number
Average Value
Number
Average Value
LOANS ORIGINATED
1
$51,450
8
$97,308
25
$92,346
4
$34,895
3
$94,913
3
$47,457
APPLICATIONS APPROVED, NOT ACCEPTED
0
$0
0
$0
2
$62,015
0
$0
0
$0
0
$0
APPLICATIONS DENIED
0
$0
2
$68,990
9
$94,250
2
$76,370
0
$0
0
$0
APPLICATIONS WITHDRAWN
0
$0
0
$0
10
$115,333
1
$26,320
0
$0
1
$74,580
FILES CLOSED FOR INCOMPLETENESS
0
$0
1
$191,820
2
$106,280
0
$0
0
$0
0
$0
Aggregated Statistics For Year 2003 (Based on 2 partial tracts)
B) Conventional Home Purchase Loans
C) Refinancings
D) Home Improvement Loans
F) Non-occupant Loans on < 5 Family Dwellings (A B C & D)


 Nearest zip codes: 55751, 55765, 55768, 55766, 55734, 55758.


