Estimated zip code population in 2022: 5,328 Zip code population in 2010: 4,616 Zip code population in 2000: 4,106
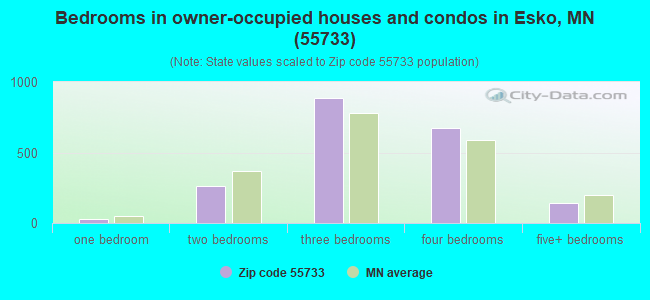
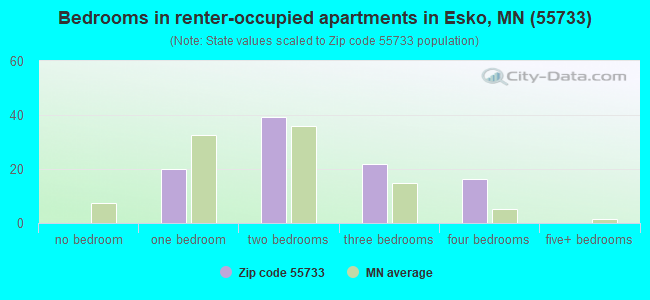
Houses and condos: 2,100 Renter-occupied apartments: 98
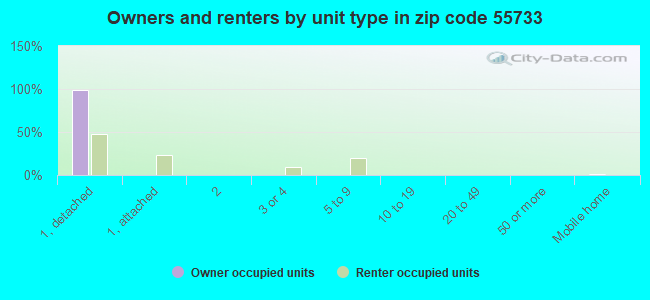
% of renters here:
5%
State:
28%
March 2022 cost of living index in zip code 55733: 88.4 (less than average, U.S. average is 100)
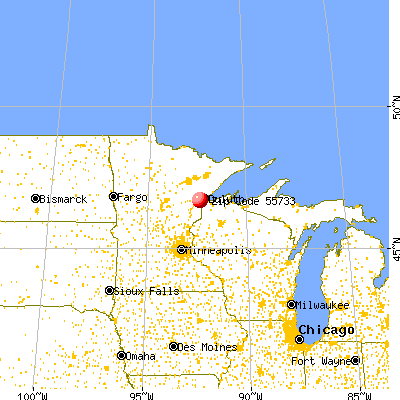
Land area: 35.8 sq. mi. Water area: 0.6 sq. mi.
Population density: 149 people per square mile
(very low).
OSM Map
General Map
Google Map
MSN Map
OSM Map
General Map
Google Map
MSN Map
OSM Map
General Map
Google Map
MSN Map
OSM Map
General Map
Google Map
MSN Map
Please wait while loading the map...
Real estate property taxes paid for housing units in 2022:
This zip code:
1.0% ($3,542)
Minnesota:
1.0% ($3,087)
Median real estate property taxes paid for housing units with mortgages in 2022: $3,511 (1.0%) Median real estate property taxes paid for housing units with no mortgage in 2022: $3,626 (1.1%)
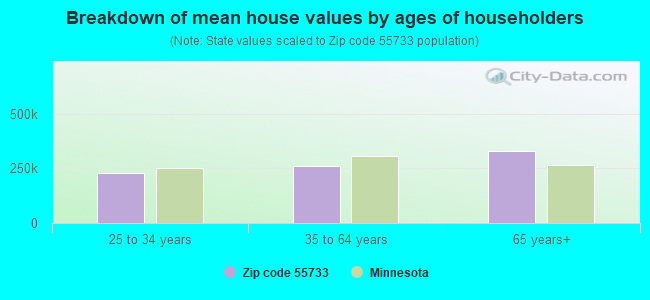
Estimated median house/condo value in 2022: $342,133
55733:
$342,133
Minnesota:
$314,600
Median resident age:
This zip code:
43.8 years
Minnesota median age:
39.0 years
Average household size:
This zip code:
2.5 people
Minnesota:
2.4 people
Averages for the 2020 tax year for zip code 55733, filed in 2021:
Average Adjusted Gross Income (AGI) in 2020: $79,481 (Individual Income Tax Returns)
Here:
$79,481
State:
$82,178
Salary/wage: $68,648 (reported on 83.5% of returns)
Here:
$68,648
State:
$67,438
(% of AGI for various income ranges: 1249.2% for AGIs below $25k, 3311.6% for AGIs $25k-50k, 6360.7% for AGIs $50k-75k, 9351.5% for AGIs $75k-100k, 18416.4% for AGIs $100k-200k, 52420.0% for AGIs over 200k)
Taxable interest for individuals: $618 (reported on 39.7% of returns)
This zip code:
$618
Minnesota:
$1,814
(% of AGI for various income ranges: 8.4% for AGIs below $25k, 23.9% for AGIs $25k-50k, 53.6% for AGIs $50k-75k, 34.5% for AGIs $75k-100k, 43.6% for AGIs $100k-200k, 280.0% for AGIs over 200k)
Ordinary dividends: $2,202 (reported on 23.6% of returns)
Here:
$2,202
State:
$6,928
(% of AGI for various income ranges: 32.7% for AGIs below $25k, 42.3% for AGIs $25k-50k, 58.2% for AGIs $50k-75k, 93.0% for AGIs $75k-100k, 128.3% for AGIs $100k-200k, 480.0% for AGIs over 200k)
Net capital gain/loss in AGI: +$7,848 (reported on 18.2% of returns)
Here:
+$7,848
State:
+$20,591
(% of AGI for various income ranges: 20.3% for AGIs below $25k, 15.8% for AGIs $25k-50k, 85.4% for AGIs $50k-75k, 98.5% for AGIs $75k-100k, 337.5% for AGIs $100k-200k, 4195.0% for AGIs over 200k)
Profit/loss from business: +$14,743 (reported on 15.3% of returns)
Here:
+$14,743
State:
+$14,342
(% of AGI for various income ranges: 50.8% for AGIs below $25k, 138.7% for AGIs $25k-50k, 187.1% for AGIs $50k-75k, 343.5% for AGIs $75k-100k, 516.9% for AGIs $100k-200k, 4412.5% for AGIs over 200k)
Taxable individual retirement arrangement distribution: $17,688 (reported on 13.2% of returns)
55733:
$17,688
Minnesota:
$20,675
(% of AGI for various income ranges: 90.8% for AGIs below $25k, 182.6% for AGIs $25k-50k, 276.8% for AGIs $50k-75k, 572.5% for AGIs $75k-100k, 788.3% for AGIs $100k-200k)
Total itemized deductions: $27,605 (reported on 7.9% of returns)
Here:
$27,605
State:
$33,311
(% of AGI for various income ranges: 130.8% for AGIs below $25k, 336.8% for AGIs $50k-75k, 432.0% for AGIs $75k-100k, 553.1% for AGIs $100k-200k, 2407.5% for AGIs over 200k)
Charity contributions: $6,840 (reported on 6.2% of returns)
Here:
$6,840
State:
$11,879
(% of AGI for various income ranges: 42.5% for AGIs $50k-75k, 58.0% for AGIs $75k-100k, 145.8% for AGIs $100k-200k, 665.0% for AGIs over 200k)
Taxes paid: $8,095 (reported on 7.9% of returns)
55733:
$8,095
State:
$8,252
(% of AGI for various income ranges: 30.5% for AGIs below $25k, 93.6% for AGIs $50k-75k, 123.5% for AGIs $75k-100k, 171.7% for AGIs $100k-200k, 745.0% for AGIs over 200k)
Earned income credit: $1,480 (reported on 6.2% of returns)
Here:
$1,480
State:
$2,055
(% of AGI for various income ranges: 34.9% for AGIs below $25k, 30.0% for AGIs $25k-50k)
Percentage of individuals using paid preparers for their 2020 taxes: 94.2%
Here:
94%
State:
94%
(% for various income ranges: 93.1% for AGIs below $25k, 92.7% for AGIs $25k-50k, 92.7% for AGIs $50k-75k, 93.5% for AGIs $75k-100k, 96.7% for AGIs $100k-200k, 100.0% for AGIs over 200k)
Averages for the 2012 tax year for zip code 55733, filed in 2013:
Average Adjusted Gross Income (AGI) in 2012: $61,774 (Individual Income Tax Returns)
Here:
$61,774
State:
$67,192
Salary/wage: $56,218 (reported on 86.2% of returns)
Here:
$56,218
State:
$55,182
(% of AGI for various income ranges: 74.1% for AGIs below $25k, 74.3% for AGIs $25k-50k, 73.2% for AGIs $50k-75k, 82.7% for AGIs $75k-100k, 84.3% for AGIs $100k-200k, 68.9% for AGIs over 200k)
Taxable interest for individuals: $665 (reported on 41.3% of returns)
This zip code:
$665
Minnesota:
$1,664
(% of AGI for various income ranges: 1.1% for AGIs below $25k, 0.6% for AGIs $25k-50k, 0.8% for AGIs $50k-75k, 0.2% for AGIs $75k-100k, 0.2% for AGIs $100k-200k, 0.7% for AGIs over 200k)
Ordinary dividends: $1,249 (reported on 25.3% of returns)
Here:
$1,249
State:
$5,665
(% of AGI for various income ranges: 0.9% for AGIs below $25k, 0.5% for AGIs $25k-50k, 0.9% for AGIs $50k-75k, 0.4% for AGIs $75k-100k, 0.4% for AGIs $100k-200k, 0.2% for AGIs over 200k)
Net capital gain/loss in AGI: +$4,159 (reported on 17.3% of returns)
Here:
+$4,159
State:
+$16,131
(% of AGI for various income ranges: 0.4% for AGIs $25k-50k, 0.5% for AGIs $75k-100k, 1.0% for AGIs $100k-200k, 6.1% for AGIs over 200k)
Profit/loss from business: +$10,981 (reported on 16.0% of returns)
Here:
+$10,981
State:
+$12,430
(% of AGI for various income ranges: 4.8% for AGIs below $25k, 2.8% for AGIs $25k-50k, 3.0% for AGIs $50k-75k, 2.4% for AGIs $75k-100k, 3.9% for AGIs $100k-200k)
Taxable individual retirement arrangement distribution: $11,969 (reported on 11.6% of returns)
55733:
$11,969
Minnesota:
$15,212
(% of AGI for various income ranges: 3.9% for AGIs below $25k, 3.2% for AGIs $25k-50k, 3.0% for AGIs $50k-75k, 1.7% for AGIs $75k-100k, 2.4% for AGIs $100k-200k)
Total itemized deductions: $20,335 (21% of AGI, reported on 44.9% of returns)
Here:
$20,335
State:
$24,665
Here:
21.2% of AGI
State:
19.6% of AGI
(% of AGI for various income ranges: 8.3% for AGIs below $25k, 12.8% for AGIs $25k-50k, 13.6% for AGIs $50k-75k, 15.6% for AGIs $75k-100k, 17.0% for AGIs $100k-200k, 13.9% for AGIs over 200k)
Charity contributions: $2,744 (reported on 34.7% of returns)
Here:
$2,744
State:
$3,948
(% of AGI for various income ranges: 0.3% for AGIs below $25k, 1.1% for AGIs $25k-50k, 1.3% for AGIs $50k-75k, 1.9% for AGIs $75k-100k, 1.6% for AGIs $100k-200k, 2.1% for AGIs over 200k)
Taxes paid: $8,101 (reported on 44.4% of returns)
55733:
$8,101
State:
$10,589
(% of AGI for various income ranges: 1.9% for AGIs below $25k, 3.7% for AGIs $25k-50k, 4.5% for AGIs $50k-75k, 5.8% for AGIs $75k-100k, 7.7% for AGIs $100k-200k, 7.0% for AGIs over 200k)
Earned income credit: $1,647 (reported on 7.6% of returns)
Here:
$1,647
State:
$2,037
(% of AGI for various income ranges: 2.6% for AGIs below $25k, 0.5% for AGIs $25k-50k)
Percentage of individuals using paid preparers for their 2012 taxes: 55.6%
Here:
56%
State:
55%
(% for various income ranges: 43.3% for AGIs below $25k, 55.6% for AGIs $25k-50k, 63.2% for AGIs $50k-75k, 61.1% for AGIs $75k-100k, 61.8% for AGIs $100k-200k, 80.0% for AGIs over 200k)
Averages for the 2004 tax year for zip code 55733, filed in 2005:
Average Adjusted Gross Income (AGI) in 2004: $47,981 (Individual Income Tax Returns)
Here:
$47,981
State:
$53,560
Salary/wage: $44,186 (reported on 87.8% of returns)
Here:
$44,186
State:
$46,177
(% of AGI for various income ranges: 95.9% for AGIs below $10k, 69.7% for AGIs $10k-25k, 78.4% for AGIs $25k-50k, 87.4% for AGIs $50k-75k, 86.3% for AGIs $75k-100k, 71.9% for AGIs over 100k)
Taxable interest for individuals: $817 (reported on 59.6% of returns)
This zip code:
$817
Minnesota:
$1,796
(% of AGI for various income ranges: 2.7% for AGIs below $10k, 1.6% for AGIs $10k-25k, 1.2% for AGIs $25k-50k, 0.7% for AGIs $50k-75k, 0.7% for AGIs $75k-100k, 1.3% for AGIs over 100k)
Taxable dividends: $950 (reported on 26.5% of returns)
Here:
$950
State:
$3,096
(% of AGI for various income ranges: 1.8% for AGIs below $10k, 1.1% for AGIs $10k-25k, 0.5% for AGIs $25k-50k, 0.3% for AGIs $50k-75k, 0.3% for AGIs $75k-100k, 0.9% for AGIs over 100k)
Net capital gain/loss: +$7,170 (reported on 19.1% of returns)
Here:
+$7,170
State:
+$10,864
(% of AGI for various income ranges: -2.1% for AGIs below $10k, -0.1% for AGIs $10k-25k, 0.4% for AGIs $25k-50k, 0.3% for AGIs $50k-75k, 0.6% for AGIs $75k-100k, 11.1% for AGIs over 100k)
Profit/loss from business: +$7,928 (reported on 16.4% of returns)
Here:
+$7,928
State:
+$10,442
(% of AGI for various income ranges: -4.6% for AGIs below $10k, 4.2% for AGIs $10k-25k, 3.8% for AGIs $25k-50k, 1.8% for AGIs $50k-75k, 2.3% for AGIs $75k-100k, 3.5% for AGIs over 100k)
IRA payment deduction: $2,671 (reported on 3.6% of returns)
55733:
$2,671
Minnesota:
$2,955
Self-employed pension: $4,909 (reported on 0.5% of returns)
Here:
$4,909
Minnesota:
$12,099
Total itemized deductions: $16,261 (22% of AGI, reported on 45.2% of returns)
Here:
$16,261
State:
$20,035
Here:
21.8% of AGI
State:
21.3% of AGI
(% of AGI for various income ranges: 10.6% for AGIs $10k-25k, 14.2% for AGIs $25k-50k, 15.5% for AGIs $50k-75k, 16.2% for AGIs $75k-100k, 17.4% for AGIs over 100k)
Charity contributions deductions: $2,396 (3% of AGI, reported on 39.3% of returns)
Here:
$2,396
State:
$3,333
Here:
3.1% of AGI
State:
3.4% of AGI
(% of AGI for various income ranges: 1.0% for AGIs $10k-25k, 1.3% for AGIs $25k-50k, 1.9% for AGIs $50k-75k, 1.9% for AGIs $75k-100k, 3.0% for AGIs over 100k)
Total tax: $5,471 (reported on 81.5% of returns)
55733:
$5,471
State:
$8,485
(% of AGI for various income ranges: 2.5% for AGIs below $10k, 4.8% for AGIs $10k-25k, 6.9% for AGIs $25k-50k, 7.5% for AGIs $50k-75k, 9.3% for AGIs $75k-100k, 14.9% for AGIs over 100k)
Earned income credit: $1,320 (reported on 7.4% of returns)
Here:
$1,320
State:
$1,523
Percentage of individuals using paid preparers for their 2004 taxes: 54.5%
Here:
54%
State:
59%
(% for various income ranges: 36.5% for AGIs below $10k, 51.9% for AGIs $10k-25k, 61.4% for AGIs $25k-50k, 56.1% for AGIs $50k-75k, 58.8% for AGIs $75k-100k, 70.0% for AGIs over 100k)
Household received Food Stamps/SNAP in the past 12 months: 45 Household did not receive Food Stamps/SNAP in the past 12 months: 2,049
Women who had a birth in the past 12 months: 47 (34 now married, 12 unmarried) Women who did not have a birth in the past 12 months: 1,049 (745 now married, 306 unmarried)
Housing units in zip code 55733 with a mortgage: 1,547 (172 second mortgage, 115 both second mortgage and home equity loan) Median monthly owner costs for units with a mortgage: $1,804 Median monthly owner costs for units without a mortgage: $653
Residents with income below the poverty level in 2022:
This zip code:
5.2%
Whole state:
9.6%
Residents with income below 50% of the poverty level in 2022:
This zip code:
3.5%
Whole state:
5.2%
Median number of rooms in houses and condos:
Here:
7.1
State:
7.1
Median number of rooms in apartments:
Here:
4.2
State:
3.8
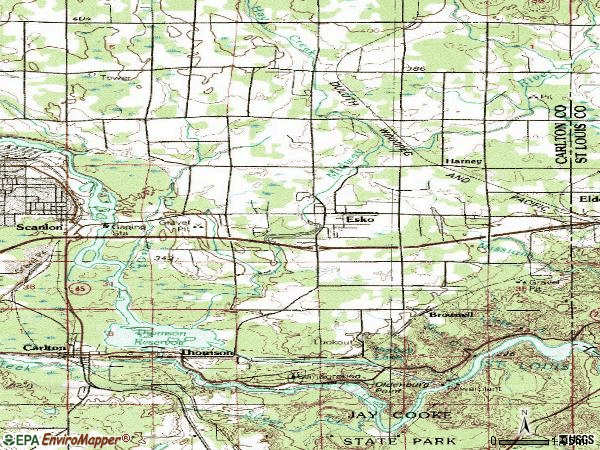
Notable locations in this zip code not listed on our city pages
Churches in zip code 55733 include: Apostolic Church (A), Finnish Church (B), Saint Mathews Church (C), Duluth Apostolic Lutheran Church (D), Northwood United Methodist Church (E), Breath of Life Christian Church (F), Saint Matthew's Lutheran Church (G). Display/hide their locations on the map
Parks in zip code 55733 include: Jay Cooke State Park Geological Marker (1), Henry C Hornby Historical Marker (2), Henry Oldenburg Historical Marker (3), J Rodney Paine Historical Marker (4), Joshiah B Scovell Historical Marker (5). Display/hide their locations on the map
Tourist attractions (not listed on the city page) : Knife Island Campground (Cultural Attractions- Events- & Facilities; 234 West Highway 61) (1), Ben's Wholesale (Amusement & Theme Parks; 84 Erickson Road) (2). Display/hide their approximate locations on the map
In group quarters: 4 (-1 institutionalized population)
Size of family households: 639 2-persons, 484 3-persons, 455 4-persons, 86 5-persons, 25 6-persons, 11 7-or-more-persons
Size of nonfamily households: 336 1-person, 46 2-persons
907 married couples with children.
238 single-parent households (25 men, 213 women).
98.4% of residents of 55733 zip code speak English at home.
0.2% of residents speak Spanish at home (100% very well).
0.5% of residents speak other language at home (100% very well).
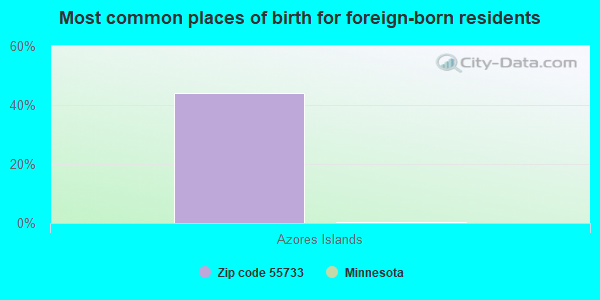
Foreign born population: 42 (0.8%) (32.2% of them are naturalized citizens)
This zip code:
0.8%
Whole state:
8.7%
44%Azores Islands
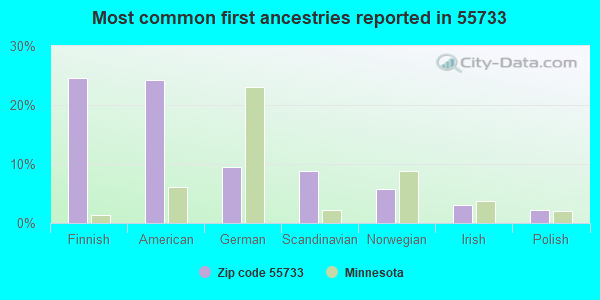
25%Finnish
24%American
9%German
9%Scandinavian
6%Norwegian
3%Irish
2%Polish
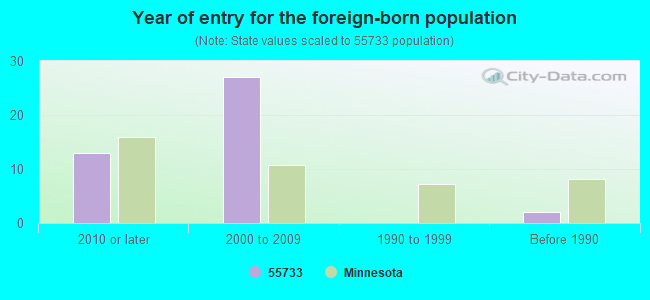
Year of entry for the foreign-born population
132010 or later
272000 to 2009
01990 to 1999
2Before 1990
Facilities with environmental interests located in this zip code:
MISSISSIPPI TRANSPORT INL (101 E HWY 61 in ESKO, MN)
STATE MASTER (Minnesota Pollution Control Agency permits and compilance tracking) - RCRAINFO-MND985753680, CESQG, RCRIS-MND985753680, (Resource Conservation and Recovery Act (tracking hazardous waste)) Business SIC classification: REPAIR SHOPS AND RELATED SERVICES Business NAICS classification: COMMERCIAL AND INDUSTRIAL MACHINERY AND EQUIPMENT (EXCEPT AUTOMOTIVE AND ELECTRONIC) REPAIR AND MAINTENANCE. Organizations: DONN HANSEN S WELDING & TANK TRUCK SVC (CONTACT/OWNER)
, DONN HANSEN`S WELDING & TANK TRUCK SVC (CONTACT/OWNER)
Alternative names: MISSISSIPPI TRANSPORT INC
NORTHRIDGE SERVICES (158 N CLOQUET RD E in ESKO, MN)
STATE MASTER (Minnesota Pollution Control Agency permits and compilance tracking) - RCRAINFO-MND985680263, CESQG, RCRIS-MND985680263, Small Quantity Generators, between 100 kg and 1000 kg of hazardous waste/month (Resource Conservation and Recovery Act (tracking hazardous waste)) - notification Business SIC classification: ELECTRICAL MACHINERY, EQUIPMENT, AND SUPPLIES Organizations: SHARKEY ROBERT A (CONTACT/OWNER)
ESKO AUTO BODY (28 JAY COOKE RD in ESKO, MN)
STATE MASTER (Minnesota Pollution Control Agency permits and compilance tracking) - RCRAINFO-MNR000009555, CESQG, RCRIS-MNR000009555, Conditionally Exempt Small Quantity Generators, less than 100 kg/month of hazardous waste (Resource Conservation and Recovery Act (tracking hazardous waste)) - notification Organizations: LAWRENCE A SMITH (CONTACT/OWNER)
ESKO ISD 99 BUS GARAGE SITE (CANOSIA RD in ESKO, MN)
STATE MASTER (Minnesota Pollution Control Agency permits and compilance tracking) - RCRAINFO-MND985754092, CESQG, RCRIS-MND985754092, HAZARDOUS WASTE PROGRAM Conditionally Exempt Small Quantity Generators, less than 100 kg/month of hazardous waste (Resource Conservation and Recovery Act (tracking hazardous waste)) - notification
HANSEN MICHAEL R TRUCKING (183 MITZNER RD in ESKO, MN)
Small Quantity Generators, between 100 kg and 1000 kg of hazardous waste/month (Resource Conservation and Recovery Act (tracking hazardous waste)) - notification
MIKES OUTBOARD RPR (177 THOMSON RD in ESKO, MN)
Conditionally Exempt Small Quantity Generators, less than 100 kg/month of hazardous waste (Resource Conservation and Recovery Act (tracking hazardous waste)) - notification Organizations: TRIFILETTE MIKE (CONTACT/OWNER)
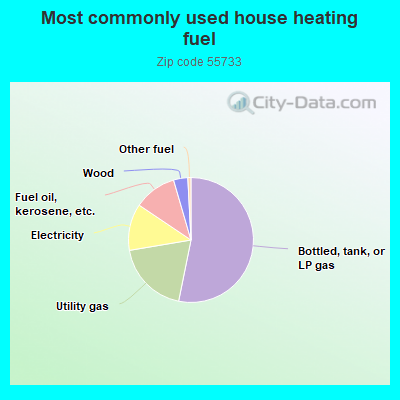
53.3%Bottled, tank, or LP gas
19.2%Utility gas
12.1%Electricity
11.1%Fuel oil, kerosene, etc.
3.7%Wood
0.8%Other fuel
Population in 1990: 4,102. Population change in the 1990s: +4 (+0.1%).
Place of birth for U.S.-born residents:
This state: 4,498
Northeast: 73
Midwest: 474
South: 1
West: 213
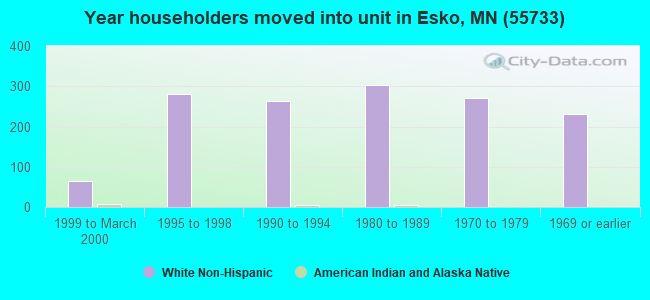
78% of the 55733 zip code residents lived in the same house 5 years ago. Out of people who lived in different houses, 44% lived in this county. Out of people who lived in different counties, 50% lived in Minnesota.
98% of the 55733 zip code residents lived in the same house 1 year ago. Out of people who lived in different houses, 74% moved from this county. Out of people who lived in different houses, 33% moved from different county within same state.
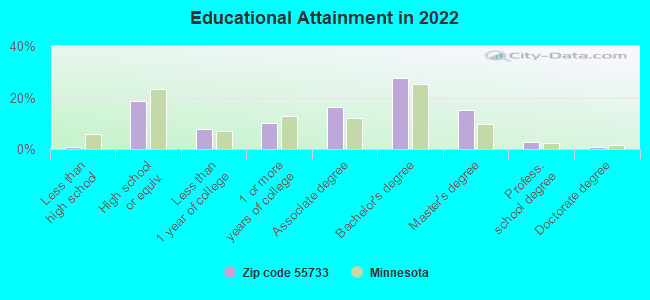
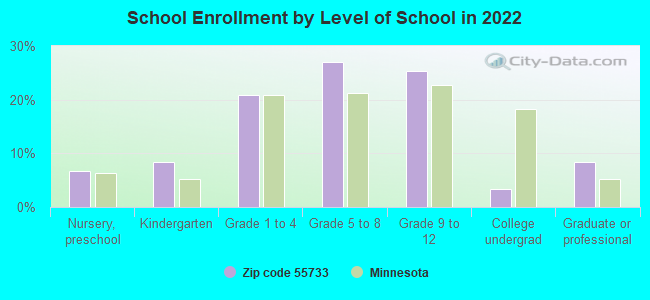
Private vs. public school enrollment:
Students in private schools in grades 1 to 8 (elementary and middle school): 25
Here:
4.4%
Minnesota:
12.9%
Students in private schools in grades 9 to 12 (high school):
Here:
0.0%
Minnesota:
8.6%
Students in private undergraduate colleges:
Here:
0.0%
Minnesota:
26.2%
Occupation by median earnings in the past 12 months ($)
111,421Health diagnosing and treating practitioners and other technical occupations
87,037Production occupations
83,773Law enforcement workers including supervisors
79,933Management occupations
74,020Installation, maintenance, and repair occupations
66,207Education, training, and library occupations
Companies with federal contracts located in this zip code:
ERNIE LEON (24 ROGER DRIVE in ESKO, MN; small business) : $231,870 in 8 contractsfrom 2000 to 2004
Contracts for Maintenance, Repair and Rebuilding of Equipment -- Aircraft Launching, Landing, and Ground Handling Equipment, Maintenance, Repair and Rebuilding of Equipment -- Miscellaneous, Meteorological Instruments and Apparatus by Army Signed by year:2000: $57,960; 2001: $55,560; 2002: $55,560; 2003: $13,890; 2004: $48,900; 2005: $0; 2006: $0.
Biggest contracts:
$57,960 with Army for Maintenance, Repair and Rebuilding of Equipment -- Aircraft Launching, Landing, and Ground Handling Equipment. Signed on 2000-05-04. Completion date: 2003-09-30.
$55,560, same as above.Signed on 2002-10-01. Completion date: 2003-09-30.
$55,560, same as above.Signed on 2001-10-03. Completion date: 2003-09-30.
$32,000 with Army for Maintenance, Repair and Rebuilding of Equipment -- Miscellaneous. Signed on 2004-06-02. Completion date: 2004-09-30.
M J WIDDES INC (93 W HIGHWAY 61 in ESKO, MN; small business)
$8,270 with Army for Trailers. Signed on 2005-09-22. Completion date: 2005-11-07.
Top industries in this zip code by the number of employees in 2005:
Finance and Insurance: Direct Property and Casualty Insurance Carriers (50-99 employees: 1 establishment)
Wholesale Trade: Toy and Hobby Goods and Supplies Merchant Wholesalers (20-49: 1)
Health Care and Social Assistance: Child Day Care Services (5-9: 2, 1-4: 2)
Accommodation and Food Services: Drinking Places (Alcoholic Beverages) (10-19: 1)
Other Services (except Public Administration): Labor Unions and Similar Labor Organizations (5-9: 2)
People in group quarters in 2010:
3 people in group homes intended for adults
People in group quarters in 2000:
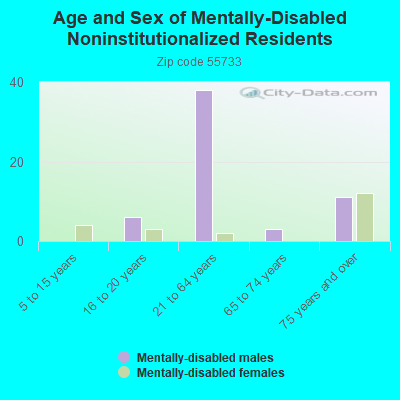
6 people in homes for the mentally retarded
Fatal accident statistics in 2013:
Fatal accident count: 1
Vehicles involved in fatal accidents: 2
Fatal accidents caused by drunken drivers: 1
Fatalities: 1
Persons involved in fatal accidents: 3
Pedestrians involved in fatal accidents: 0
Fatal accident statistics in 2011:
Fatal accident count: 2
Vehicles involved in fatal accidents: 3
Fatal accidents caused by drunken drivers: 1
Fatalities: 2
Persons involved in fatal accidents: 4
Pedestrians involved in fatal accidents: 0
Home Mortgage Disclosure Act Aggregated Statistics For Year 2009 (Based on 2 partial tracts)
A) FHA, FSA/RHS & VA Home Purchase Loans
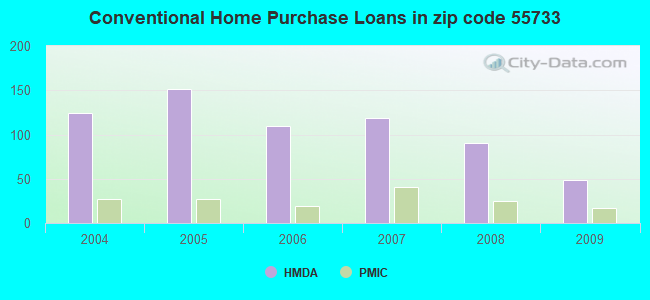
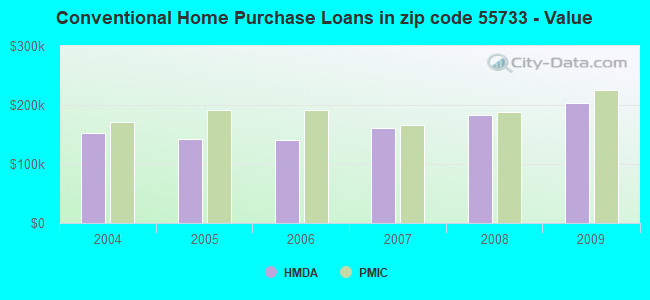
B) Conventional Home Purchase Loans
C) Refinancings
D) Home Improvement Loans
F) Non-occupant Loans on < 5 Family Dwellings (A B C & D)
G) Loans On Manufactured Home Dwelling (A B C & D)
Number
Average Value
Number
Average Value
Number
Average Value
Number
Average Value
Number
Average Value
Number
Average Value
LOANS ORIGINATED
32
$170,194
49
$202,831
344
$167,012
39
$52,123
7
$79,376
8
$131,074
APPLICATIONS APPROVED, NOT ACCEPTED
2
$123,660
5
$220,220
24
$196,998
2
$6,775
0
$0
2
$95,710
APPLICATIONS DENIED
2
$116,040
10
$167,537
66
$187,854
20
$40,063
2
$33,880
2
$110,110
APPLICATIONS WITHDRAWN
0
$0
3
$206,667
58
$186,369
2
$16,940
2
$171,940
0
$0
FILES CLOSED FOR INCOMPLETENESS
2
$116,040
0
$0
19
$173,591
5
$77,924
0
$0
2
$49,125
Aggregated Statistics For Year 2008 (Based on 2 partial tracts)
A) FHA, FSA/RHS & VA Home Purchase Loans
B) Conventional Home Purchase Loans
C) Refinancings
D) Home Improvement Loans
E) Loans on Dwellings For 5+ Families
F) Non-occupant Loans on < 5 Family Dwellings (A B C & D)
G) Loans On Manufactured Home Dwelling (A B C & D)
Number
Average Value
Number
Average Value
Number
Average Value
Number
Average Value
Number
Average Value
Number
Average Value
Number
Average Value
LOANS ORIGINATED
22
$163,394
90
$183,837
139
$159,626
34
$47,482
0
$0
14
$118,580
10
$119,766
APPLICATIONS APPROVED, NOT ACCEPTED
0
$0
3
$139,473
30
$157,316
2
$105,030
0
$0
0
$0
2
$49,125
APPLICATIONS DENIED
5
$128,406
5
$114,854
78
$178,912
12
$121,403
2
$405,715
2
$80,465
8
$114,769
APPLICATIONS WITHDRAWN
3
$201,020
7
$180,290
34
$200,440
5
$159,914
0
$0
0
$0
2
$46,585
FILES CLOSED FOR INCOMPLETENESS
0
$0
2
$143,990
12
$203,562
2
$12,705
0
$0
2
$32,185
0
$0
Aggregated Statistics For Year 2007 (Based on 2 partial tracts)
A) FHA, FSA/RHS & VA Home Purchase Loans
B) Conventional Home Purchase Loans
C) Refinancings
D) Home Improvement Loans
F) Non-occupant Loans on < 5 Family Dwellings (A B C & D)
G) Loans On Manufactured Home Dwelling (A B C & D)
Number
Average Value
Number
Average Value
Number
Average Value
Number
Average Value
Number
Average Value
Number
Average Value
LOANS ORIGINATED
8
$199,892
119
$161,499
171
$137,373
54
$41,817
10
$136,367
20
$114,599
APPLICATIONS APPROVED, NOT ACCEPTED
0
$0
8
$183,799
25
$145,413
8
$52,726
0
$0
0
$0
APPLICATIONS DENIED
3
$199,893
7
$125,356
73
$146,195
14
$98,373
3
$245,067
5
$65,050
APPLICATIONS WITHDRAWN
2
$182,105
3
$135,520
30
$176,458
7
$117,611
0
$0
0
$0
FILES CLOSED FOR INCOMPLETENESS
0
$0
3
$245,630
10
$164,487
3
$180,693
0
$0
0
$0
Aggregated Statistics For Year 2006 (Based on 2 partial tracts)
A) FHA, FSA/RHS & VA Home Purchase Loans
B) Conventional Home Purchase Loans
C) Refinancings
D) Home Improvement Loans
F) Non-occupant Loans on < 5 Family Dwellings (A B C & D)
G) Loans On Manufactured Home Dwelling (A B C & D)
Number
Average Value
Number
Average Value
Number
Average Value
Number
Average Value
Number
Average Value
Number
Average Value
LOANS ORIGINATED
3
$214,573
110
$141,403
207
$132,811
69
$53,619
7
$67,760
17
$59,589
APPLICATIONS APPROVED, NOT ACCEPTED
0
$0
14
$141,449
32
$133,402
2
$67,760
0
$0
2
$123,660
APPLICATIONS DENIED
0
$0
27
$171,721
85
$144,927
15
$46,190
14
$183,920
10
$97,236
APPLICATIONS WITHDRAWN
0
$0
7
$171,579
56
$187,792
7
$72,116
2
$172,790
2
$109,265
FILES CLOSED FOR INCOMPLETENESS
0
$0
3
$150,200
25
$174,888
3
$33,317
3
$215,703
0
$0
Aggregated Statistics For Year 2005 (Based on 2 partial tracts)
A) FHA, FSA/RHS & VA Home Purchase Loans
B) Conventional Home Purchase Loans
C) Refinancings
D) Home Improvement Loans
E) Loans on Dwellings For 5+ Families
F) Non-occupant Loans on < 5 Family Dwellings (A B C & D)
G) Loans On Manufactured Home Dwelling (A B C & D)
Number
Average Value
Number
Average Value
Number
Average Value
Number
Average Value
Number
Average Value
Number
Average Value
Number
Average Value
LOANS ORIGINATED
7
$177,386
151
$141,578
257
$136,693
75
$45,557
0
$0
27
$168,521
19
$104,226
APPLICATIONS APPROVED, NOT ACCEPTED
0
$0
17
$143,791
49
$113,221
7
$86,394
0
$0
2
$152,460
0
$0
APPLICATIONS DENIED
0
$0
15
$108,868
90
$107,117
19
$51,355
2
$169,400
7
$77,440
5
$92,154
APPLICATIONS WITHDRAWN
2
$219,375
3
$164,883
95
$148,198
5
$415,368
0
$0
2
$77,925
7
$122,451
FILES CLOSED FOR INCOMPLETENESS
0
$0
5
$154,492
37
$148,202
0
$0
0
$0
2
$88,090
0
$0
Aggregated Statistics For Year 2004 (Based on 2 partial tracts)
A) FHA, FSA/RHS & VA Home Purchase Loans
B) Conventional Home Purchase Loans
C) Refinancings
D) Home Improvement Loans
F) Non-occupant Loans on < 5 Family Dwellings (A B C & D)
G) Loans On Manufactured Home Dwelling (A B C & D)
Detailed PMIC statistics for the following Tracts:9703.00
2002 - 2018 National Fire Incident Reporting System (NFIRS) incidents
Based on the data from the years 2002 - 2018 the average number of fire incidents per year is 17. The highest number of fires - 29 took place in 2009, and the least - 6 in 2010. The data has a growing trend.
When looking into fire subcategories, the most incidents belonged to: Structure Fires (42.3%), and Outside Fires (38.8%).
Fire incident types reported to NFIRS in Zip Code 55733


 Nearest zip codes: 55810, 55808, 55797, 55718, 55720, 55811.


 Based on the data from the years 2002 - 2018 the average number of fire incidents per year is 17. The highest number of fires - 29 took place in 2009, and the least - 6 in 2010. The data has a growing trend.
 When looking into fire subcategories, the most incidents belonged to: Structure Fires (42.3%), and Outside Fires (38.8%).