Estimated zip code population in 2022: 562 Zip code population in 2010: 607 Zip code population in 2000: 514
Houses and condos: 249 Renter-occupied apartments: 33
% of renters here:
17%
State:
28%
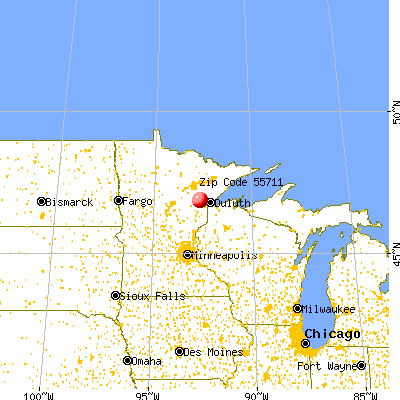
March 2022 cost of living index in zip code 55711: 87.4 (less than average, U.S. average is 100)
Land area: 67.6 sq. mi. Water area: 1.0 sq. mi.
Population density: 8 people per square mile
(very low).
OSM Map
General Map
Google Map
MSN Map
OSM Map
General Map
Google Map
MSN Map
OSM Map
General Map
Google Map
MSN Map
OSM Map
General Map
Google Map
MSN Map
Please wait while loading the map...
Real estate property taxes paid for housing units in 2022:
This zip code:
0.7% ($1,367)
Minnesota:
1.0% ($3,087)
Median real estate property taxes paid for housing units with mortgages in 2022: $1,391 (0.6%) Median real estate property taxes paid for housing units with no mortgage in 2022: $1,311 (0.7%)
Business Search- 14 Million verified businesses
Males: 278
(49.5%)
Females: 284
(50.5%)
For population 25 years and over in 55711:
High school or higher: 89.2%
Bachelor's degree or higher: 9.4%
Graduate or professional degree: 1.0%
Unemployed: 5.5%
Mean travel time to work (commute): 31.7 minutes
For population 15 years and over in 55711:
Never married: 28.3%
Now married: 37.3%
Separated: 0.9%
Widowed: 6.0%
Divorced: 27.5%
Zip code 55711 compared to state average:
Median household income below state average.
Unemployed percentage above state average.
Black race population percentage significantly below state average.
Hispanic race population percentage significantly below state average.
Foreign-born population percentage significantly below state average.
Renting percentage below state average.
Length of stay since moving in significantly above state average.
Number of college students below state average.
Percentage of population with a bachelor's degree or higher significantly below state average.
Estimated median house/condo value in 2022: $210,282
55711:
$210,282
Minnesota:
$314,600
Median resident age:
This zip code:
38.1 years
Minnesota median age:
39.0 years
Average household size:
This zip code:
2.3 people
Minnesota:
2.4 people
Averages for the 2020 tax year for zip code 55711, filed in 2021:
Average Adjusted Gross Income (AGI) in 2020: $56,815 (Individual Income Tax Returns)
Here:
$56,815
State:
$82,178
Salary/wage: $51,648 (reported on 85.2% of returns)
Here:
$51,648
State:
$67,438
(% of AGI for various income ranges: 1208.0% for AGIs below $25k, 4244.0% for AGIs $25k-50k, 7472.0% for AGIs $50k-75k, 18056.7% for AGIs $100k-200k)
Taxable interest for individuals: $120 (reported on 18.5% of returns)
This zip code:
$120
Minnesota:
$1,814
(% of AGI for various income ranges: 12.0% for AGIs $50k-75k)
Ordinary dividends: $200 (reported on 11.1% of returns)
Here:
$200
State:
$6,928
(% of AGI for various income ranges: 12.0% for AGIs $25k-50k)
Net capital gain/loss in AGI: +$2,367 (reported on 11.1% of returns)
Here:
+$2,367
State:
+$20,591
(% of AGI for various income ranges: 142.0% for AGIs $25k-50k)
Earned income credit: $1,750 (reported on 14.8% of returns)
Here:
$1,750
State:
$2,055
(% of AGI for various income ranges: 38.0% for AGIs below $25k, 102.0% for AGIs $25k-50k)
Percentage of individuals using paid preparers for their 2020 taxes: 96.3%
Here:
96%
State:
94%
(% for various income ranges: 100.0% for AGIs below $25k, 85.7% for AGIs $25k-50k, 100.0% for AGIs $50k-75k, 100.0% for AGIs $100k-200k)
Averages for the 2012 tax year for zip code 55711, filed in 2013:
Average Adjusted Gross Income (AGI) in 2012: $44,343 (Individual Income Tax Returns)
Here:
$44,343
State:
$67,192
Salary/wage: $43,300 (reported on 78.3% of returns)
Here:
$43,300
State:
$55,182
(% of AGI for various income ranges: 64.6% for AGIs below $25k, 76.6% for AGIs $25k-50k, 76.7% for AGIs $50k-75k, 162.5% for AGIs $75k-100k)
Taxable interest for individuals: $217 (reported on 26.1% of returns)
This zip code:
$217
Minnesota:
$1,664
Ordinary dividends: $367 (reported on 13.0% of returns)
Here:
$367
State:
$5,665
Net capital gain/loss in AGI: +$4,250 (reported on 8.7% of returns)
Here:
+$4,250
State:
+$16,131
Profit/loss from business: +$4,875 (reported on 17.4% of returns)
Here:
+$4,875
State:
+$12,430
Total itemized deductions: $21,743 (32% of AGI, reported on 30.4% of returns)
Here:
$21,743
State:
$24,665
Here:
31.6% of AGI
State:
19.6% of AGI
Charity contributions: $1,525 (reported on 17.4% of returns)
Here:
$1,525
State:
$3,948
Taxes paid: $4,600 (reported on 30.4% of returns)
55711:
$4,600
State:
$10,589
Earned income credit: $2,400 (reported on 17.4% of returns)
Here:
$2,400
State:
$2,037
(% of AGI for various income ranges: 8.9% for AGIs below $25k)
Percentage of individuals using paid preparers for their 2012 taxes: 60.9%
Here:
61%
State:
55%
(% for various income ranges: 50.0% for AGIs below $25k, 66.7% for AGIs $25k-50k, 50.0% for AGIs $50k-75k, 133.3% for AGIs $75k-100k)
Averages for the 2004 tax year for zip code 55711, filed in 2005:
Average Adjusted Gross Income (AGI) in 2004: $34,300 (Individual Income Tax Returns)
Here:
$34,300
State:
$53,560
Salary/wage: $33,240 (reported on 83.5% of returns)
Here:
$33,240
State:
$46,177
(% of AGI for various income ranges: 81.0% for AGIs below $10k, 73.1% for AGIs $10k-25k, 87.7% for AGIs $25k-50k, 86.6% for AGIs $50k-75k, 67.2% for AGIs $75k-100k)
Taxable interest for individuals: $420 (reported on 40.5% of returns)
This zip code:
$420
Minnesota:
$1,796
Taxable dividends: $321 (reported on 14.0% of returns)
Here:
$321
State:
$3,096
Net capital gain/loss: +$1,480 (reported on 12.5% of returns)
Here:
+$1,480
State:
+$10,864
Profit/loss from business: +$474 (reported on 9.5% of returns)
Here:
+$474
State:
+$10,442
Total itemized deductions: $14,895 (29% of AGI, reported on 28.5% of returns)
Here:
$14,895
State:
$20,035
Here:
29.1% of AGI
State:
21.3% of AGI
Charity contributions deductions: $1,048 (2% of AGI, reported on 21.0% of returns)
Here:
$1,048
State:
$3,333
Here:
1.9% of AGI
State:
3.4% of AGI
Total tax: $3,290 (reported on 72.5% of returns)
55711:
$3,290
State:
$8,485
(% of AGI for various income ranges: 1.1% for AGIs below $10k, 3.8% for AGIs $10k-25k, 5.3% for AGIs $25k-50k, 7.9% for AGIs $50k-75k, 10.8% for AGIs $75k-100k)
Earned income credit: $1,250 (reported on 16.0% of returns)
Here:
$1,250
State:
$1,523
Percentage of individuals using paid preparers for their 2004 taxes: 61.0%
Here:
61%
State:
59%
(% for various income ranges: 48.6% for AGIs below $10k, 54.9% for AGIs $10k-25k, 68.9% for AGIs $25k-50k, 60.0% for AGIs $50k-75k, 81.2% for AGIs $75k-100k)
Household received Food Stamps/SNAP in the past 12 months: 18 Household did not receive Food Stamps/SNAP in the past 12 months: 173
Women who had a birth in the past 12 months: 7 (6 now married, 0 unmarried) Women who did not have a birth in the past 12 months: 133 (36 now married, 97 unmarried)
Housing units in zip code 55711 with a mortgage: 99 (12 second mortgage, 13 both second mortgage and home equity loan) Median monthly owner costs for units with a mortgage: $1,349 Median monthly owner costs for units without a mortgage: $443
Residents with income below the poverty level in 2022:
This zip code:
32.0%
Whole state:
9.6%
Residents with income below 50% of the poverty level in 2022:
This zip code:
8.7%
Whole state:
5.2%
Median number of rooms in houses and condos:
Here:
5.4
State:
7.1
Median number of rooms in apartments:
Here:
3.8
State:
3.8
Notable locations in this zip code not listed on our city pages
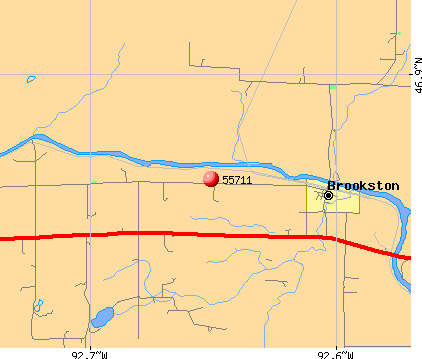
Notable locations in zip code 55711: Brookston Station (A), Congo Station (B), Arrowhead Fire Department (C), Culver Fire Department (D). Display/hide their locations on the map
60 married couples with children.
27 single-parent households (8 men, 19 women).
98.0% of residents of 55711 zip code speak English at home.
0.2% of residents speak other Indo-European language at home (100% very well).
1.3% of residents speak other language at home (100% very well).
Foreign born population: 3 (0.6%) (100.0% of them are naturalized citizens)
This zip code:
0.6%
Whole state:
8.7%
33%Romania
13%German
11%American
10%Irish
9%Swedish
8%Finnish
6%Polish
4%Scandinavian
Year of entry for the foreign-born population
02010 or later
02000 to 2009
01990 to 1999
2Before 1990
Facilities with environmental interests located in this zip code:
FOND DU LAC GAS & GROCERY (1510 BIG LAKE ROAD in CLOQUET, MN) . Tribal Land
ENFORCEMENT/COMPLIANCE ACTIVITY (Integrated Compliance Information System)
MSC STORE (5344 LAKE SHORE DRIVE in NETT LAKE, MN) . Tribal Land
ENFORCEMENT/COMPLIANCE ACTIVITY (Integrated Compliance Information System)
Housing units lacking complete plumbing facilities: 7.3% Housing units lacking complete kitchen facilities: 7.8%
61.5%Bottled, tank, or LP gas
14.2%Wood
12.0%Fuel oil, kerosene, etc.
10.3%Electricity
1.6%Utility gas
1.6%Other fuel
Population in 1990: 621.
Place of birth for U.S.-born residents:
This state: 452
Midwest: 88
South: 3
West: 11
69% of the 55711 zip code residents lived in the same house 5 years ago. Out of people who lived in different houses, 77% lived in this county. Out of people who lived in different counties, 50% lived in Minnesota.
79% of the 55711 zip code residents lived in the same house 1 year ago. Out of people who lived in different houses, 24% moved from this county. Out of people who lived in different houses, 8% moved from different county within same state. Out of people who lived in different houses, 76% moved from different state.
Private vs. public school enrollment:
Students in private schools in grades 1 to 8 (elementary and middle school): 8
Here:
19.6%
Minnesota:
12.9%
Students in private schools in grades 9 to 12 (high school): 5
Here:
16.9%
Minnesota:
8.6%
Students in private undergraduate colleges:
Here:
0.0%
Minnesota:
26.2%
Occupation by median earnings in the past 12 months ($)
72,006Health diagnosing and treating practitioners and other technical occupations
70,143Material moving occupations
68,088Computer and mathematical occupations
66,165Construction and extraction occupations
63,451Production occupations
57,623Business and financial operations occupations
Top industries in this zip code by the number of employees in 2005:
Health Care and Social Assistance: Residential Mental Retardation Facilities (20-49 employees: 1 establishment)
Accommodation and Food Services: Rooming and Boarding Houses (10-19: 1, 5-9: 1)
Health Care and Social Assistance: Services for the Elderly and Persons with Disabilities (10-19: 1)
Construction: New Single-Family Housing Construction (except Operative Builders) (5-9: 1, 1-4: 1)
Health Care and Social Assistance: Homes for the Elderly (5-9: 1, 1-4: 1)
Accommodation and Food Services: Drinking Places (Alcoholic Beverages) (5-9: 1)
Construction: Framing Contractors (1-4: 1)
Other Services (except Public Administration): Beauty Salons (1-4: 1)
People in group quarters in 2010:
89 people in group homes intended for adults
9 people in nursing facilities/skilled-nursing facilities
7 people in workers' group living quarters and job corps centers
People in group quarters in 2000:
36 people in homes for the mentally retarded
18 people in homes for the mentally ill
Home Mortgage Disclosure Act Aggregated Statistics For Year 2009 (Based on 2 partial tracts)
A) FHA, FSA/RHS & VA Home Purchase Loans
B) Conventional Home Purchase Loans
C) Refinancings
D) Home Improvement Loans
F) Non-occupant Loans on < 5 Family Dwellings (A B C & D)
G) Loans On Manufactured Home Dwelling (A B C & D)
Number
Average Value
Number
Average Value
Number
Average Value
Number
Average Value
Number
Average Value
Number
Average Value
LOANS ORIGINATED
1
$156,730
2
$111,305
13
$143,024
2
$47,460
2
$134,140
3
$84,390
APPLICATIONS APPROVED, NOT ACCEPTED
0
$0
0
$0
1
$58,240
0
$0
0
$0
0
$0
APPLICATIONS DENIED
0
$0
1
$86,600
5
$158,118
0
$0
0
$0
1
$85,580
APPLICATIONS WITHDRAWN
0
$0
1
$44,150
1
$233,480
0
$0
0
$0
0
$0
FILES CLOSED FOR INCOMPLETENESS
0
$0
0
$0
0
$0
0
$0
0
$0
0
$0
Aggregated Statistics For Year 2008 (Based on 2 partial tracts)
B) Conventional Home Purchase Loans
C) Refinancings
D) Home Improvement Loans
F) Non-occupant Loans on < 5 Family Dwellings (A B C & D)
G) Loans On Manufactured Home Dwelling (A B C & D)
Number
Average Value
Number
Average Value
Number
Average Value
Number
Average Value
Number
Average Value
LOANS ORIGINATED
2
$108,080
8
$146,112
2
$47,545
1
$136,860
1
$46,860
APPLICATIONS APPROVED, NOT ACCEPTED
1
$101,030
1
$125,650
0
$0
1
$116,310
0
$0
APPLICATIONS DENIED
0
$0
4
$106,082
1
$33,280
0
$0
1
$80,660
APPLICATIONS WITHDRAWN
1
$68,940
3
$134,990
0
$0
1
$119,370
1
$63,840
FILES CLOSED FOR INCOMPLETENESS
0
$0
1
$81,670
0
$0
0
$0
0
$0
Aggregated Statistics For Year 2007 (Based on 2 partial tracts)
A) FHA, FSA/RHS & VA Home Purchase Loans
B) Conventional Home Purchase Loans
C) Refinancings
D) Home Improvement Loans
F) Non-occupant Loans on < 5 Family Dwellings (A B C & D)
G) Loans On Manufactured Home Dwelling (A B C & D)
Number
Average Value
Number
Average Value
Number
Average Value
Number
Average Value
Number
Average Value
Number
Average Value
LOANS ORIGINATED
1
$36,000
6
$106,973
11
$121,963
3
$55,073
2
$114,785
2
$92,285
APPLICATIONS APPROVED, NOT ACCEPTED
0
$0
0
$0
2
$127,520
1
$10,190
0
$0
0
$0
APPLICATIONS DENIED
0
$0
1
$88,300
7
$130,067
1
$78,960
0
$0
1
$69,450
APPLICATIONS WITHDRAWN
0
$0
0
$0
4
$151,970
1
$58,750
0
$0
1
$74,200
FILES CLOSED FOR INCOMPLETENESS
0
$0
0
$0
1
$140,090
0
$0
0
$0
0
$0
Aggregated Statistics For Year 2006 (Based on 2 partial tracts)
B) Conventional Home Purchase Loans
C) Refinancings
D) Home Improvement Loans
F) Non-occupant Loans on < 5 Family Dwellings (A B C & D)
G) Loans On Manufactured Home Dwelling (A B C & D)
Number
Average Value
Number
Average Value
Number
Average Value
Number
Average Value
Number
Average Value
LOANS ORIGINATED
4
$106,550
10
$112,968
4
$46,610
2
$121,235
2
$112,745
APPLICATIONS APPROVED, NOT ACCEPTED
0
$0
1
$74,200
0
$0
0
$0
0
$0
APPLICATIONS DENIED
3
$125,767
6
$138,443
2
$80,060
1
$129,730
1
$63,510
APPLICATIONS WITHDRAWN
1
$73,350
5
$133,870
1
$119,030
0
$0
0
$0
FILES CLOSED FOR INCOMPLETENESS
0
$0
2
$107,145
0
$0
0
$0
0
$0
Aggregated Statistics For Year 2005 (Based on 2 partial tracts)
B) Conventional Home Purchase Loans
C) Refinancings
D) Home Improvement Loans
F) Non-occupant Loans on < 5 Family Dwellings (A B C & D)
G) Loans On Manufactured Home Dwelling (A B C & D)
Number
Average Value
Number
Average Value
Number
Average Value
Number
Average Value
Number
Average Value
LOANS ORIGINATED
7
$104,670
13
$110,762
3
$36,167
2
$114,955
2
$51,620
APPLICATIONS APPROVED, NOT ACCEPTED
1
$74,030
2
$147,555
1
$29,720
0
$0
0
$0
APPLICATIONS DENIED
2
$105,360
8
$115,612
2
$37,865
1
$74,880
2
$51,450
APPLICATIONS WITHDRAWN
1
$93,390
5
$146,572
1
$78,620
1
$69,790
1
$60,790
FILES CLOSED FOR INCOMPLETENESS
1
$54,850
2
$165,215
0
$0
0
$0
0
$0
Aggregated Statistics For Year 2004 (Based on 2 partial tracts)
B) Conventional Home Purchase Loans
C) Refinancings
D) Home Improvement Loans
F) Non-occupant Loans on < 5 Family Dwellings (A B C & D)
G) Loans On Manufactured Home Dwelling (A B C & D)
Number
Average Value
Number
Average Value
Number
Average Value
Number
Average Value
Number
Average Value
LOANS ORIGINATED
3
$110,767
11
$98,607
3
$47,373
1
$136,350
1
$66,560
APPLICATIONS APPROVED, NOT ACCEPTED
1
$66,900
2
$78,615
0
$0
0
$0
1
$29,550
APPLICATIONS DENIED
1
$52,470
8
$92,478
2
$68,430
0
$0
1
$46,700
APPLICATIONS WITHDRAWN
1
$58,750
6
$90,730
0
$0
0
$0
1
$66,730
FILES CLOSED FOR INCOMPLETENESS
0
$0
0
$0
0
$0
0
$0
0
$0
Aggregated Statistics For Year 2003 (Based on 2 partial tracts)
A) FHA, FSA/RHS & VA Home Purchase Loans
B) Conventional Home Purchase Loans
C) Refinancings
D) Home Improvement Loans
F) Non-occupant Loans on < 5 Family Dwellings (A B C & D)
Detailed PMIC statistics for the following Tracts:0112.00
2002 - 2018 National Fire Incident Reporting System (NFIRS) incidents
According to the data from the years 2002 - 2018 the average number of fires per year is 8. The highest number of fires - 24 took place in 2010, and the least - 0 in 2007. The data has a dropping trend.
When looking into fire subcategories, the most incidents belonged to: Outside Fires (44.4%), and Structure Fires (40.1%).
Fire incident types reported to NFIRS in Zip Code 55711


 Nearest zip codes: 55702, 55780, 55720, 55726, 55779, 55765.


 . Tribal Land


 According to the data from the years 2002 - 2018 the average number of fires per year is 8. The highest number of fires - 24 took place in 2010, and the least - 0 in 2007. The data has a dropping trend.
 When looking into fire subcategories, the most incidents belonged to: Outside Fires (44.4%), and Structure Fires (40.1%).