Estimated zip code population in 2022: 2,065 Zip code population in 2010: 2,181 Zip code population in 2000: 2,219
Houses and condos: 892 Renter-occupied apartments: 99
% of renters here:
12%
State:
32%
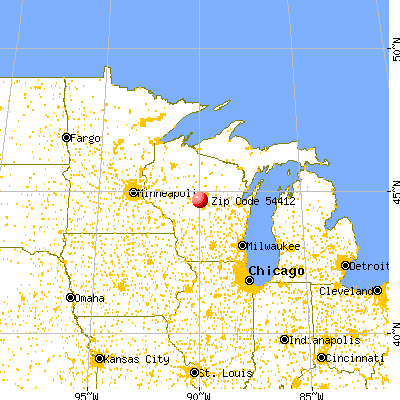
March 2022 cost of living index in zip code 54412: 85.6 (less than average, U.S. average is 100)
Land area: 72.3 sq. mi. Water area: 2.3 sq. mi.
Population density: 29 people per square mile
(very low).
OSM Map
General Map
Google Map
MSN Map
OSM Map
General Map
Google Map
MSN Map
OSM Map
General Map
Google Map
MSN Map
OSM Map
General Map
Google Map
MSN Map
Please wait while loading the map...
Real estate property taxes paid for housing units in 2022:
This zip code:
1.2% ($2,465)
Wisconsin:
1.4% ($3,497)
Median real estate property taxes paid for housing units with mortgages in 2022: $2,648 (1.2%) Median real estate property taxes paid for housing units with no mortgage in 2022: $2,358 (1.2%)
Business Search- 14 Million verified businesses
Males: 1,109
(53.7%)
Females: 956
(46.3%)
For population 25 years and over in 54412:
High school or higher: 91.9%
Bachelor's degree or higher: 17.0%
Graduate or professional degree: 3.9%
Unemployed: 1.5%
Mean travel time to work (commute): 23.1 minutes
For population 15 years and over in 54412:
Never married: 21.0%
Now married: 71.0%
Separated: 0.6%
Widowed: 3.2%
Divorced: 4.1%
Zip code 54412 compared to state average:
Unemployed percentage below state average.
Black race population percentage significantly below state average.
Hispanic race population percentage significantly below state average.
Median age significantly above state average.
Foreign-born population percentage significantly below state average.
Renting percentage significantly below state average.
Length of stay since moving in significantly above state average.
Number of college students significantly below state average.
Percentage of population with a bachelor's degree or higher below state average.
Estimated median house/condo value in 2022: $208,664
54412:
$208,664
Wisconsin:
$252,800
According to our research of Wisconsin and other state lists, there were 2 registered sex offenders living in 54412 zip code as of July 03, 2024. The ratio of all residents to sex offenders in zip code 54412 is 1,028 to 1. The ratio of registered sex offenders to all residents in this zip code is much lower than the state average.
Median resident age:
This zip code:
49.2 years
Wisconsin median age:
40.4 years
Average household size:
This zip code:
2.5 people
Wisconsin:
2.3 people
Averages for the 2020 tax year for zip code 54412, filed in 2021:
Average Adjusted Gross Income (AGI) in 2020: $63,795 (Individual Income Tax Returns)
Here:
$63,795
State:
$72,319
Salary/wage: $57,835 (reported on 79.8% of returns)
Here:
$57,835
State:
$59,242
(% of AGI for various income ranges: 1385.8% for AGIs below $25k, 4596.0% for AGIs $25k-50k, 7629.0% for AGIs $50k-75k, 11636.7% for AGIs $75k-100k, 16225.0% for AGIs $100k-200k)
Taxable interest for individuals: $950 (reported on 44.4% of returns)
This zip code:
$950
Wisconsin:
$1,431
(% of AGI for various income ranges: 25.0% for AGIs below $25k, 28.7% for AGIs $25k-50k, 70.0% for AGIs $50k-75k, 93.3% for AGIs $75k-100k, 138.0% for AGIs $100k-200k)
Ordinary dividends: $2,736 (reported on 22.2% of returns)
Here:
$2,736
State:
$6,481
(% of AGI for various income ranges: 25.8% for AGIs below $25k, 72.7% for AGIs $25k-50k, 105.0% for AGIs $50k-75k, 86.7% for AGIs $75k-100k, 305.0% for AGIs $100k-200k)
Net capital gain/loss in AGI: +$6,520 (reported on 25.3% of returns)
Here:
+$6,520
State:
+$18,329
(% of AGI for various income ranges: 60.8% for AGIs below $25k, 122.7% for AGIs $25k-50k, 271.0% for AGIs $50k-75k, 348.3% for AGIs $75k-100k, 893.0% for AGIs $100k-200k)
Profit/loss from business: +$17,907 (reported on 14.1% of returns)
Here:
+$17,907
State:
+$14,562
(% of AGI for various income ranges: 210.8% for AGIs below $25k, 182.0% for AGIs $25k-50k, 658.0% for AGIs $50k-75k, 1323.0% for AGIs $100k-200k)
Taxable individual retirement arrangement distribution: $15,162 (reported on 13.1% of returns)
54412:
$15,162
Wisconsin:
$19,348
(% of AGI for various income ranges: 166.7% for AGIs below $25k, 381.3% for AGIs $25k-50k, 816.7% for AGIs $75k-100k, 709.0% for AGIs $100k-200k)
Total itemized deductions: $22,700 (reported on 3.0% of returns)
Here:
$22,700
State:
$33,000
(% of AGI for various income ranges: 681.0% for AGIs $50k-75k)
Taxes paid: $7,267 (reported on 3.0% of returns)
54412:
$7,267
State:
$8,228
(% of AGI for various income ranges: 218.0% for AGIs $50k-75k)
Earned income credit: $2,056 (reported on 9.1% of returns)
Here:
$2,056
State:
$2,155
(% of AGI for various income ranges: 93.3% for AGIs below $25k, 48.7% for AGIs $25k-50k)
Percentage of individuals using paid preparers for their 2020 taxes: 97.0%
Here:
97%
State:
94%
(% for various income ranges: 92.3% for AGIs below $25k, 96.0% for AGIs $25k-50k, 100.0% for AGIs $50k-75k, 100.0% for AGIs $75k-100k, 100.0% for AGIs $100k-200k, 100.0% for AGIs over 200k)
Averages for the 2012 tax year for zip code 54412, filed in 2013:
Average Adjusted Gross Income (AGI) in 2012: $54,086 (Individual Income Tax Returns)
Here:
$54,086
State:
$57,939
Salary/wage: $46,503 (reported on 87.8% of returns)
Here:
$46,503
State:
$48,248
(% of AGI for various income ranges: 72.9% for AGIs below $25k, 75.9% for AGIs $25k-50k, 74.9% for AGIs $50k-75k, 79.3% for AGIs $75k-100k, 73.8% for AGIs $100k-200k)
Taxable interest for individuals: $764 (reported on 45.9% of returns)
This zip code:
$764
Wisconsin:
$1,224
(% of AGI for various income ranges: 1.4% for AGIs below $25k, 0.6% for AGIs $25k-50k, 1.0% for AGIs $50k-75k, 0.6% for AGIs $75k-100k, 0.3% for AGIs $100k-200k)
Ordinary dividends: $1,690 (reported on 21.4% of returns)
Here:
$1,690
State:
$5,137
(% of AGI for various income ranges: 1.1% for AGIs below $25k, 0.8% for AGIs $25k-50k, 1.1% for AGIs $50k-75k, 0.6% for AGIs $75k-100k, 0.3% for AGIs $100k-200k)
Net capital gain/loss in AGI: +$6,877 (reported on 22.4% of returns)
Here:
+$6,877
State:
+$11,137
(% of AGI for various income ranges: 3.6% for AGIs below $25k, 2.7% for AGIs $25k-50k, 1.6% for AGIs $50k-75k, 3.2% for AGIs $75k-100k, 3.4% for AGIs $100k-200k)
Profit/loss from business: +$18,800 (reported on 11.2% of returns)
Here:
+$18,800
State:
+$11,943
(% of AGI for various income ranges: 9.2% for AGIs below $25k, 2.9% for AGIs $25k-50k, 3.3% for AGIs $50k-75k, 9.8% for AGIs $75k-100k)
Taxable individual retirement arrangement distribution: $11,910 (reported on 10.2% of returns)
54412:
$11,910
Wisconsin:
$14,087
(% of AGI for various income ranges: 3.9% for AGIs below $25k, 3.1% for AGIs $25k-50k, 2.4% for AGIs $50k-75k, 4.5% for AGIs $75k-100k)
Total itemized deductions: $18,210 (20% of AGI, reported on 29.6% of returns)
Here:
$18,210
State:
$22,257
Here:
19.6% of AGI
State:
20.1% of AGI
(% of AGI for various income ranges: 9.5% for AGIs $25k-50k, 9.2% for AGIs $50k-75k, 10.7% for AGIs $75k-100k, 12.4% for AGIs $100k-200k)
Charity contributions: $1,990 (reported on 21.4% of returns)
Here:
$1,990
State:
$3,370
(% of AGI for various income ranges: 0.4% for AGIs $25k-50k, 0.8% for AGIs $50k-75k, 1.0% for AGIs $75k-100k, 1.0% for AGIs $100k-200k)
Taxes paid: $8,279 (reported on 29.6% of returns)
54412:
$8,279
State:
$10,731
(% of AGI for various income ranges: 1.3% for AGIs below $25k, 2.2% for AGIs $25k-50k, 3.4% for AGIs $50k-75k, 4.6% for AGIs $75k-100k, 7.0% for AGIs $100k-200k)
Earned income credit: $1,742 (reported on 12.2% of returns)
Here:
$1,742
State:
$2,094
(% of AGI for various income ranges: 3.5% for AGIs below $25k, 0.8% for AGIs $25k-50k)
Percentage of individuals using paid preparers for their 2012 taxes: 67.3%
Here:
67%
State:
54%
(% for various income ranges: 63.6% for AGIs below $25k, 65.2% for AGIs $25k-50k, 66.7% for AGIs $50k-75k, 69.2% for AGIs $75k-100k, 81.8% for AGIs $100k-200k)
Averages for the 2004 tax year for zip code 54412, filed in 2005:
Average Adjusted Gross Income (AGI) in 2004: $39,630 (Individual Income Tax Returns)
Here:
$39,630
State:
$47,735
Salary/wage: $35,833 (reported on 87.9% of returns)
Here:
$35,833
State:
$41,540
(% of AGI for various income ranges: 96.6% for AGIs below $10k, 70.9% for AGIs $10k-25k, 83.3% for AGIs $25k-50k, 81.3% for AGIs $50k-75k, 85.0% for AGIs $75k-100k, 69.3% for AGIs over 100k)
Taxable interest for individuals: $920 (reported on 57.4% of returns)
This zip code:
$920
Wisconsin:
$1,420
(% of AGI for various income ranges: 4.1% for AGIs below $10k, 3.5% for AGIs $10k-25k, 1.2% for AGIs $25k-50k, 0.9% for AGIs $50k-75k, 0.2% for AGIs $75k-100k, 1.6% for AGIs over 100k)
Taxable dividends: $917 (reported on 25.1% of returns)
Here:
$917
State:
$2,869
(% of AGI for various income ranges: 2.1% for AGIs below $10k, 0.7% for AGIs $10k-25k, 0.7% for AGIs $25k-50k, 0.4% for AGIs $50k-75k, 0.3% for AGIs $75k-100k, 0.6% for AGIs over 100k)
Net capital gain/loss: +$8,964 (reported on 23.7% of returns)
Here:
+$8,964
State:
+$9,569
(% of AGI for various income ranges: 4.6% for AGIs below $10k, 3.9% for AGIs $10k-25k, 2.3% for AGIs $25k-50k, 3.4% for AGIs $50k-75k, 0.8% for AGIs $75k-100k, 16.5% for AGIs over 100k)
Profit/loss from business: +$7,508 (reported on 11.8% of returns)
Here:
+$7,508
State:
+$10,417
(% of AGI for various income ranges: -6.1% for AGIs below $10k, 6.0% for AGIs $10k-25k, 2.5% for AGIs $25k-50k, 2.4% for AGIs $50k-75k, 3.4% for AGIs $75k-100k)
Profit/loss from farming: +$6,549 (reported on 11.6% of returns)
Here:
+$6,549
State:
-$2,654
(% of AGI for various income ranges: 6.4% for AGIs below $10k, 7.3% for AGIs $10k-25k, 2.6% for AGIs $25k-50k, 1.5% for AGIs $50k-75k)
IRA payment deduction: $2,789 (reported on 5.4% of returns)
54412:
$2,789
Wisconsin:
$2,900
Self-employed pension: $5,158 (reported on 1.8% of returns)
Here:
$5,158
Wisconsin:
$11,934
Total itemized deductions: $15,050 (21% of AGI, reported on 28.6% of returns)
Here:
$15,050
State:
$18,160
Here:
20.7% of AGI
State:
21.1% of AGI
(% of AGI for various income ranges: 6.8% for AGIs $10k-25k, 8.0% for AGIs $25k-50k, 11.5% for AGIs $50k-75k, 15.0% for AGIs $75k-100k, 13.7% for AGIs over 100k)
Charity contributions deductions: $1,730 (2% of AGI, reported on 24.7% of returns)
Here:
$1,730
State:
$2,711
Here:
2.4% of AGI
State:
3.0% of AGI
(% of AGI for various income ranges: 0.5% for AGIs $10k-25k, 0.6% for AGIs $25k-50k, 1.1% for AGIs $50k-75k, 1.8% for AGIs $75k-100k, 1.5% for AGIs over 100k)
Total tax: $4,526 (reported on 79.9% of returns)
54412:
$4,526
State:
$7,114
(% of AGI for various income ranges: 3.8% for AGIs below $10k, 6.0% for AGIs $10k-25k, 6.8% for AGIs $25k-50k, 8.3% for AGIs $50k-75k, 9.4% for AGIs $75k-100k, 15.4% for AGIs over 100k)
Earned income credit: $1,279 (reported on 11.6% of returns)
Here:
$1,279
State:
$1,544
Percentage of individuals using paid preparers for their 2004 taxes: 67.4%
Here:
67%
State:
57%
(% for various income ranges: 60.3% for AGIs below $10k, 65.7% for AGIs $10k-25k, 67.5% for AGIs $25k-50k, 71.1% for AGIs $50k-75k, 74.6% for AGIs $75k-100k, 80.8% for AGIs over 100k)
Household received Food Stamps/SNAP in the past 12 months: 28 Household did not receive Food Stamps/SNAP in the past 12 months: 770
Women who had a birth in the past 12 months: 23 (23 now married, 0 unmarried) Women who did not have a birth in the past 12 months: 279 (162 now married, 116 unmarried)
Housing units in zip code 54412 with a mortgage: 325 (24 second mortgage, 1 home equity loan, 20 both second mortgage and home equity loan) Houses without a mortgage: 8
Median monthly owner costs for units with a mortgage: $1,386 Median monthly owner costs for units without a mortgage: $462
Residents with income below the poverty level in 2022:
This zip code:
5.6%
Whole state:
10.7%
Residents with income below 50% of the poverty level in 2022:
This zip code:
3.5%
Whole state:
5.7%
Median number of rooms in houses and condos:
Here:
6.9
State:
6.5
Median number of rooms in apartments:
Here:
4.2
State:
4.1
Notable locations in this zip code not listed on our city pages
Churches in zip code 54412 include: Grace Church (A), Saint Johns Lutheran Church (B), Saint Marys Catholic Church (C). Display/hide their locations on the map
Cemeteries: North Auburndale Cemetery (1), Auburndale Cemetery (2), Saint Marys Cemetery (3), Greenwood Cemetery (4). Display/hide their locations on the map
Lakes and reservoirs: North Rice Lake (A), South Rice Lake (B), Honey Island Flowage (C), Rangeline Flowage (D), Ten Pool (E), North Honey Island Flowage (F), West Honey Island Flowage (G), North Smoky Hill Flowage (H). Display/hide their locations on the map
In group quarters: 9 (-1 institutionalized population)
Size of family households: 400 2-persons, 82 3-persons, 88 4-persons, 42 5-persons, 18 6-persons, 7 7-or-more-persons
Size of nonfamily households: 131 1-person, 32 2-persons, 1 3-persons
378 married couples with children.
64 single-parent households (35 men, 29 women).
94.2% of residents of 54412 zip code speak English at home.
1.0% of residents speak Spanish at home (65% very well, 35% well).
5.0% of residents speak other Indo-European language at home (97% very well, 3% well).
0.1% of residents speak Asian or Pacific Island language at home (100% very well).
Foreign born population: 16 (0.8%) (35.4% of them are naturalized citizens)
This zip code:
0.8%
Whole state:
5.0%
75%Honduras
52%German
10%Norwegian
9%Pennsylvania German
7%Swiss
6%Polish
6%American
1%Czech
Year of entry for the foreign-born population
82010 or later
02000 to 2009
21990 to 1999
5Before 1990
Facilities with environmental interests located in this zip code:
AUBURNDALE ELEM SCHOOL # 1 (10564 SCHOOL AVE in AUBURNDALE, WI)
(National Center for Education Statistics) - STATE ID-0040 STATE MASTER (Wisconsin database) - SDWIS-WI7720431, DRINKING WATER SYSTEM Organizations: AUBURNDALE SCH DIST (SCHOOL DISTRICT)
AUBURNDALE HIGH SCHOOL (10629 NORTH RD in AUBURNDALE, WI)
(National Center for Education Statistics) - STATE ID-0060 STATE MASTER (Wisconsin database) - SDWIS-WI7720429, DRINKING WATER SYSTEM Organizations: AUBURNDALE SCH DIST (SCHOOL DISTRICT)
AUBURNDALE WASTEWATER TREATMENT FACILITY (AUBURNDALE WWTF in AUBURNDALE, WI)
National Pollutant Discharge Elimination System NON-MAJOR (Tracking pollutant discharge elimination systems) - permit National Pollutant Discharge Elimination System NON-MAJOR (Tracking pollutant discharge elimination systems) - permit STATE MASTER (Wisconsin database) - PCS-WI0022411, WASTEWATER FACILITY Business SIC classification: SEWERAGE SYSTEMS Organizations: AUBURNDALE (VILLAGE OF) Alternative names: AUBURNDALE SEWAGE TREATMENT FA, AUBURNDALE VILLAGE OF, AUBURNDALE WTP
AUBURNDALE EL SR SCHOOLS (501 NORTH ST in AUBURNDALE, WI)
COMPLIANCE ACTIVITY (Tracking inspections of insecticide, fungicide, and rodenticide, and toxic substances) Small Quantity Generators, between 100 kg and 1000 kg of hazardous waste/month (Resource Conservation and Recovery Act (tracking hazardous waste)) - notification Organizations: SCHOOL DIST AUBURNDAL (CONTACT/OWNER)
Alternative names: SD OF AUBURNDALE
BADGER MOTORS (5596 MAIN STREET in AUBURNDALE, WI)
AIR MINOR (AIRS/AFS) Business SIC classification: NONCLASSIFIABLE ESTABLISHMENTS
AUBURNDALE SVC CTR (612 E MAIN ST in AUBURNDALE, WI)
Small Quantity Generators, between 100 kg and 1000 kg of hazardous waste/month (Resource Conservation and Recovery Act (tracking hazardous waste)) - notification Organizations: ANDERSON RONALD & MARTIN KARL (CONTACT/OWNER)
Housing units lacking complete plumbing facilities: 1.9% Housing units lacking complete kitchen facilities: 1.4%
43.0%Utility gas
37.5%Bottled, tank, or LP gas
7.5%Wood
6.3%Fuel oil, kerosene, etc.
4.7%Electricity
0.8%Other fuel
0.5%No fuel used
Population in 1990: 1,667. Population change in the 1990s: +552 (+33.1%).
Place of birth for U.S.-born residents:
This state: 1,778
Northeast: 13
Midwest: 183
South: 8
West: 60
66% of the 54412 zip code residents lived in the same house 5 years ago. Out of people who lived in different houses, 62% lived in this county. Out of people who lived in different counties, 50% lived in Wisconsin.
97% of the 54412 zip code residents lived in the same house 1 year ago. Out of people who lived in different houses, 27% moved from this county. Out of people who lived in different houses, 76% moved from different county within same state. Out of people who lived in different houses, 2% moved from different state. Out of people who lived in different houses, 4% moved from abroad.
Private vs. public school enrollment:
Students in private schools in grades 1 to 8 (elementary and middle school): 32
Here:
14.5%
Wisconsin:
16.7%
Students in private schools in grades 9 to 12 (high school): 7
Here:
8.9%
Wisconsin:
12.5%
Students in private undergraduate colleges: 1
Here:
8.3%
Wisconsin:
17.5%
Occupation by median earnings in the past 12 months ($)
81,084Computer and mathematical occupations
79,605Management occupations
79,108Installation, maintenance, and repair occupations
77,667Health diagnosing and treating practitioners and other technical occupations
67,190Business and financial operations occupations
63,729Transportation occupations
Companies with federal contracts located in this zip code:
AUBURNDALE RECYCLING CENTER IN (10453 S GEORGE ST in AUBURNDALE, WI; small business) : $3,625 in 2 contractsin 2002
$3,625 with Army for Recycling and Reclamation Equipment. Signed on 2002-12-17. Completion date: 2002-11-27.
$0, same as above.Signed on 2002-12-17. Completion date: 2002-11-27.
Top industries in this zip code by the number of employees in 2005:
Other Services (except Public Administration): Labor Unions and Similar Labor Organizations (20-49 employees: 1 establishment, 10-19 employees: 2 establishments)
Wholesale Trade: Recyclable Material Merchant Wholesalers (20-49: 1)
Information: Data Processing, Hosting, and Related Services (20-49: 1)
Finance and Insurance: Commercial Banking (20-49: 1)
Construction: Water and Sewer Line and Related Structures Construction (10-19: 2, 1-4: 1)
Other Services (except Public Administration): Religious Organizations (10-19: 1, 1-4: 1)
Wholesale Trade: Farm and Garden Machinery and Equipment Merchant Wholesalers (5-9: 1, 1-4: 1)
People in group quarters in 2010:
9 people in group homes intended for adults
4 people in residential treatment centers for adults
People in group quarters in 2000:
4 people in homes for the mentally retarded
3 people in homes or halfway houses for drug/alcohol abuse
Fatal accident statistics in 2014:
Fatal accident count: 1
Vehicles involved in fatal accidents: 2
Fatal accidents caused by drunken drivers: 0
Fatalities: 1
Persons involved in fatal accidents: 2
Pedestrians involved in fatal accidents: 0
Fatal accident statistics in 2013:
Fatal accident count: 1
Vehicles involved in fatal accidents: 2
Fatal accidents caused by drunken drivers: 0
Fatalities: 1
Persons involved in fatal accidents: 2
Pedestrians involved in fatal accidents: 0
Home Mortgage Disclosure Act Aggregated Statistics For Year 2009 (Based on 2 partial tracts)
A) FHA, FSA/RHS & VA Home Purchase Loans
B) Conventional Home Purchase Loans
C) Refinancings
D) Home Improvement Loans
F) Non-occupant Loans on < 5 Family Dwellings (A B C & D)
G) Loans On Manufactured Home Dwelling (A B C & D)
Number
Average Value
Number
Average Value
Number
Average Value
Number
Average Value
Number
Average Value
Number
Average Value
LOANS ORIGINATED
1
$165,480
8
$158,525
90
$150,989
5
$61,618
4
$198,402
1
$46,260
APPLICATIONS APPROVED, NOT ACCEPTED
0
$0
1
$89,220
5
$190,854
1
$55,420
1
$123,800
0
$0
APPLICATIONS DENIED
0
$0
2
$118,205
15
$187,041
1
$64,310
1
$115,660
1
$84,390
APPLICATIONS WITHDRAWN
0
$0
1
$110,580
11
$187,669
0
$0
0
$0
0
$0
FILES CLOSED FOR INCOMPLETENESS
0
$0
0
$0
3
$197,090
1
$68,890
0
$0
0
$0
Aggregated Statistics For Year 2008 (Based on 2 partial tracts)
A) FHA, FSA/RHS & VA Home Purchase Loans
B) Conventional Home Purchase Loans
C) Refinancings
D) Home Improvement Loans
F) Non-occupant Loans on < 5 Family Dwellings (A B C & D)
G) Loans On Manufactured Home Dwelling (A B C & D)
Number
Average Value
Number
Average Value
Number
Average Value
Number
Average Value
Number
Average Value
Number
Average Value
LOANS ORIGINATED
2
$91,765
15
$164,010
46
$152,912
7
$74,371
3
$225,983
1
$154,300
APPLICATIONS APPROVED, NOT ACCEPTED
0
$0
1
$136,000
4
$141,842
1
$66,090
1
$142,100
0
$0
APPLICATIONS DENIED
1
$64,570
2
$98,375
13
$199,802
0
$0
0
$0
1
$124,300
APPLICATIONS WITHDRAWN
0
$0
1
$79,820
7
$173,654
0
$0
0
$0
1
$47,790
FILES CLOSED FOR INCOMPLETENESS
0
$0
1
$38,890
1
$320,040
0
$0
0
$0
0
$0
Aggregated Statistics For Year 2007 (Based on 2 partial tracts)
A) FHA, FSA/RHS & VA Home Purchase Loans
B) Conventional Home Purchase Loans
C) Refinancings
D) Home Improvement Loans
F) Non-occupant Loans on < 5 Family Dwellings (A B C & D)
G) Loans On Manufactured Home Dwelling (A B C & D)
Number
Average Value
Number
Average Value
Number
Average Value
Number
Average Value
Number
Average Value
Number
Average Value
LOANS ORIGINATED
1
$177,690
18
$159,934
31
$115,194
8
$65,551
6
$164,002
3
$91,937
APPLICATIONS APPROVED, NOT ACCEPTED
0
$0
0
$0
6
$153,918
0
$0
1
$117,440
0
$0
APPLICATIONS DENIED
0
$0
2
$88,080
17
$159,787
2
$43,975
0
$0
1
$71,680
APPLICATIONS WITHDRAWN
0
$0
2
$141,335
8
$155,285
0
$0
1
$136,760
0
$0
FILES CLOSED FOR INCOMPLETENESS
0
$0
0
$0
1
$343,930
0
$0
0
$0
0
$0
Aggregated Statistics For Year 2006 (Based on 2 partial tracts)
A) FHA, FSA/RHS & VA Home Purchase Loans
B) Conventional Home Purchase Loans
C) Refinancings
D) Home Improvement Loans
F) Non-occupant Loans on < 5 Family Dwellings (A B C & D)
G) Loans On Manufactured Home Dwelling (A B C & D)
Number
Average Value
Number
Average Value
Number
Average Value
Number
Average Value
Number
Average Value
Number
Average Value
LOANS ORIGINATED
2
$171,840
18
$155,006
43
$130,694
7
$44,013
4
$159,448
1
$83,380
APPLICATIONS APPROVED, NOT ACCEPTED
0
$0
1
$128,120
4
$133,455
1
$24,660
0
$0
1
$33,810
APPLICATIONS DENIED
0
$0
4
$97,105
13
$118,535
2
$61,390
0
$0
1
$48,810
APPLICATIONS WITHDRAWN
0
$0
3
$116,340
8
$148,008
1
$18,560
1
$89,730
0
$0
FILES CLOSED FOR INCOMPLETENESS
0
$0
0
$0
3
$134,303
0
$0
0
$0
0
$0
Aggregated Statistics For Year 2005 (Based on 2 partial tracts)
A) FHA, FSA/RHS & VA Home Purchase Loans
B) Conventional Home Purchase Loans
C) Refinancings
D) Home Improvement Loans
F) Non-occupant Loans on < 5 Family Dwellings (A B C & D)
G) Loans On Manufactured Home Dwelling (A B C & D)
Number
Average Value
Number
Average Value
Number
Average Value
Number
Average Value
Number
Average Value
Number
Average Value
LOANS ORIGINATED
1
$146,670
27
$118,956
44
$168,771
8
$40,418
6
$195,437
1
$81,340
APPLICATIONS APPROVED, NOT ACCEPTED
1
$118,200
1
$59,480
6
$101,298
2
$15,000
1
$34,320
0
$0
APPLICATIONS DENIED
0
$0
4
$73,590
17
$128,146
2
$56,050
1
$119,980
1
$21,610
APPLICATIONS WITHDRAWN
0
$0
1
$168,280
8
$141,462
1
$121,510
0
$0
0
$0
FILES CLOSED FOR INCOMPLETENESS
0
$0
0
$0
4
$137,902
0
$0
0
$0
0
$0
Aggregated Statistics For Year 2004 (Based on 2 partial tracts)
A) FHA, FSA/RHS & VA Home Purchase Loans
B) Conventional Home Purchase Loans
C) Refinancings
D) Home Improvement Loans
F) Non-occupant Loans on < 5 Family Dwellings (A B C & D)
G) Loans On Manufactured Home Dwelling (A B C & D)
Number
Average Value
Number
Average Value
Number
Average Value
Number
Average Value
Number
Average Value
Number
Average Value
LOANS ORIGINATED
2
$121,255
26
$139,135
48
$118,759
8
$49,824
6
$175,780
1
$123,540
APPLICATIONS APPROVED, NOT ACCEPTED
0
$0
2
$68,255
3
$139,980
1
$41,940
0
$0
0
$0
APPLICATIONS DENIED
1
$56,690
4
$136,315
17
$113,598
1
$73,720
1
$72,700
1
$27,450
APPLICATIONS WITHDRAWN
0
$0
1
$154,810
8
$122,111
1
$9,910
1
$63,800
0
$0
FILES CLOSED FOR INCOMPLETENESS
0
$0
0
$0
3
$117,780
0
$0
0
$0
0
$0
Aggregated Statistics For Year 2003 (Based on 2 partial tracts)
B) Conventional Home Purchase Loans
C) Refinancings
D) Home Improvement Loans
F) Non-occupant Loans on < 5 Family Dwellings (A B C & D)
Number
Average Value
Number
Average Value
Number
Average Value
Number
Average Value
LOANS ORIGINATED
17
$127,025
98
$118,193
5
$64,618
5
$158,520
APPLICATIONS APPROVED, NOT ACCEPTED
2
$100,790
5
$113,068
1
$71,180
1
$90,500
APPLICATIONS DENIED
3
$78,803
16
$106,478
1
$32,790
1
$50,840
APPLICATIONS WITHDRAWN
3
$114,307
9
$105,041
1
$17,030
1
$77,280
FILES CLOSED FOR INCOMPLETENESS
0
$0
2
$128,625
0
$0
0
$0
Aggregated Statistics For Year 2002 (Based on 2 partial tracts)
A) FHA, FSA/RHS & VA Home Purchase Loans
B) Conventional Home Purchase Loans
C) Refinancings
D) Home Improvement Loans
F) Non-occupant Loans on < 5 Family Dwellings (A B C & D)
Number
Average Value
Number
Average Value
Number
Average Value
Number
Average Value
Number
Average Value
LOANS ORIGINATED
1
$108,040
13
$128,371
78
$112,122
9
$40,616
2
$104,860
APPLICATIONS APPROVED, NOT ACCEPTED
0
$0
1
$35,590
6
$124,135
0
$0
0
$0
APPLICATIONS DENIED
0
$0
2
$118,075
13
$117,342
1
$1,780
1
$65,840
APPLICATIONS WITHDRAWN
0
$0
2
$108,545
8
$104,159
0
$0
0
$0
FILES CLOSED FOR INCOMPLETENESS
0
$0
0
$0
1
$37,880
0
$0
0
$0
Aggregated Statistics For Year 2001 (Based on 2 partial tracts)
A) FHA, FSA/RHS & VA Home Purchase Loans
B) Conventional Home Purchase Loans
C) Refinancings
D) Home Improvement Loans
F) Non-occupant Loans on < 5 Family Dwellings (A B C & D)
Number
Average Value
Number
Average Value
Number
Average Value
Number
Average Value
Number
Average Value
LOANS ORIGINATED
1
$74,990
13
$109,345
50
$101,868
5
$55,974
3
$107,950
APPLICATIONS APPROVED, NOT ACCEPTED
0
$0
1
$72,450
5
$83,124
0
$0
0
$0
APPLICATIONS DENIED
0
$0
2
$99,265
12
$97,825
1
$20,590
0
$0
APPLICATIONS WITHDRAWN
0
$0
1
$120,240
6
$97,147
0
$0
0
$0
FILES CLOSED FOR INCOMPLETENESS
0
$0
0
$0
1
$106,000
0
$0
0
$0
Aggregated Statistics For Year 2000 (Based on 2 partial tracts)
B) Conventional Home Purchase Loans
C) Refinancings
D) Home Improvement Loans
F) Non-occupant Loans on < 5 Family Dwellings (A B C & D)
Number
Average Value
Number
Average Value
Number
Average Value
Number
Average Value
LOANS ORIGINATED
16
$108,686
15
$99,003
6
$30,843
4
$89,225
APPLICATIONS APPROVED, NOT ACCEPTED
1
$90,240
2
$73,465
0
$0
0
$0
APPLICATIONS DENIED
3
$88,037
6
$58,805
2
$16,395
0
$0
APPLICATIONS WITHDRAWN
2
$94,690
4
$83,188
0
$0
0
$0
FILES CLOSED FOR INCOMPLETENESS
0
$0
1
$16,780
0
$0
0
$0
Aggregated Statistics For Year 1999 (Based on 1 partial tract)
B) Conventional Home Purchase Loans
C) Refinancings
D) Home Improvement Loans
F) Non-occupant Loans on < 5 Family Dwellings (A B C & D)
Detailed PMIC statistics for the following Tracts:0018.00
2003 - 2018 National Fire Incident Reporting System (NFIRS) incidents
Based on the data from the years 2003 - 2018 the average number of fires per year is 8. The highest number of reported fires - 22 took place in 2018, and the least - 1 in 2008. The data has an increasing trend.
When looking into fire subcategories, the most reports belonged to: Structure Fires (50.8%), and Outside Fires (28.2%).
Fire incident types reported to NFIRS in Zip Code 54412


+$6,549
-$2,654
(% of AGI for various income ranges: 6.4% for AGIs below $10k, 7.3% for AGIs $10k-25k, 2.6% for AGIs $25k-50k, 1.5% for AGIs $50k-75k)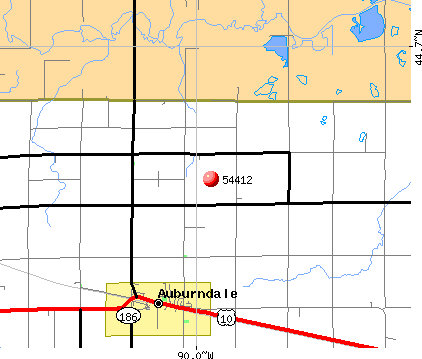 Nearest zip codes: 54454, 54441, 54410, 54484, 54489, 54443.


 Based on the data from the years 2003 - 2018 the average number of fires per year is 8. The highest number of reported fires - 22 took place in 2018, and the least - 1 in 2008. The data has an increasing trend.
 When looking into fire subcategories, the most reports belonged to: Structure Fires (50.8%), and Outside Fires (28.2%).