Estimated zip code population in 2022: 1,736 Zip code population in 2010: 1,923 Zip code population in 2000: 2,022
Houses and condos: 859 Renter-occupied apartments: 107
% of renters here:
14%
State:
28%
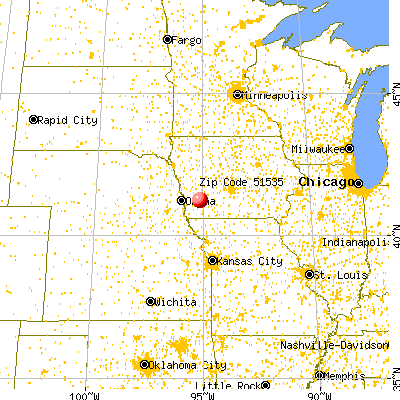
March 2022 cost of living index in zip code 51535: 82.5 (low, U.S. average is 100)
Land area: 130.2 sq. mi. Water area: 0.0 sq. mi.
Population density: 13 people per square mile
(very low).
OSM Map
General Map
Google Map
MSN Map
OSM Map
General Map
Google Map
MSN Map
OSM Map
General Map
Google Map
MSN Map
OSM Map
General Map
Google Map
MSN Map
Please wait while loading the map...
Real estate property taxes paid for housing units in 2022:
This zip code:
1.3% ($1,731)
Iowa:
1.4% ($2,724)
Median real estate property taxes paid for housing units with mortgages in 2022: $1,455 (1.4%) Median real estate property taxes paid for housing units with no mortgage in 2022: $1,963 (1.3%)
Business Search- 14 Million verified businesses
Males: 948
(54.6%)
Females: 788
(45.4%)
For population 25 years and over in 51535:
High school or higher: 92.6%
Bachelor's degree or higher: 19.6%
Graduate or professional degree: 9.1%
Unemployed: 0.8%
Mean travel time to work (commute): 25.0 minutes
For population 15 years and over in 51535:
Never married: 23.4%
Now married: 59.4%
Separated: 0.6%
Widowed: 8.2%
Divorced: 8.5%
Zip code 51535 compared to state average:
Unemployed percentage significantly below state average.
Black race population percentage significantly below state average.
Hispanic race population percentage below state average.
Median age significantly above state average.
Foreign-born population percentage significantly below state average.
Renting percentage below state average.
Length of stay since moving in significantly above state average.
House age above state average.
Percentage of population with a bachelor's degree or higher below state average.
Averages for the 2020 tax year for zip code 51535, filed in 2021:
Average Adjusted Gross Income (AGI) in 2020: $57,982 (Individual Income Tax Returns)
Here:
$57,982
State:
$71,087
Salary/wage: $48,992 (reported on 78.0% of returns)
Here:
$48,992
State:
$57,361
(% of AGI for various income ranges: 1340.7% for AGIs below $25k, 4020.0% for AGIs $25k-50k, 7326.7% for AGIs $50k-75k, 11026.0% for AGIs $75k-100k, 22414.0% for AGIs $100k-200k)
Taxable interest for individuals: $973 (reported on 40.2% of returns)
This zip code:
$973
Iowa:
$1,633
(% of AGI for various income ranges: 19.3% for AGIs below $25k, 46.0% for AGIs $25k-50k, 71.1% for AGIs $50k-75k, 52.0% for AGIs $75k-100k, 266.0% for AGIs $100k-200k)
Ordinary dividends: $2,847 (reported on 20.7% of returns)
Here:
$2,847
State:
$5,432
(% of AGI for various income ranges: 24.0% for AGIs below $25k, 48.7% for AGIs $25k-50k, 60.0% for AGIs $50k-75k, 116.0% for AGIs $75k-100k, 526.0% for AGIs $100k-200k)
Net capital gain/loss in AGI: +$8,407 (reported on 18.3% of returns)
Here:
+$8,407
State:
+$15,243
(% of AGI for various income ranges: 10.7% for AGIs below $25k, 24.0% for AGIs $25k-50k, 127.8% for AGIs $50k-75k, 156.0% for AGIs $75k-100k, 2032.0% for AGIs $100k-200k)
Profit/loss from business: +$7,260 (reported on 18.3% of returns)
Here:
+$7,260
State:
+$11,763
(% of AGI for various income ranges: 138.0% for AGIs below $25k, 182.0% for AGIs $25k-50k, 505.6% for AGIs $50k-75k, 308.0% for AGIs $100k-200k)
Taxable individual retirement arrangement distribution: $8,791 (reported on 13.4% of returns)
51535:
$8,791
Iowa:
$17,324
(% of AGI for various income ranges: 106.7% for AGIs below $25k, 128.7% for AGIs $25k-50k, 302.2% for AGIs $50k-75k, 684.0% for AGIs $75k-100k)
Total itemized deductions: $33,367 (reported on 3.7% of returns)
Here:
$33,367
State:
$33,775
(% of AGI for various income ranges: 1112.2% for AGIs $50k-75k)
Charity contributions: $10,500 (reported on 2.4% of returns)
Here:
$10,500
State:
$13,075
(% of AGI for various income ranges: 233.3% for AGIs $50k-75k)
Taxes paid: $5,767 (reported on 3.7% of returns)
51535:
$5,767
State:
$7,704
(% of AGI for various income ranges: 192.2% for AGIs $50k-75k)
Earned income credit: $2,210 (reported on 12.2% of returns)
Here:
$2,210
State:
$2,195
(% of AGI for various income ranges: 80.7% for AGIs below $25k, 66.7% for AGIs $25k-50k)
Percentage of individuals using paid preparers for their 2020 taxes: 96.3%
Here:
96%
State:
95%
(% for various income ranges: 91.3% for AGIs below $25k, 100.0% for AGIs $25k-50k, 93.3% for AGIs $50k-75k, 100.0% for AGIs $75k-100k, 100.0% for AGIs $100k-200k)
Averages for the 2012 tax year for zip code 51535, filed in 2013:
Average Adjusted Gross Income (AGI) in 2012: $54,436 (Individual Income Tax Returns)
Here:
$54,436
State:
$58,860
Salary/wage: $38,745 (reported on 80.2% of returns)
Here:
$38,745
State:
$46,659
(% of AGI for various income ranges: 72.3% for AGIs below $25k, 73.7% for AGIs $25k-50k, 69.9% for AGIs $50k-75k, 69.2% for AGIs $75k-100k, 46.9% for AGIs $100k-200k, 21.8% for AGIs over 200k)
Taxable interest for individuals: $947 (reported on 39.5% of returns)
This zip code:
$947
Iowa:
$1,537
(% of AGI for various income ranges: 1.9% for AGIs below $25k, 0.5% for AGIs $25k-50k, 0.6% for AGIs $50k-75k, 0.3% for AGIs $75k-100k, 0.8% for AGIs $100k-200k, 0.7% for AGIs over 200k)
Ordinary dividends: $7,730 (reported on 23.3% of returns)
Here:
$7,730
State:
$4,542
(% of AGI for various income ranges: 1.0% for AGIs below $25k, 0.6% for AGIs $25k-50k, 1.6% for AGIs $50k-75k, 0.4% for AGIs $75k-100k, 13.7% for AGIs $100k-200k)
Net capital gain/loss in AGI: +$10,053 (reported on 17.4% of returns)
Here:
+$10,053
State:
+$11,802
(% of AGI for various income ranges: 1.0% for AGIs $25k-50k, 0.8% for AGIs $50k-75k, 1.1% for AGIs $75k-100k, 13.4% for AGIs $100k-200k)
Profit/loss from business: +$9,668 (reported on 22.1% of returns)
Here:
+$9,668
State:
+$10,509
(% of AGI for various income ranges: 9.0% for AGIs below $25k, 6.7% for AGIs $25k-50k, 2.2% for AGIs $50k-75k, 4.1% for AGIs $75k-100k, 4.5% for AGIs $100k-200k)
Taxable individual retirement arrangement distribution: $7,245 (reported on 12.8% of returns)
51535:
$7,245
Iowa:
$11,773
(% of AGI for various income ranges: 2.7% for AGIs below $25k, 2.8% for AGIs $25k-50k, 5.2% for AGIs $75k-100k)
Total itemized deductions: $17,596 (20% of AGI, reported on 27.9% of returns)
Here:
$17,596
State:
$21,278
Here:
19.6% of AGI
State:
18.9% of AGI
(% of AGI for various income ranges: 7.2% for AGIs below $25k, 10.1% for AGIs $25k-50k, 9.3% for AGIs $50k-75k, 8.7% for AGIs $75k-100k, 8.9% for AGIs $100k-200k, 9.2% for AGIs over 200k)
Charity contributions: $4,041 (reported on 19.8% of returns)
Here:
$4,041
State:
$4,044
(% of AGI for various income ranges: 1.1% for AGIs $25k-50k, 1.1% for AGIs $50k-75k, 1.8% for AGIs $75k-100k, 2.1% for AGIs $100k-200k, 1.7% for AGIs over 200k)
Taxes paid: $6,400 (reported on 26.7% of returns)
51535:
$6,400
State:
$8,846
(% of AGI for various income ranges: 0.8% for AGIs below $25k, 2.1% for AGIs $25k-50k, 2.4% for AGIs $50k-75k, 2.6% for AGIs $75k-100k, 3.6% for AGIs $100k-200k, 5.9% for AGIs over 200k)
Earned income credit: $2,092 (reported on 15.1% of returns)
Here:
$2,092
State:
$2,098
(% of AGI for various income ranges: 4.8% for AGIs below $25k, 1.2% for AGIs $25k-50k)
Percentage of individuals using paid preparers for their 2012 taxes: 72.1%
Here:
72%
State:
65%
(% for various income ranges: 64.5% for AGIs below $25k, 66.7% for AGIs $25k-50k, 76.9% for AGIs $50k-75k, 81.8% for AGIs $75k-100k, 85.7% for AGIs $100k-200k, 100.0% for AGIs over 200k)
Averages for the 2004 tax year for zip code 51535, filed in 2005:
Average Adjusted Gross Income (AGI) in 2004: $37,209 (Individual Income Tax Returns)
Here:
$37,209
State:
$43,875
Salary/wage: $31,800 (reported on 80.6% of returns)
Here:
$31,800
State:
$38,265
(% of AGI for various income ranges: 136.1% for AGIs below $10k, 65.8% for AGIs $10k-25k, 75.5% for AGIs $25k-50k, 76.3% for AGIs $50k-75k, 73.4% for AGIs $75k-100k, 38.2% for AGIs over 100k)
Taxable interest for individuals: $1,432 (reported on 58.0% of returns)
This zip code:
$1,432
Iowa:
$1,768
(% of AGI for various income ranges: 8.7% for AGIs below $10k, 5.3% for AGIs $10k-25k, 2.8% for AGIs $25k-50k, 1.5% for AGIs $50k-75k, 1.0% for AGIs $75k-100k, 0.8% for AGIs over 100k)
Taxable dividends: $1,165 (reported on 30.2% of returns)
Here:
$1,165
State:
$2,510
(% of AGI for various income ranges: 5.9% for AGIs below $10k, 2.0% for AGIs $10k-25k, 1.0% for AGIs $25k-50k, 0.6% for AGIs $50k-75k, 0.8% for AGIs $75k-100k, 0.4% for AGIs over 100k)
Net capital gain/loss: +$3,925 (reported on 23.9% of returns)
Here:
+$3,925
State:
+$6,139
(% of AGI for various income ranges: -3.8% for AGIs below $10k, 0.2% for AGIs $10k-25k, 2.0% for AGIs $25k-50k, 0.8% for AGIs $50k-75k, 1.1% for AGIs $75k-100k, 9.8% for AGIs over 100k)
Profit/loss from business: +$5,052 (reported on 18.3% of returns)
Here:
+$5,052
State:
+$8,574
(% of AGI for various income ranges: -5.9% for AGIs below $10k, 5.2% for AGIs $10k-25k, 5.0% for AGIs $25k-50k, 0.9% for AGIs $50k-75k, 2.6% for AGIs $75k-100k)
Profit/loss from farming: +$4,689 (reported on 14.1% of returns)
Here:
+$4,689
State:
-$74
(% of AGI for various income ranges: 1.5% for AGIs below $10k, 6.4% for AGIs $10k-25k, 0.4% for AGIs $25k-50k, -1.2% for AGIs $50k-75k, 8.2% for AGIs $75k-100k)
IRA payment deduction: $2,780 (reported on 4.9% of returns)
51535:
$2,780
Iowa:
$2,970
Total itemized deductions: $14,191 (26% of AGI, reported on 25.5% of returns)
Here:
$14,191
State:
$16,976
Here:
25.6% of AGI
State:
20.8% of AGI
(% of AGI for various income ranges: 47.8% for AGIs below $10k, 12.2% for AGIs $10k-25k, 9.4% for AGIs $25k-50k, 8.8% for AGIs $50k-75k, 10.4% for AGIs $75k-100k, 6.1% for AGIs over 100k)
Charity contributions deductions: $2,341 (4% of AGI, reported on 21.3% of returns)
Here:
$2,341
State:
$3,089
Here:
3.7% of AGI
State:
3.6% of AGI
(% of AGI for various income ranges: 2.8% for AGIs below $10k, 1.4% for AGIs $10k-25k, 1.1% for AGIs $25k-50k, 1.3% for AGIs $50k-75k, 2.2% for AGIs $75k-100k, 0.7% for AGIs over 100k)
Total tax: $4,098 (reported on 76.4% of returns)
51535:
$4,098
State:
$6,177
(% of AGI for various income ranges: 5.7% for AGIs below $10k, 5.0% for AGIs $10k-25k, 6.8% for AGIs $25k-50k, 7.8% for AGIs $50k-75k, 11.6% for AGIs $75k-100k, 11.7% for AGIs over 100k)
Earned income credit: $1,655 (reported on 13.1% of returns)
Here:
$1,655
State:
$1,540
Percentage of individuals using paid preparers for their 2004 taxes: 74.6%
Here:
75%
State:
70%
(% for various income ranges: 61.6% for AGIs below $10k, 77.3% for AGIs $10k-25k, 80.0% for AGIs $25k-50k, 74.1% for AGIs $50k-75k, 74.5% for AGIs $75k-100k, 92.6% for AGIs over 100k)
Likely homosexual households (counted as self-reported same-sex unmarried-partner households)
Lesbian couples: 0.4% of all households
Gay men: 0.0% of all households
Household received Food Stamps/SNAP in the past 12 months: 24 Household did not receive Food Stamps/SNAP in the past 12 months: 723
Women who had a birth in the past 12 months: 30 (19 now married, 10 unmarried) Women who did not have a birth in the past 12 months: 275 (124 now married, 151 unmarried)
Housing units in zip code 51535 with a mortgage: 279 (15 second mortgage, 3 both second mortgage and home equity loan) Median monthly owner costs for units with a mortgage: $1,028 Median monthly owner costs for units without a mortgage: $534
Residents with income below the poverty level in 2022:
This zip code:
5.8%
Whole state:
11.0%
Residents with income below 50% of the poverty level in 2022:
This zip code:
4.0%
Whole state:
5.5%
Median number of rooms in houses and condos:
Here:
6.9
State:
6.8
Median number of rooms in apartments:
Here:
5.3
State:
4.2
Notable locations in this zip code not listed on our city pages
Notable locations in zip code 51535: Griswold Elevator (A), Griswold Country Club (B), Camp Wakonda (C), McDill (D), Griswold Volunteer Fire and Rescue (E), Cass County Historical Society Museum (F), Griswold Public Library (G), Doll House (H), Griswold City Hall (I), Griswold Police Department (J). Display/hide their locations on the map
Churches in zip code 51535 include: Noble Center Church (A), Faith Lutheran Church (B), Our Lady of Grace Catholic Church (C), United Methodist Church (D), Church of Christ (E), Saint Johns Church (F). Display/hide their locations on the map
Cemeteries: Pleasant Township Cemetery (1), Saint Johns Cemetery (2), Smith Cemetery (3), Flint Cemetery (4), Griswold Cemetery (5), Weirich Cemetery (6), Whipple Cemetery (7). Display/hide their locations on the map
In group quarters: 35 (-1 institutionalized population)
Size of family households: 321 2-persons, 75 3-persons, 53 4-persons, 31 5-persons, 16 6-persons, 7 7-or-more-persons
Size of nonfamily households: 222 1-person, 17 2-persons
284 married couples with children.
91 single-parent households (13 men, 78 women).
97.5% of residents of 51535 zip code speak English at home.
1.2% of residents speak Spanish at home (35% very well, 65% not well).
0.9% of residents speak Asian or Pacific Island language at home (60% very well, 40% well).
Foreign born population: 34 (2.0%) (0.0% of them are naturalized citizens)
:
2.0%
Whole state:
6.0%
64%Fiji
39%Dominica
27%German
17%English
15%American
14%European
8%Danish
4%Italian
3%Irish
Year of entry for the foreign-born population
292010 or later
82000 to 2009
01990 to 1999
0Before 1990
Facilities with environmental interests located in this zip code:
SCHULER MFG (63724 RICHLAND ROAD in GRISWOLD, IA)
AIR SYNTHETIC MINOR (AIRS/AFS) STATE MASTER (Iowa emission factors information) - SDWIS-IA1545101, DRINKING WATER SYSTEM Business SIC classification: FARM MACHINERY AND EQUIPMENT Organizations: SCHULER MANUFACTURING (CONTACT/GENERAL)
Alternative names: SCHULER MFG & EQUIPMENT CO INC, SCHULER MFG & EQUIPMENT CO INC
CODY FARMS (RICH CODY) (49198 DOGWOOD ROAD in GRISWOLD, IA)
(Integrated Compliance Information System) - ICIS-07-2001-0302, FORMAL ENFORCEMENT ACTION Alternative names: CODY FARMS, INC.
AGRILAND FS INC. GRISWOLD (54911 TROY ROAD in GRISWOLD, IA)
COMPLIANCE ACTIVITY (Tracking inspections of insecticide, fungicide, and rodenticide, and toxic substances) (Resource Conservation and Recovery Act (tracking hazardous waste)) Alternative names: AGRILAND F/S INC
AT&T (RT 92 W OF TOWN, N 2 MI ON M47 in GRISWOLD, IA)
(Resource Conservation and Recovery Act (tracking hazardous waste))
STEINBECK & SONS INCORPORATED (69888 612TH STREET in GRISWOLD, IA)
COMPLIANCE ACTIVITY (Tracking inspections of insecticide, fungicide, and rodenticide, and toxic substances)
SCHULER MFG & EQUIP CO (RR2 1 MI E OF 71 ON HWY 92 in GRISWOLD, IA)
Small Quantity Generators, between 100 kg and 1000 kg of hazardous waste/month (Resource Conservation and Recovery Act (tracking hazardous waste)) Business NAICS classification: FARM MACHINERY AND EQUIPMENT MANUFACTURING.
NEWMAN BODY SHOP (62951 TUCSON ROAD in GRISWOLD, IA)
Small Quantity Generators, between 100 kg and 1000 kg of hazardous waste/month (Resource Conservation and Recovery Act (tracking hazardous waste)) Business NAICS classification: AUTOMOTIVE BODY, PAINT, AND INTERIOR REPAIR AND MAINTENANCE.
Housing units lacking complete plumbing facilities: 4.8% Housing units lacking complete kitchen facilities: 2.3%
43.2%Utility gas
29.1%Bottled, tank, or LP gas
27.1%Electricity
Population in 1990: 1,678. Population change in the 1990s: +344 (+20.5%).
Place of birth for U.S.-born residents:
This state: 1,152
Northeast: 5
Midwest: 426
South: 41
West: 68
73% of the 51535 zip code residents lived in the same house 5 years ago. Out of people who lived in different houses, 54% lived in this county. Out of people who lived in different counties, 50% lived in Iowa.
93% of the 51535 zip code residents lived in the same house 1 year ago. Out of people who lived in different houses, 51% moved from this county. Out of people who lived in different houses, 29% moved from different county within same state. Out of people who lived in different houses, 21% moved from different state.
Private vs. public school enrollment:
Students in private schools in grades 1 to 8 (elementary and middle school): 20
Here:
15.0%
Iowa:
10.6%
Students in private schools in grades 9 to 12 (high school): 12
Here:
10.7%
Iowa:
7.9%
Students in private undergraduate colleges: 2
Here:
9.5%
Iowa:
23.9%
Occupation by median earnings in the past 12 months ($)
238,264Health diagnosing and treating practitioners and other technical occupations
95,952Management occupations
79,928Installation, maintenance, and repair occupations
78,578Community and social service occupations
49,392Business and financial operations occupations
48,733Production occupations
Top industries in this zip code by the number of employees in 2005:
Health Care and Social Assistance: Nursing Care Facilities (50-99 employees: 1 establishment)
People in group quarters in 2010:
36 people in nursing facilities/skilled-nursing facilities
People in group quarters in 2000:
54 people in nursing homes
Fatal accident statistics in 2014:
Fatal accident count: 2
Vehicles involved in fatal accidents: 3
Fatal accidents caused by drunken drivers: 0
Fatalities: 2
Persons involved in fatal accidents: 5
Pedestrians involved in fatal accidents: 0
Fatal accident statistics in 2011:
Fatal accident count: 1
Vehicles involved in fatal accidents: 1
Fatal accidents caused by drunken drivers: 0
Fatalities: 1
Persons involved in fatal accidents: 1
Pedestrians involved in fatal accidents: 0
Home Mortgage Disclosure Act Aggregated Statistics For Year 2009 (Based on 2 partial tracts)
A) FHA, FSA/RHS & VA Home Purchase Loans
B) Conventional Home Purchase Loans
C) Refinancings
D) Home Improvement Loans
F) Non-occupant Loans on < 5 Family Dwellings (A B C & D)
G) Loans On Manufactured Home Dwelling (A B C & D)
Number
Average Value
Number
Average Value
Number
Average Value
Number
Average Value
Number
Average Value
Number
Average Value
LOANS ORIGINATED
4
$142,852
8
$142,774
29
$103,659
8
$85,934
1
$78,010
1
$36,780
APPLICATIONS APPROVED, NOT ACCEPTED
0
$0
1
$11,420
4
$104,485
1
$30,440
0
$0
1
$88,790
APPLICATIONS DENIED
2
$81,810
1
$73,570
10
$108,385
1
$5,070
0
$0
1
$43,130
APPLICATIONS WITHDRAWN
0
$0
1
$39,950
4
$113,522
0
$0
0
$0
0
$0
FILES CLOSED FOR INCOMPLETENESS
0
$0
0
$0
2
$72,615
1
$6,340
0
$0
0
$0
Aggregated Statistics For Year 2008 (Based on 2 partial tracts)
A) FHA, FSA/RHS & VA Home Purchase Loans
B) Conventional Home Purchase Loans
C) Refinancings
D) Home Improvement Loans
F) Non-occupant Loans on < 5 Family Dwellings (A B C & D)
G) Loans On Manufactured Home Dwelling (A B C & D)
Number
Average Value
Number
Average Value
Number
Average Value
Number
Average Value
Number
Average Value
Number
Average Value
LOANS ORIGINATED
3
$135,507
7
$98,844
13
$105,570
6
$30,230
2
$15,220
1
$35,520
APPLICATIONS APPROVED, NOT ACCEPTED
1
$124,300
0
$0
1
$46,300
0
$0
0
$0
0
$0
APPLICATIONS DENIED
0
$0
3
$95,130
11
$117,269
2
$78,005
1
$15,860
0
$0
APPLICATIONS WITHDRAWN
0
$0
0
$0
8
$107,735
0
$0
1
$13,950
1
$30,440
FILES CLOSED FOR INCOMPLETENESS
0
$0
0
$0
2
$110,985
0
$0
0
$0
0
$0
Aggregated Statistics For Year 2007 (Based on 2 partial tracts)
A) FHA, FSA/RHS & VA Home Purchase Loans
B) Conventional Home Purchase Loans
C) Refinancings
D) Home Improvement Loans
F) Non-occupant Loans on < 5 Family Dwellings (A B C & D)
G) Loans On Manufactured Home Dwelling (A B C & D)
Number
Average Value
Number
Average Value
Number
Average Value
Number
Average Value
Number
Average Value
Number
Average Value
LOANS ORIGINATED
1
$84,980
13
$96,594
15
$102,275
3
$18,603
3
$27,060
1
$121,770
APPLICATIONS APPROVED, NOT ACCEPTED
0
$0
1
$83,080
7
$108,539
1
$4,440
0
$0
0
$0
APPLICATIONS DENIED
0
$0
6
$92,805
15
$96,399
3
$120,920
0
$0
1
$52,000
APPLICATIONS WITHDRAWN
0
$0
2
$66,590
4
$130,010
0
$0
0
$0
0
$0
FILES CLOSED FOR INCOMPLETENESS
0
$0
2
$75,785
1
$142,690
0
$0
0
$0
0
$0
Aggregated Statistics For Year 2006 (Based on 2 partial tracts)
A) FHA, FSA/RHS & VA Home Purchase Loans
B) Conventional Home Purchase Loans
C) Refinancings
D) Home Improvement Loans
F) Non-occupant Loans on < 5 Family Dwellings (A B C & D)
G) Loans On Manufactured Home Dwelling (A B C & D)
Number
Average Value
Number
Average Value
Number
Average Value
Number
Average Value
Number
Average Value
Number
Average Value
LOANS ORIGINATED
1
$133,180
21
$84,258
20
$79,656
8
$21,008
3
$65,747
1
$15,860
APPLICATIONS APPROVED, NOT ACCEPTED
0
$0
1
$151,570
4
$128,107
0
$0
1
$88,790
0
$0
APPLICATIONS DENIED
1
$26,640
4
$60,250
19
$98,868
6
$35,303
0
$0
1
$53,270
APPLICATIONS WITHDRAWN
0
$0
1
$81,810
6
$69,445
0
$0
0
$0
0
$0
FILES CLOSED FOR INCOMPLETENESS
0
$0
0
$0
1
$124,940
1
$15,860
0
$0
1
$15,860
Aggregated Statistics For Year 2005 (Based on 2 partial tracts)
A) FHA, FSA/RHS & VA Home Purchase Loans
B) Conventional Home Purchase Loans
C) Refinancings
D) Home Improvement Loans
F) Non-occupant Loans on < 5 Family Dwellings (A B C & D)
G) Loans On Manufactured Home Dwelling (A B C & D)
Number
Average Value
Number
Average Value
Number
Average Value
Number
Average Value
Number
Average Value
Number
Average Value
LOANS ORIGINATED
3
$84,137
23
$84,983
25
$104,770
7
$22,650
5
$51,878
0
$0
APPLICATIONS APPROVED, NOT ACCEPTED
0
$0
3
$19,237
5
$70,524
1
$8,880
0
$0
1
$11,420
APPLICATIONS DENIED
1
$55,180
10
$82,763
18
$95,588
5
$58,600
0
$0
0
$0
APPLICATIONS WITHDRAWN
0
$0
4
$95,765
8
$106,545
1
$50,740
1
$15,860
0
$0
FILES CLOSED FOR INCOMPLETENESS
0
$0
1
$94,500
7
$113,974
0
$0
0
$0
0
$0
Aggregated Statistics For Year 2004 (Based on 2 partial tracts)
A) FHA, FSA/RHS & VA Home Purchase Loans
B) Conventional Home Purchase Loans
C) Refinancings
D) Home Improvement Loans
F) Non-occupant Loans on < 5 Family Dwellings (A B C & D)
G) Loans On Manufactured Home Dwelling (A B C & D)
Number
Average Value
Number
Average Value
Number
Average Value
Number
Average Value
Number
Average Value
Number
Average Value
LOANS ORIGINATED
3
$96,610
18
$86,287
26
$123,059
6
$27,482
3
$235,923
1
$102,110
APPLICATIONS APPROVED, NOT ACCEPTED
0
$0
1
$60,250
5
$109,590
3
$44,393
1
$8,880
0
$0
APPLICATIONS DENIED
1
$101,470
6
$62,468
27
$89,164
6
$19,343
1
$54,540
0
$0
APPLICATIONS WITHDRAWN
0
$0
4
$103,692
8
$81,415
1
$64,690
0
$0
0
$0
FILES CLOSED FOR INCOMPLETENESS
0
$0
1
$157,280
1
$165,530
0
$0
0
$0
0
$0
Aggregated Statistics For Year 2003 (Based on 2 partial tracts)
A) FHA, FSA/RHS & VA Home Purchase Loans
B) Conventional Home Purchase Loans
C) Refinancings
D) Home Improvement Loans
F) Non-occupant Loans on < 5 Family Dwellings (A B C & D)
Number
Average Value
Number
Average Value
Number
Average Value
Number
Average Value
Number
Average Value
LOANS ORIGINATED
2
$96,080
16
$63,381
46
$90,870
4
$20,928
1
$53,270
APPLICATIONS APPROVED, NOT ACCEPTED
0
$0
2
$62,470
6
$105,383
0
$0
0
$0
APPLICATIONS DENIED
0
$0
6
$52,638
10
$86,949
4
$45,505
0
$0
APPLICATIONS WITHDRAWN
0
$0
2
$53,275
14
$94,768
0
$0
1
$20,290
FILES CLOSED FOR INCOMPLETENESS
0
$0
0
$0
1
$130,010
0
$0
0
$0
Aggregated Statistics For Year 1999 (Based on 1 partial tract)
A) FHA, FSA/RHS & VA Home Purchase Loans
B) Conventional Home Purchase Loans
C) Refinancings
D) Home Improvement Loans
F) Non-occupant Loans on < 5 Family Dwellings (A B C & D)
Detailed PMIC statistics for the following Tracts:0217.02
2002 - 2017 National Fire Incident Reporting System (NFIRS) incidents
According to the data from the years 2002 - 2017 the average number of fire incidents per year is 7. The highest number of reported fires - 28 took place in 2007, and the least - 0 in 2004. The data has a decreasing trend.
When looking into fire subcategories, the most incidents belonged to: Outside Fires (50.0%), and Structure Fires (28.7%).
Fire incident types reported to NFIRS in Zip Code 51535


+$4,689
-$74
(% of AGI for various income ranges: 1.5% for AGIs below $10k, 6.4% for AGIs $10k-25k, 0.4% for AGIs $25k-50k, -1.2% for AGIs $50k-75k, 8.2% for AGIs $75k-100k) Nearest zip codes: 51544, 51532, 50847, 50022, 51566, 50843.


 According to the data from the years 2002 - 2017 the average number of fire incidents per year is 7. The highest number of reported fires - 28 took place in 2007, and the least - 0 in 2004. The data has a decreasing trend.
 When looking into fire subcategories, the most incidents belonged to: Outside Fires (50.0%), and Structure Fires (28.7%).