Estimated zip code population in 2022: 9,469 Zip code population in 2010: 9,236 Zip code population in 2000: 8,475
Houses and condos: 3,825 Renter-occupied apartments: 682
% of renters here:
19%
State:
28%
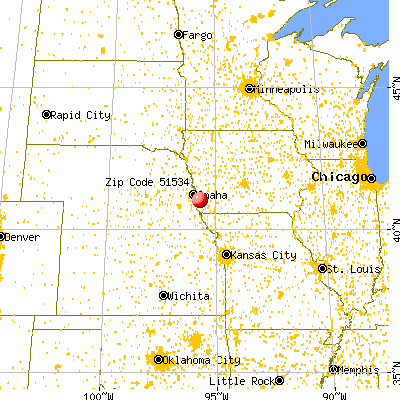
March 2022 cost of living index in zip code 51534: 88.5 (less than average, U.S. average is 100)
Land area: 100.4 sq. mi. Water area: 0.3 sq. mi.
Population density: 94 people per square mile
(very low).
OSM Map
General Map
Google Map
MSN Map
OSM Map
General Map
Google Map
MSN Map
OSM Map
General Map
Google Map
MSN Map
OSM Map
General Map
Google Map
MSN Map
Please wait while loading the map...
Real estate property taxes paid for housing units in 2022:
This zip code:
1.4% ($3,616)
Iowa:
1.4% ($2,724)
Median real estate property taxes paid for housing units with mortgages in 2022: $3,543 (1.3%) Median real estate property taxes paid for housing units with no mortgage in 2022: $3,811 (1.5%)
Business Search- 14 Million verified businesses
Males: 4,441
(46.9%)
Females: 5,027
(53.1%)
For population 25 years and over in 51534:
High school or higher: 97.3%
Bachelor's degree or higher: 33.4%
Graduate or professional degree: 11.5%
Unemployed: 4.6%
Mean travel time to work (commute): 23.4 minutes
For population 15 years and over in 51534:
Never married: 27.2%
Now married: 53.7%
Separated: 1.0%
Widowed: 6.0%
Divorced: 12.1%
Zip code 51534 compared to state average:
Black race population percentage significantly below state average.
Foreign-born population percentage significantly below state average.
Estimated median house/condo value in 2022: $261,360
51534:
$261,360
Iowa:
$194,600
According to our research of Iowa and other state lists, there were 4 registered sex offenders living in 51534 zip code as of July 03, 2024. The ratio of all residents to sex offenders in zip code 51534 is 2,391 to 1. The ratio of registered sex offenders to all residents in this zip code is much lower than the state average.
Median resident age:
This zip code:
41.9 years
Iowa median age:
38.9 years
Average household size:
This zip code:
2.6 people
Iowa:
2.3 people
Averages for the 2020 tax year for zip code 51534, filed in 2021:
Average Adjusted Gross Income (AGI) in 2020: $85,363 (Individual Income Tax Returns)
Here:
$85,363
State:
$71,087
Salary/wage: $68,517 (reported on 82.1% of returns)
Here:
$68,517
State:
$57,361
(% of AGI for various income ranges: 1080.3% for AGIs below $25k, 3408.9% for AGIs $25k-50k, 6080.8% for AGIs $50k-75k, 9765.3% for AGIs $75k-100k, 18964.2% for AGIs $100k-200k, 67905.7% for AGIs over 200k)
Taxable interest for individuals: $1,180 (reported on 35.1% of returns)
This zip code:
$1,180
Iowa:
$1,633
(% of AGI for various income ranges: 16.9% for AGIs below $25k, 23.5% for AGIs $25k-50k, 58.3% for AGIs $50k-75k, 99.1% for AGIs $75k-100k, 78.3% for AGIs $100k-200k, 657.1% for AGIs over 200k)
Ordinary dividends: $4,309 (reported on 19.3% of returns)
Here:
$4,309
State:
$5,432
(% of AGI for various income ranges: 14.7% for AGIs below $25k, 29.7% for AGIs $25k-50k, 74.0% for AGIs $50k-75k, 72.2% for AGIs $75k-100k, 183.3% for AGIs $100k-200k, 2387.1% for AGIs over 200k)
Net capital gain/loss in AGI: +$11,476 (reported on 17.9% of returns)
Here:
+$11,476
State:
+$15,243
(% of AGI for various income ranges: 13.8% for AGIs below $25k, 29.6% for AGIs $25k-50k, 60.2% for AGIs $50k-75k, 120.3% for AGIs $75k-100k, 539.8% for AGIs $100k-200k, 7037.1% for AGIs over 200k)
Profit/loss from business: +$11,656 (reported on 13.4% of returns)
Here:
+$11,656
State:
+$11,763
(% of AGI for various income ranges: 65.5% for AGIs below $25k, 64.3% for AGIs $25k-50k, 153.1% for AGIs $50k-75k, 88.8% for AGIs $75k-100k, 390.4% for AGIs $100k-200k, 3781.4% for AGIs over 200k)
Taxable individual retirement arrangement distribution: $17,814 (reported on 9.9% of returns)
51534:
$17,814
Iowa:
$17,324
(% of AGI for various income ranges: 43.9% for AGIs below $25k, 125.7% for AGIs $25k-50k, 174.6% for AGIs $50k-75k, 341.2% for AGIs $75k-100k, 604.2% for AGIs $100k-200k, 1685.7% for AGIs over 200k)
Total itemized deductions: $32,282 (reported on 8.0% of returns)
Here:
$32,282
State:
$33,775
(% of AGI for various income ranges: 135.6% for AGIs $25k-50k, 247.3% for AGIs $50k-75k, 394.7% for AGIs $75k-100k, 756.7% for AGIs $100k-200k, 5164.3% for AGIs over 200k)
Charity contributions: $12,400 (reported on 6.4% of returns)
Here:
$12,400
State:
$13,075
(% of AGI for various income ranges: 9.6% for AGIs below $25k, 37.1% for AGIs $50k-75k, 64.4% for AGIs $75k-100k, 155.6% for AGIs $100k-200k, 2977.1% for AGIs over 200k)
Taxes paid: $8,182 (reported on 8.0% of returns)
51534:
$8,182
State:
$7,704
(% of AGI for various income ranges: 25.4% for AGIs $25k-50k, 65.6% for AGIs $50k-75k, 107.5% for AGIs $75k-100k, 234.8% for AGIs $100k-200k, 1027.1% for AGIs over 200k)
Earned income credit: $2,188 (reported on 9.6% of returns)
Here:
$2,188
State:
$2,195
(% of AGI for various income ranges: 64.9% for AGIs below $25k, 57.9% for AGIs $25k-50k)
Percentage of individuals using paid preparers for their 2020 taxes: 94.6%
Here:
95%
State:
95%
(% for various income ranges: 94.0% for AGIs below $25k, 94.6% for AGIs $25k-50k, 93.9% for AGIs $50k-75k, 93.9% for AGIs $75k-100k, 96.9% for AGIs $100k-200k, 90.9% for AGIs over 200k)
Averages for the 2012 tax year for zip code 51534, filed in 2013:
Average Adjusted Gross Income (AGI) in 2012: $64,998 (Individual Income Tax Returns)
Here:
$64,998
State:
$58,860
Salary/wage: $53,742 (reported on 85.8% of returns)
Here:
$53,742
State:
$46,659
(% of AGI for various income ranges: 75.4% for AGIs below $25k, 78.6% for AGIs $25k-50k, 76.2% for AGIs $50k-75k, 80.2% for AGIs $75k-100k, 75.2% for AGIs $100k-200k, 45.2% for AGIs over 200k)
Taxable interest for individuals: $1,156 (reported on 36.4% of returns)
This zip code:
$1,156
Iowa:
$1,537
(% of AGI for various income ranges: 1.2% for AGIs below $25k, 0.5% for AGIs $25k-50k, 0.7% for AGIs $50k-75k, 0.4% for AGIs $75k-100k, 0.6% for AGIs $100k-200k, 0.8% for AGIs over 200k)
Ordinary dividends: $2,540 (reported on 20.2% of returns)
Here:
$2,540
State:
$4,542
(% of AGI for various income ranges: 0.8% for AGIs below $25k, 0.8% for AGIs $25k-50k, 0.6% for AGIs $50k-75k, 0.4% for AGIs $75k-100k, 0.7% for AGIs $100k-200k, 1.4% for AGIs over 200k)
Net capital gain/loss in AGI: +$11,613 (reported on 15.5% of returns)
Here:
+$11,613
State:
+$11,802
(% of AGI for various income ranges: 0.1% for AGIs $25k-50k, 0.9% for AGIs $50k-75k, 0.5% for AGIs $75k-100k, 1.6% for AGIs $100k-200k, 10.6% for AGIs over 200k)
Profit/loss from business: +$6,793 (reported on 14.0% of returns)
Here:
+$6,793
State:
+$10,509
(% of AGI for various income ranges: 4.2% for AGIs below $25k, 1.4% for AGIs $25k-50k, 2.1% for AGIs $50k-75k, 1.1% for AGIs $75k-100k, 0.9% for AGIs $100k-200k, 1.4% for AGIs over 200k)
Taxable individual retirement arrangement distribution: $10,510 (reported on 10.0% of returns)
51534:
$10,510
Iowa:
$11,773
(% of AGI for various income ranges: 2.9% for AGIs below $25k, 1.8% for AGIs $25k-50k, 2.1% for AGIs $50k-75k, 1.5% for AGIs $75k-100k, 2.1% for AGIs $100k-200k)
Total itemized deductions: $21,282 (20% of AGI, reported on 41.1% of returns)
Here:
$21,282
State:
$21,278
Here:
19.5% of AGI
State:
18.9% of AGI
(% of AGI for various income ranges: 11.5% for AGIs below $25k, 10.6% for AGIs $25k-50k, 13.5% for AGIs $50k-75k, 14.3% for AGIs $75k-100k, 15.6% for AGIs $100k-200k, 12.0% for AGIs over 200k)
Charity contributions: $3,301 (reported on 32.7% of returns)
Here:
$3,301
State:
$4,044
(% of AGI for various income ranges: 0.7% for AGIs below $25k, 0.8% for AGIs $25k-50k, 1.4% for AGIs $50k-75k, 1.4% for AGIs $75k-100k, 2.0% for AGIs $100k-200k, 2.4% for AGIs over 200k)
Taxes paid: $9,267 (reported on 41.1% of returns)
51534:
$9,267
State:
$8,846
(% of AGI for various income ranges: 2.7% for AGIs below $25k, 3.2% for AGIs $25k-50k, 4.6% for AGIs $50k-75k, 5.7% for AGIs $75k-100k, 7.4% for AGIs $100k-200k, 7.4% for AGIs over 200k)
Earned income credit: $2,130 (reported on 13.2% of returns)
Here:
$2,130
State:
$2,098
(% of AGI for various income ranges: 5.4% for AGIs below $25k, 1.0% for AGIs $25k-50k)
Percentage of individuals using paid preparers for their 2012 taxes: 64.6%
Here:
65%
State:
65%
(% for various income ranges: 54.9% for AGIs below $25k, 64.2% for AGIs $25k-50k, 74.2% for AGIs $50k-75k, 66.7% for AGIs $75k-100k, 69.5% for AGIs $100k-200k, 83.3% for AGIs over 200k)
Averages for the 2004 tax year for zip code 51534, filed in 2005:
Average Adjusted Gross Income (AGI) in 2004: $49,122 (Individual Income Tax Returns)
Here:
$49,122
State:
$43,875
Salary/wage: $45,222 (reported on 87.2% of returns)
Here:
$45,222
State:
$38,265
(% of AGI for various income ranges: 197.7% for AGIs below $10k, 70.6% for AGIs $10k-25k, 82.8% for AGIs $25k-50k, 84.5% for AGIs $50k-75k, 86.3% for AGIs $75k-100k, 71.0% for AGIs over 100k)
Taxable interest for individuals: $1,272 (reported on 51.7% of returns)
This zip code:
$1,272
Iowa:
$1,768
(% of AGI for various income ranges: 10.1% for AGIs below $10k, 3.5% for AGIs $10k-25k, 1.3% for AGIs $25k-50k, 1.4% for AGIs $50k-75k, 0.8% for AGIs $75k-100k, 1.0% for AGIs over 100k)
Taxable dividends: $1,817 (reported on 25.5% of returns)
Here:
$1,817
State:
$2,510
(% of AGI for various income ranges: 3.6% for AGIs below $10k, 1.0% for AGIs $10k-25k, 0.7% for AGIs $25k-50k, 0.4% for AGIs $50k-75k, 0.4% for AGIs $75k-100k, 1.7% for AGIs over 100k)
Net capital gain/loss: +$4,357 (reported on 20.8% of returns)
Here:
+$4,357
State:
+$6,139
(% of AGI for various income ranges: -3.9% for AGIs below $10k, 2.2% for AGIs $10k-25k, 0.6% for AGIs $25k-50k, 0.9% for AGIs $50k-75k, 1.1% for AGIs $75k-100k, 3.7% for AGIs over 100k)
Profit/loss from business: +$9,030 (reported on 15.4% of returns)
Here:
+$9,030
State:
+$8,574
(% of AGI for various income ranges: 4.1% for AGIs below $10k, 5.5% for AGIs $10k-25k, 2.2% for AGIs $25k-50k, 1.9% for AGIs $50k-75k, 2.0% for AGIs $75k-100k, 3.8% for AGIs over 100k)
IRA payment deduction: $3,113 (reported on 2.6% of returns)
51534:
$3,113
Iowa:
$2,970
(% of AGI for various income ranges: 0.4% for AGIs $10k-25k, 0.3% for AGIs $25k-50k, 0.1% for AGIs $50k-75k, 0.1% for AGIs $75k-100k, 0.1% for AGIs over 100k)
Self-employed pension: $14,400 (reported on 0.3% of returns)
Here:
$14,400
Iowa:
$11,928
Total itemized deductions: $17,079 (21% of AGI, reported on 43.3% of returns)
Here:
$17,079
State:
$16,976
Here:
21.5% of AGI
State:
20.8% of AGI
(% of AGI for various income ranges: 41.9% for AGIs below $10k, 11.9% for AGIs $10k-25k, 12.4% for AGIs $25k-50k, 15.3% for AGIs $50k-75k, 17.7% for AGIs $75k-100k, 14.6% for AGIs over 100k)
Charity contributions deductions: $2,171 (3% of AGI, reported on 36.9% of returns)
Here:
$2,171
State:
$3,089
Here:
2.6% of AGI
State:
3.6% of AGI
(% of AGI for various income ranges: 1.3% for AGIs below $10k, 1.0% for AGIs $10k-25k, 1.0% for AGIs $25k-50k, 1.6% for AGIs $50k-75k, 1.9% for AGIs $75k-100k, 1.9% for AGIs over 100k)
Total tax: $6,430 (reported on 80.0% of returns)
51534:
$6,430
State:
$6,177
(% of AGI for various income ranges: 4.8% for AGIs below $10k, 4.3% for AGIs $10k-25k, 6.8% for AGIs $25k-50k, 7.8% for AGIs $50k-75k, 9.3% for AGIs $75k-100k, 16.4% for AGIs over 100k)
Earned income credit: $1,558 (reported on 10.3% of returns)
Here:
$1,558
State:
$1,540
Percentage of individuals using paid preparers for their 2004 taxes: 67.0%
Here:
67%
State:
70%
(% for various income ranges: 55.3% for AGIs below $10k, 67.4% for AGIs $10k-25k, 67.9% for AGIs $25k-50k, 72.5% for AGIs $50k-75k, 72.3% for AGIs $75k-100k, 68.7% for AGIs over 100k)
Household received Food Stamps/SNAP in the past 12 months: 244 Household did not receive Food Stamps/SNAP in the past 12 months: 3,279
Women who had a birth in the past 12 months: 54 (33 now married, 19 unmarried) Women who did not have a birth in the past 12 months: 1,917 (891 now married, 1,025 unmarried)
Housing units in zip code 51534 with a mortgage: 1,927 (185 second mortgage, 17 home equity loan, 138 both second mortgage and home equity loan) Houses without a mortgage: 76
Median monthly owner costs for units with a mortgage: $1,551 Median monthly owner costs for units without a mortgage: $691
Residents with income below the poverty level in 2022:
This zip code:
6.9%
Whole state:
11.0%
Residents with income below 50% of the poverty level in 2022:
This zip code:
4.2%
Whole state:
5.5%
Median number of rooms in houses and condos:
Here:
7.2
State:
6.8
Median number of rooms in apartments:
Here:
3.8
State:
4.2
Notable locations in this zip code not listed on our city pages
Notable locations in zip code 51534: Shady Grove School (A), Wahaghbonsy (B), Elm Grove School (C), Estes School (D), Four Corners School (E), Lutherische Kirche (F), Glenwood (G), Glenwood Golf Course (H), Glenwood Recreation Complex (I), Pleasant Ridge School (J), Mills County Jail (K), Glenwood City Library (L), Mills County Museum (M), Glenwood Police Department (N), Mills County Courthouse (O), Mills County Sheriffs Office (P), Glenwood Volunteer Fire and Rescue Department (Q). Display/hide their locations on the map
Churches in zip code 51534 include: Waubonsie Bible Church (A), Holy Rosary Church (B), Glenwood Evangelical Free Church (C), First Church of the Nazarene (D), Nazarene Church (E), Bible Baptist Church (F), Saint John Episcopal Church (G), First Christian Church (H), First Baptist Church (I). Display/hide their locations on the map
Cemeteries: Plumer Cemetery (1), Glenwood Cemetery (2), State Cemetery (3), Waubonsie Cemetery (4), Saint Boniface Cemetery (5), Somar Family on Wright Farm Cemetery (6), County Farm Cemetery (7). Display/hide their locations on the map
Parks in zip code 51534 include: Mile Hill Lake Park (1), Tree Lake Park (2), Three Early Trails Historical Marker (3), Glenwood Lake Park (4), Grave of Chief Waubonsie Historical Marker (5). Display/hide their locations on the map
In group quarters: 401 (-1 institutionalized population)
Size of family households: 1,247 2-persons, 416 3-persons, 479 4-persons, 190 5-persons, 21 7-or-more-persons
Size of nonfamily households: 1,059 1-person, 95 2-persons
1,788 married couples with children.
450 single-parent households (93 men, 357 women).
97.3% of residents of 51534 zip code speak English at home.
1.5% of residents speak Spanish at home (53% very well, 26% not well, 20% not at all).
0.4% of residents speak other Indo-European language at home (97% very well, 3% not at all).
0.6% of residents speak Asian or Pacific Island language at home (62% very well, 38% well).
Foreign born population: 177 (1.9%) (40.6% of them are naturalized citizens)
This zip code:
1.9%
Whole state:
6.0%
30%Azores Islands
18%Malaysia
16%Honduras
11%France
5%Ethiopia
4%Germany
3%Thailand
32%German
22%English
10%American
4%Irish
3%European
3%Danish
3%Italian
Year of entry for the foreign-born population
742010 or later
322000 to 2009
91990 to 1999
100Before 1990
Facilities with environmental interests located in this zip code:
NORTHEAST ELEMENTARY SCHOOL (901N. VINE STREET in GLENWOOD, IA)
(Geographic Names Information System) (National Center for Education Statistics) - STATE ID-652511 406 Organizations: GLENWOOD COMM SCHOOL DISTRICT (SCHOOL DISTRICT)
BUILDING BRIDGES (102 CENTRAL, SUITE 100 in GLENWOOD, IA)
(National Center for Education Statistics) - STATE ID-652511 114 Organizations: GLENWOOD COMM SCHOOL DISTRICT (SCHOOL DISTRICT)
UNITOG RENTAL SERVICES (505 NUCKOLLS ST in GLENWOOD, IA)
AIR MINOR (AIRS/AFS) (Resource Conservation and Recovery Act (tracking hazardous waste)) Business SIC classification: INDUSTRIAL LAUNDERERS Organizations: UNITOG RENTAL SERVICES INC (CONTACT/OWNER)
Alternative names: CINTAS CORP
TRAJET PRODUCTS INC (1003 SOUTH HAZEL STREET in GLENWOOD, IA)
AIR MAJOR (AIRS/AFS) CRITERIA AND HAZARDOUS AIR POLLUTANT INVENTORY (Inventory of air pollution sources) (Resource Conservation and Recovery Act (tracking hazardous waste)) TRI REPORTER (Tracking of toxic chemicals releasing facilities) Business SIC classification: CUSTOM COMPOUNDING OF PURCHASED PLASTICS RESINS; PLASTICS PLUMBING FIXTURES; ORTHOPEDIC, PROSTHETIC, AND SURGICAL APPLIANCES AND SUPPLIES Business NAICS classification: CUSTOM COMPOUNDING OF PURCHASED RESINS. Alternative names: TRAJET WHIRLPOOL BATHS
SIEBERT ASSOC (514 SHARP ST in GLENWOOD, IA)
(Resource Conservation and Recovery Act (tracking hazardous waste)) Organizations: V WILLIAM NISSEN (CONTACT/OWNER)
Alternative names: HAWKINS-MARSH FORD
PRIVATE RESIDENCE OF GENEVA RUTLEDGE (231 W FLORENCE in GLENWOOD, IA)
(Resource Conservation and Recovery Act (tracking hazardous waste))
BREADEAUX'S PIZZA (111 SHARP ST in GLENWOOD, IA)
(Resource Conservation and Recovery Act (tracking hazardous waste))
COHRON READY MIX (105 RAILROAD AVENUE in GLENWOOD, IA)
AIR MINOR (AIRS/AFS) Business SIC classification: READY-MIXED CONCRETE Alternative names: A M COHRON & SON INCORPORATED, LYMAN RICHEY
SWIFT FRESH MEATS (P.O. BOX 71 in GLENWOOD, IA)
AIR MINOR (AIRS/AFS) Business SIC classification: NONCLASSIFIABLE ESTABLISHMENTS
TERRY THOMAS AUTO CENTER (58649 LOCUST AVE in GLENWOOD, IA)
Small Quantity Generators, between 100 kg and 1000 kg of hazardous waste/month (Resource Conservation and Recovery Act (tracking hazardous waste)) Alternative names: GLENWOOD AUTO SALES
RINGS PROFESSIONAL CLEANER (409 COLLIDGE ST in GLENWOOD, IA)
Conditionally Exempt Small Quantity Generators, less than 100 kg/month of hazardous waste (Resource Conservation and Recovery Act (tracking hazardous waste))
OFFUTT (EX) TVOR ANNEX (2 MILES S GLENWOOD in GLENWOOD, IA)
SUPERFUND (Superfund database) Alternative names: OFFUTT TVOR (EX) ANNEX
Housing units lacking complete plumbing facilities: 2.4% Housing units lacking complete kitchen facilities: 1.8%
52.5%Utility gas
25.8%Bottled, tank, or LP gas
19.6%Electricity
0.8%Wood
Population in 1990: 6,392. Population change in the 1990s: +2,083 (+32.6%).
Place of birth for U.S.-born residents:
This state: 4,029
Northeast: 250
Midwest: 3,801
South: 596
West: 483
51% of the 51534 zip code residents lived in the same house 5 years ago. Out of people who lived in different houses, 52% lived in this county. Out of people who lived in different counties, 50% lived in Iowa.
87% of the 51534 zip code residents lived in the same house 1 year ago. Out of people who lived in different houses, 39% moved from this county. Out of people who lived in different houses, 19% moved from different county within same state. Out of people who lived in different houses, 41% moved from different state.
Private vs. public school enrollment:
Students in private schools in grades 1 to 8 (elementary and middle school): 149
Here:
14.8%
Iowa:
10.6%
Students in private schools in grades 9 to 12 (high school): 32
Here:
6.1%
Iowa:
7.9%
Students in private undergraduate colleges: 24
Here:
8.5%
Iowa:
23.9%
Occupation by median earnings in the past 12 months ($)
132,350Architecture and engineering occupations
125,960Law enforcement workers including supervisors
82,559Computer and mathematical occupations
80,894Management occupations
77,598Health diagnosing and treating practitioners and other technical occupations
77,327Business and financial operations occupations
Companies with federal contracts located in this zip code:
PITZER, JOHN SALES (59364 HILMAN in GLENWOOD, IA; small business)
$7,192 with Air Force for Airfield Specialized Trucks and Trailers. Signed on 2004-05-06. Completion date: 2004-05-13.
GOLKA III, THEODORE T (21665 BARRUS RD in GLENWOOD, IA; small business) : $3,237 in 2 contractsin 2004
$2,880 with Army for Live Animals, Not Raised for Food. Signed on 2004-07-27. Completion date: 2004-08-02.
$357, same as above.Signed on 2004-08-04. Completion date: 2004-08-02.
Top industries in this zip code by the number of employees in 2005:
Health Care and Social Assistance: Nursing Care Facilities (250-499 employees: 1 establishment, 50-99 employees: 2 establishments)
Other Services (except Public Administration): Industrial Launderers (100-249: 1)
Finance and Insurance: Commercial Banking (20-49: 2)
Other Services (except Public Administration): Automotive Body, Paint, and Interior Repair and Maintenance (20-49: 1, 1-4: 5)
Health Care and Social Assistance: Offices of Physicians (except Mental Health Specialists) (20-49: 1, 5-9: 1, 1-4: 1)
People in group quarters in 2010:
300 people in state prisons
109 people in residential treatment centers for adults
94 people in nursing facilities/skilled-nursing facilities
28 people in group homes intended for adults
13 people in group homes for juveniles (non-correctional)
8 people in local jails and other municipal confinement facilities
People in group quarters in 2000:
367 people in schools, hospitals, or wards for the intellectually disabled
114 people in homes for the mentally retarded
71 people in nursing homes
32 people in homes for the physically handicapped
15 people in institutions for the blind
14 people in orthopedic wards and institutions for the physically handicapped
13 people in local jails and other confinement facilities (including police lockups)
Fatal accident statistics in 2014:
Fatal accident count: 1
Vehicles involved in fatal accidents: 1
Fatal accidents caused by drunken drivers: 0
Fatalities: 1
Persons involved in fatal accidents: 1
Pedestrians involved in fatal accidents: 0
Fatal accident statistics in 2013:
Fatal accident count: 1
Vehicles involved in fatal accidents: 1
Fatal accidents caused by drunken drivers: 0
Fatalities: 1
Persons involved in fatal accidents: 1
Pedestrians involved in fatal accidents: 0
2002 - 2018 National Fire Incident Reporting System (NFIRS) incidents
According to the data from the years 2002 - 2018 the average number of fire incidents per year is 21. The highest number of reported fires - 69 took place in 2017, and the least - 0 in 2004. The data has an increasing trend.
When looking into fire subcategories, the most incidents belonged to: Outside Fires (55.9%), and Structure Fires (25.8%).
Fire incident types reported to NFIRS in Zip Code 51534


 Nearest zip codes: 51561, 51554, 51551, 51571, 51653, 51503.


 According to the data from the years 2002 - 2018 the average number of fire incidents per year is 21. The highest number of reported fires - 69 took place in 2017, and the least - 0 in 2004. The data has an increasing trend.
 When looking into fire subcategories, the most incidents belonged to: Outside Fires (55.9%), and Structure Fires (25.8%).