Estimated zip code population in 2022: 1,751 Zip code population in 2010: 2,057 Zip code population in 2000: 2,288
Houses and condos: 853 Renter-occupied apartments: 185
% of renters here:
23%
State:
28%
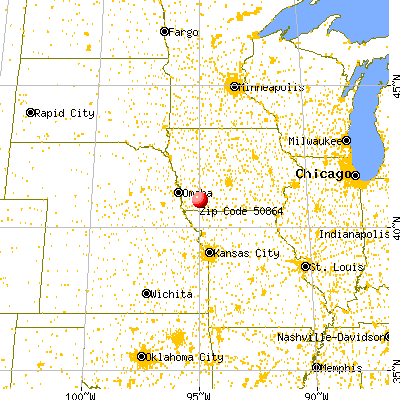
March 2022 cost of living index in zip code 50864: 82.0 (low, U.S. average is 100)
Land area: 145.5 sq. mi. Water area: 0.3 sq. mi.
Population density: 12 people per square mile
(very low).
OSM Map
General Map
Google Map
MSN Map
OSM Map
General Map
Google Map
MSN Map
OSM Map
General Map
Google Map
MSN Map
OSM Map
General Map
Google Map
MSN Map
Please wait while loading the map...
Real estate property taxes paid for housing units in 2022:
This zip code:
1.5% ($1,461)
Iowa:
1.4% ($2,724)
Median real estate property taxes paid for housing units with mortgages in 2022: $1,558 (1.5%) Median real estate property taxes paid for housing units with no mortgage in 2022: $1,388 (1.5%)
Business Search- 14 Million verified businesses
Males: 872
(49.8%)
Females: 878
(50.2%)
For population 25 years and over in 50864:
High school or higher: 89.8%
Bachelor's degree or higher: 14.8%
Graduate or professional degree: 2.2%
Unemployed: 0.8%
Mean travel time to work (commute): 22.0 minutes
For population 15 years and over in 50864:
Never married: 21.0%
Now married: 54.4%
Separated: 2.8%
Widowed: 9.6%
Divorced: 12.3%
Zip code 50864 compared to state average:
Median house value below state average.
Unemployed percentage significantly below state average.
Black race population percentage significantly below state average.
Hispanic race population percentage significantly below state average.
Median age significantly above state average.
Foreign-born population percentage significantly below state average.
Length of stay since moving in significantly above state average.
Number of college students significantly below state average.
Percentage of population with a bachelor's degree or higher below state average.
Estimated median house/condo value in 2022: $99,336
50864:
$99,336
Iowa:
$194,600
According to our research of Iowa and other state lists, there was 1 registered sex offender living in 50864 zip code as of July 09, 2024. The ratio of all residents to sex offenders in zip code 50864 is 1,977 to 1. The ratio of registered sex offenders to all residents in this zip code is much lower than the state average.
Median resident age:
This zip code:
49.1 years
Iowa median age:
38.9 years
Average household size:
This zip code:
2.1 people
Iowa:
2.3 people
Averages for the 2020 tax year for zip code 50864, filed in 2021:
Average Adjusted Gross Income (AGI) in 2020: $54,796 (Individual Income Tax Returns)
Here:
$54,796
State:
$71,087
Salary/wage: $42,786 (reported on 80.0% of returns)
Here:
$42,786
State:
$57,361
(% of AGI for various income ranges: 1100.0% for AGIs below $25k, 3713.1% for AGIs $25k-50k, 6812.0% for AGIs $50k-75k, 11268.0% for AGIs $75k-100k, 18365.0% for AGIs $100k-200k)
Taxable interest for individuals: $727 (reported on 32.5% of returns)
This zip code:
$727
Iowa:
$1,633
(% of AGI for various income ranges: 28.0% for AGIs below $25k, 25.6% for AGIs $25k-50k, 22.0% for AGIs $50k-75k, 34.0% for AGIs $75k-100k, 167.5% for AGIs $100k-200k)
Ordinary dividends: $3,507 (reported on 17.5% of returns)
Here:
$3,507
State:
$5,432
(% of AGI for various income ranges: 29.3% for AGIs below $25k, 32.5% for AGIs $25k-50k, 70.0% for AGIs $50k-75k, 34.0% for AGIs $75k-100k, 770.0% for AGIs $100k-200k)
Net capital gain/loss in AGI: +$7,793 (reported on 18.8% of returns)
Here:
+$7,793
State:
+$15,243
(% of AGI for various income ranges: 60.6% for AGIs $25k-50k, 107.0% for AGIs $50k-75k, 112.0% for AGIs $75k-100k, 2272.5% for AGIs $100k-200k)
Profit/loss from business: +$7,054 (reported on 16.2% of returns)
Here:
+$7,054
State:
+$11,763
(% of AGI for various income ranges: 159.3% for AGIs below $25k, 110.6% for AGIs $25k-50k, 352.0% for AGIs $50k-75k, 372.5% for AGIs $100k-200k)
Taxable individual retirement arrangement distribution: $13,700 (reported on 11.2% of returns)
50864:
$13,700
Iowa:
$17,324
(% of AGI for various income ranges: 220.6% for AGIs $25k-50k, 418.0% for AGIs $50k-75k, 1155.0% for AGIs $100k-200k)
Total itemized deductions: $31,650 (reported on 2.5% of returns)
Here:
$31,650
State:
$33,775
(% of AGI for various income ranges: 422.0% for AGIs below $25k)
Earned income credit: $2,133 (reported on 15.0% of returns)
Here:
$2,133
State:
$2,195
(% of AGI for various income ranges: 103.3% for AGIs below $25k, 63.1% for AGIs $25k-50k)
Percentage of individuals using paid preparers for their 2020 taxes: 96.2%
Here:
96%
State:
95%
(% for various income ranges: 95.7% for AGIs below $25k, 95.5% for AGIs $25k-50k, 93.3% for AGIs $50k-75k, 100.0% for AGIs $75k-100k, 100.0% for AGIs $100k-200k)
Averages for the 2012 tax year for zip code 50864, filed in 2013:
Average Adjusted Gross Income (AGI) in 2012: $50,324 (Individual Income Tax Returns)
Here:
$50,324
State:
$58,860
Salary/wage: $36,345 (reported on 83.5% of returns)
Here:
$36,345
State:
$46,659
(% of AGI for various income ranges: 72.4% for AGIs below $25k, 78.3% for AGIs $25k-50k, 71.2% for AGIs $50k-75k, 70.3% for AGIs $75k-100k, 32.4% for AGIs $100k-200k)
Taxable interest for individuals: $1,061 (reported on 38.8% of returns)
This zip code:
$1,061
Iowa:
$1,537
(% of AGI for various income ranges: 1.8% for AGIs below $25k, 0.8% for AGIs $25k-50k, 0.4% for AGIs $50k-75k, 0.5% for AGIs $75k-100k, 1.0% for AGIs $100k-200k)
Ordinary dividends: $2,538 (reported on 18.8% of returns)
Here:
$2,538
State:
$4,542
(% of AGI for various income ranges: 1.1% for AGIs below $25k, 1.5% for AGIs $25k-50k, 0.8% for AGIs $75k-100k, 1.2% for AGIs $100k-200k)
Net capital gain/loss in AGI: +$9,638 (reported on 18.8% of returns)
Here:
+$9,638
State:
+$11,802
(% of AGI for various income ranges: 0.8% for AGIs below $25k, 1.3% for AGIs $25k-50k, 1.4% for AGIs $50k-75k, 1.8% for AGIs $75k-100k, 8.4% for AGIs $100k-200k)
Profit/loss from business: +$7,053 (reported on 17.6% of returns)
Here:
+$7,053
State:
+$10,509
(% of AGI for various income ranges: 5.6% for AGIs below $25k, 4.3% for AGIs $25k-50k, 3.6% for AGIs $50k-75k, 1.2% for AGIs $100k-200k)
Taxable individual retirement arrangement distribution: $8,400 (reported on 9.4% of returns)
50864:
$8,400
Iowa:
$11,773
(% of AGI for various income ranges: 3.3% for AGIs below $25k, 3.3% for AGIs $25k-50k, 3.2% for AGIs $75k-100k)
Total itemized deductions: $18,269 (20% of AGI, reported on 18.8% of returns)
Here:
$18,269
State:
$21,278
Here:
19.5% of AGI
State:
18.9% of AGI
(% of AGI for various income ranges: 7.9% for AGIs below $25k, 6.7% for AGIs $25k-50k, 6.5% for AGIs $50k-75k, 5.8% for AGIs $75k-100k, 7.5% for AGIs $100k-200k)
Charity contributions: $3,480 (reported on 11.8% of returns)
Here:
$3,480
State:
$4,044
(% of AGI for various income ranges: 1.4% for AGIs $25k-50k, 0.8% for AGIs $75k-100k, 1.2% for AGIs $100k-200k)
Taxes paid: $6,125 (reported on 18.8% of returns)
50864:
$6,125
State:
$8,846
(% of AGI for various income ranges: 1.2% for AGIs below $25k, 1.4% for AGIs $25k-50k, 1.5% for AGIs $50k-75k, 1.9% for AGIs $75k-100k, 3.9% for AGIs $100k-200k)
Earned income credit: $2,217 (reported on 21.2% of returns)
Here:
$2,217
State:
$2,098
(% of AGI for various income ranges: 6.6% for AGIs below $25k, 1.6% for AGIs $25k-50k)
Percentage of individuals using paid preparers for their 2012 taxes: 71.8%
Here:
72%
State:
65%
(% for various income ranges: 64.5% for AGIs below $25k, 69.6% for AGIs $25k-50k, 78.6% for AGIs $50k-75k, 80.0% for AGIs $75k-100k, 85.7% for AGIs $100k-200k)
Averages for the 2004 tax year for zip code 50864, filed in 2005:
Average Adjusted Gross Income (AGI) in 2004: $31,403 (Individual Income Tax Returns)
Here:
$31,403
State:
$43,875
Salary/wage: $28,614 (reported on 82.4% of returns)
Here:
$28,614
State:
$38,265
(% of AGI for various income ranges: 121.9% for AGIs below $10k, 75.3% for AGIs $10k-25k, 74.7% for AGIs $25k-50k, 81.5% for AGIs $50k-75k, 70.6% for AGIs $75k-100k, 48.3% for AGIs over 100k)
Taxable interest for individuals: $1,707 (reported on 47.7% of returns)
This zip code:
$1,707
Iowa:
$1,768
(% of AGI for various income ranges: 10.2% for AGIs below $10k, 3.2% for AGIs $10k-25k, 2.8% for AGIs $25k-50k, 1.4% for AGIs $50k-75k, 3.7% for AGIs $75k-100k, 0.5% for AGIs over 100k)
Taxable dividends: $1,022 (reported on 24.8% of returns)
Here:
$1,022
State:
$2,510
(% of AGI for various income ranges: 1.9% for AGIs below $10k, 0.6% for AGIs $10k-25k, 0.6% for AGIs $25k-50k, 0.9% for AGIs $50k-75k, 1.7% for AGIs $75k-100k, 0.3% for AGIs over 100k)
Net capital gain/loss: +$1,975 (reported on 21.3% of returns)
Here:
+$1,975
State:
+$6,139
(% of AGI for various income ranges: -0.3% for AGIs below $10k, 1.0% for AGIs $10k-25k, 1.1% for AGIs $25k-50k, 2.0% for AGIs $50k-75k, 2.2% for AGIs $75k-100k)
Profit/loss from business: +$7,346 (reported on 17.1% of returns)
Here:
+$7,346
State:
+$8,574
(% of AGI for various income ranges: 7.0% for AGIs below $10k, 5.3% for AGIs $10k-25k, 4.9% for AGIs $25k-50k, 3.4% for AGIs $50k-75k, 3.3% for AGIs $75k-100k)
Profit/loss from farming: +$3,125 (reported on 14.6% of returns)
Here:
+$3,125
State:
-$74
(% of AGI for various income ranges: -8.0% for AGIs below $10k, 1.4% for AGIs $10k-25k, 2.6% for AGIs $25k-50k, 1.9% for AGIs $50k-75k, 0.3% for AGIs $75k-100k)
IRA payment deduction: $3,765 (reported on 1.8% of returns)
50864:
$3,765
Iowa:
$2,970
Total itemized deductions: $15,197 (29% of AGI, reported on 15.3% of returns)
Here:
$15,197
State:
$16,976
Here:
29.2% of AGI
State:
20.8% of AGI
(% of AGI for various income ranges: 21.9% for AGIs below $10k, 3.6% for AGIs $10k-25k, 8.0% for AGIs $25k-50k, 7.6% for AGIs $50k-75k, 7.0% for AGIs $75k-100k, 8.5% for AGIs over 100k)
Charity contributions deductions: $1,826 (3% of AGI, reported on 11.7% of returns)
Here:
$1,826
State:
$3,089
Here:
3.3% of AGI
State:
3.6% of AGI
(% of AGI for various income ranges: 0.3% for AGIs $10k-25k, 0.7% for AGIs $25k-50k, 0.7% for AGIs $50k-75k, 1.0% for AGIs $75k-100k, 0.9% for AGIs over 100k)
Total tax: $3,425 (reported on 76.1% of returns)
50864:
$3,425
State:
$6,177
(% of AGI for various income ranges: 4.7% for AGIs below $10k, 4.8% for AGIs $10k-25k, 7.0% for AGIs $25k-50k, 8.1% for AGIs $50k-75k, 11.2% for AGIs $75k-100k, 17.9% for AGIs over 100k)
Earned income credit: $1,911 (reported on 17.0% of returns)
Here:
$1,911
State:
$1,540
Percentage of individuals using paid preparers for their 2004 taxes: 72.7%
Here:
73%
State:
70%
(% for various income ranges: 63.5% for AGIs below $10k, 73.1% for AGIs $10k-25k, 73.0% for AGIs $25k-50k, 80.0% for AGIs $50k-75k, 84.4% for AGIs $75k-100k, 76.5% for AGIs over 100k)
Likely homosexual households (counted as self-reported same-sex unmarried-partner households)
Lesbian couples: 0.3% of all households
Gay men: 0.0% of all households
Household received Food Stamps/SNAP in the past 12 months: 93 Household did not receive Food Stamps/SNAP in the past 12 months: 709
Women who had a birth in the past 12 months: 19 (15 now married, 3 unmarried) Women who did not have a birth in the past 12 months: 244 (101 now married, 143 unmarried)
Housing units in zip code 50864 with a mortgage: 258 (16 second mortgage, 16 both second mortgage and home equity loan) Houses without a mortgage: 17
Median monthly owner costs for units with a mortgage: $941 Median monthly owner costs for units without a mortgage: $475
Residents with income below the poverty level in 2022:
This zip code:
16.8%
Whole state:
11.0%
Residents with income below 50% of the poverty level in 2022:
This zip code:
9.7%
Whole state:
5.5%
Median number of rooms in houses and condos:
Here:
7.4
State:
6.8
Median number of rooms in apartments:
Here:
4.0
State:
4.2
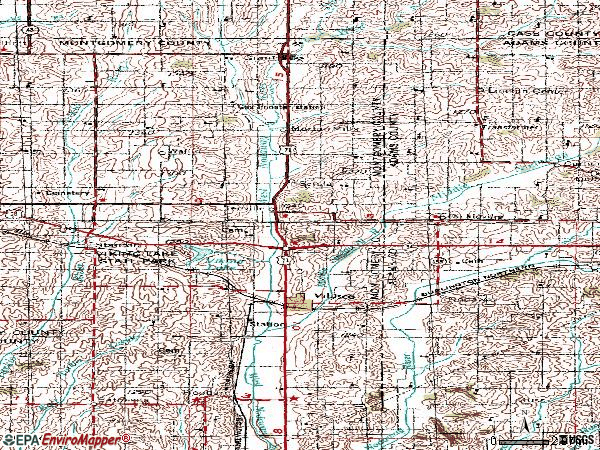
Notable locations in this zip code not listed on our city pages
Notable locations in zip code 50864: Tenville Access (A), Villisca Country Club (B), Villisca (C), Villisca Elevator Incorporated Elevator (D), Olson/Linn Museum (E), Axe Murder House (F), Villisca Public Library (G), Villisca City Hall (H), Villisca Ambulance Service (I), Villisca Fire Department (J). Display/hide their locations on the map
Churches in zip code 50864 include: Maple Grove Church (A), Advent Christian Church (B), Mount Calvary Lutheran Church (C), Presbyterian Church (D), Saint Josephs Catholic Church (E), United Methodist Church (F). Display/hide their locations on the map
Cemeteries: North Page Cemetery (1), Sciola Baptist Cemetery (2), Rosehill Cemetery (3), Bakers Cut Cemetery (4), Douglas Township Cemetery (5), Bolt Family Burying Ground (6), Indian Burial Ground (7). Display/hide their locations on the map
Streams, rivers, and creeks: Dunns Creek (A), Wolf Run (B), Williams Creek (C), Middle Nodaway River (D), Longs Branch (E), Long Branch (F), Fultons Creek (G), Threemile Creek (H). Display/hide their locations on the map
In group quarters: 39 (-1 institutionalized population)
Size of family households: 283 2-persons, 92 3-persons, 38 4-persons, 20 5-persons, 31 6-persons, 4 7-or-more-persons
Size of nonfamily households: 302 1-person, 37 2-persons
201 married couples with children.
130 single-parent households (21 men, 109 women).
97.6% of residents of 50864 zip code speak English at home.
0.5% of residents speak Spanish at home (100% very well).
1.4% of residents speak other Indo-European language at home (17% very well, 83% not well).
0.6% of residents speak other language at home (60% very well, 40% well).
Foreign born population: 6 (0.4%) (0.0% of them are naturalized citizens)
:
0.4%
Whole state:
6.0%
100%Egypt
22%German
14%English
12%Irish
11%American
9%Swedish
4%Scotch-Irish
2%Norwegian
Year of entry for the foreign-born population
72010 or later
02000 to 2009
01990 to 1999
5Before 1990
Facilities with environmental interests located in this zip code:
SYLVIA ENARSON ELEMENTARY SCHOOL (219 CENTRAL AVENUE in VILLISCA, IA)
(Geographic Names Information System) (National Center for Education Statistics) - STATE ID-696651 409 Organizations: VILLISCA COMM SCHOOL DISTRICT (SCHOOL DISTRICT)
ALUMINUM FOUNDRY CORPORATION (408 DEPOT STREET in VILLISCA, IA)
AIR MINOR (AIRS/AFS) Business SIC classification: PRIMARY PRODUCTION OF ALUMINUM; HARDWARE
TERRA INTERNATIONAL INC (8TH ST & 2ND AVE in VILLISCA, IA)
AIR MINOR (AIRS/AFS) Business SIC classification: NITROGENOUS FERTILIZERS
HOYE FEED & GRAIN (64208 YORK ROAD in VILLISCA, IA)
COMPLIANCE ACTIVITY (Tracking inspections of insecticide, fungicide, and rodenticide, and toxic substances) Alternative names: HFG INC
UNITED FARMERS COOP (RR 1 BOX 10 in VILLISCA, IA)
COMPLIANCE ACTIVITY (Tracking inspections of insecticide, fungicide, and rodenticide, and toxic substances)
UNITED FARMERS MERCANTILE COMPANY, VILLISCA (401 NORTH U AVENUE in VILLISCA, IA)
COMPLIANCE ACTIVITY (Tracking inspections of insecticide, fungicide, and rodenticide, and toxic substances) Alternative names: UNITED FARMERS MERCHANTILE COOP
UNITED FARMERS MERCANTILE COOP (401 NORTH AVE in VILLISCA, IA)
COMPLIANCE ACTIVITY (Tracking inspections of insecticide, fungicide, and rodenticide, and toxic substances)
Housing units lacking complete plumbing facilities: 2.4% Housing units lacking complete kitchen facilities: 1.2%
50.2%Utility gas
25.7%Bottled, tank, or LP gas
22.3%Electricity
1.2%Wood
0.9%Other fuel
Population in 1990: 1,794. Population change in the 1990s: +494 (+27.5%).
Place of birth for U.S.-born residents:
This state: 1,225
Northeast: 13
Midwest: 359
South: 69
West: 64
67% of the 50864 zip code residents lived in the same house 5 years ago. Out of people who lived in different houses, 56% lived in this county. Out of people who lived in different counties, 50% lived in Iowa.
79% of the 50864 zip code residents lived in the same house 1 year ago. Out of people who lived in different houses, 50% moved from this county. Out of people who lived in different houses, 22% moved from different county within same state. Out of people who lived in different houses, 17% moved from different state. Out of people who lived in different houses, 7% moved from abroad.
Private vs. public school enrollment:
Students in private schools in grades 1 to 8 (elementary and middle school):
Here:
0.0%
Iowa:
10.6%
Students in private schools in grades 9 to 12 (high school):
Here:
0.0%
Iowa:
7.9%
Students in private undergraduate colleges: 2
Here:
11.4%
Iowa:
23.9%
Occupation by median earnings in the past 12 months ($)
95,165Law enforcement workers including supervisors
67,693Health diagnosing and treating practitioners and other technical occupations
60,049Transportation occupations
56,011Sales and related occupations
53,102Community and social service occupations
52,798Business and financial operations occupations
Top industries in this zip code by the number of employees in 2005:
Health Care and Social Assistance: Nursing Care Facilities (50-99 employees: 1 establishment)
Wholesale Trade: Grain and Field Bean Merchant Wholesalers (10-19: 2, 5-9: 1)
Health Care and Social Assistance: Offices of Physicians (except Mental Health Specialists) (5-9: 1)
Professional, Scientific, and Technical Services: Offices of Certified Public Accountants (5-9: 1)
Administrative and Support and Waste Management and Remediation Services: Solid Waste Collection (5-9: 1)
People in group quarters in 2010:
36 people in nursing facilities/skilled-nursing facilities
People in group quarters in 2000:
58 people in nursing homes
2002 - 2018 National Fire Incident Reporting System (NFIRS) incidents
Based on the data from the years 2002 - 2018 the average number of fires per year is 12. The highest number of reported fires - 25 took place in 2014, and the least - 1 in 2002. The data has a growing trend.
When looking into fire subcategories, the most reports belonged to: Outside Fires (52.8%), and Structure Fires (22.3%).
Fire incident types reported to NFIRS in Zip Code 50864


+$3,125
-$74
(% of AGI for various income ranges: -8.0% for AGIs below $10k, 1.4% for AGIs $10k-25k, 2.6% for AGIs $25k-50k, 1.9% for AGIs $50k-75k, 0.3% for AGIs $75k-100k) Nearest zip codes: 50857, 51573, 50847, 50839, 51532, 50841.


 Based on the data from the years 2002 - 2018 the average number of fires per year is 12. The highest number of reported fires - 25 took place in 2014, and the least - 1 in 2002. The data has a growing trend.
 When looking into fire subcategories, the most reports belonged to: Outside Fires (52.8%), and Structure Fires (22.3%).