Estimated zip code population in 2022: 1,348 Zip code population in 2010: 1,602 Zip code population in 2000: 1,721
Houses and condos: 690 Renter-occupied apartments: 92
% of renters here:
15%
State:
28%
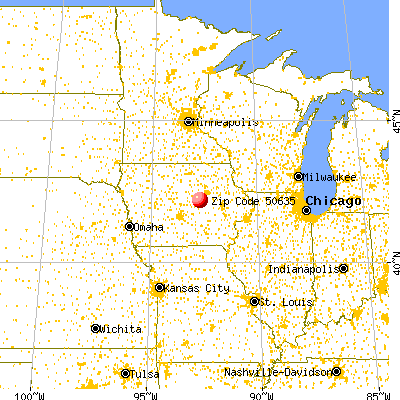
March 2022 cost of living index in zip code 50635: 82.4 (low, U.S. average is 100)
Land area: 84.0 sq. mi. Water area: 0.0 sq. mi.
Population density: 16 people per square mile
(very low).
OSM Map
General Map
Google Map
MSN Map
OSM Map
General Map
Google Map
MSN Map
OSM Map
General Map
Google Map
MSN Map
OSM Map
General Map
Google Map
MSN Map
Please wait while loading the map...
Real estate property taxes paid for housing units in 2022:
This zip code:
1.1% ($1,694)
Iowa:
1.4% ($2,724)
Median real estate property taxes paid for housing units with mortgages in 2022: $1,815 (1.2%) Median real estate property taxes paid for housing units with no mortgage in 2022: $1,578 (1.1%)
Business Search- 14 Million verified businesses
Males: 697
(51.7%)
Females: 651
(48.3%)
For population 25 years and over in 50635:
High school or higher: 95.1%
Bachelor's degree or higher: 25.5%
Graduate or professional degree: 6.3%
Unemployed: 1.5%
Mean travel time to work (commute): 22.9 minutes
For population 15 years and over in 50635:
Never married: 17.1%
Now married: 61.2%
Separated: 1.0%
Widowed: 9.6%
Divorced: 11.1%
Zip code 50635 compared to state average:
Unemployed percentage below state average.
Black race population percentage significantly below state average.
Hispanic race population percentage significantly below state average.
Median age significantly above state average.
Foreign-born population percentage significantly below state average.
Renting percentage below state average.
Length of stay since moving in significantly above state average.
Estimated median house/condo value in 2022: $147,879
50635:
$147,879
Iowa:
$194,600
According to our research of Iowa and other state lists, there was 1 registered sex offender living in 50635 zip code as of July 05, 2024. The ratio of all residents to sex offenders in zip code 50635 is 1,730 to 1. The ratio of registered sex offenders to all residents in this zip code is much lower than the state average.
Median resident age:
This zip code:
50.0 years
Iowa median age:
38.9 years
Average household size:
This zip code:
2.1 people
Iowa:
2.3 people
Averages for the 2020 tax year for zip code 50635, filed in 2021:
Average Adjusted Gross Income (AGI) in 2020: $61,986 (Individual Income Tax Returns)
Here:
$61,986
State:
$71,087
Salary/wage: $51,881 (reported on 76.1% of returns)
Here:
$51,881
State:
$57,361
(% of AGI for various income ranges: 1370.0% for AGIs below $25k, 3939.0% for AGIs $25k-50k, 7074.3% for AGIs $50k-75k, 10388.3% for AGIs $75k-100k, 18975.0% for AGIs $100k-200k)
Taxable interest for individuals: $1,381 (reported on 36.6% of returns)
This zip code:
$1,381
Iowa:
$1,633
(% of AGI for various income ranges: 56.4% for AGIs below $25k, 48.0% for AGIs $25k-50k, 78.6% for AGIs $50k-75k, 135.0% for AGIs $75k-100k, 188.3% for AGIs $100k-200k)
Ordinary dividends: $3,512 (reported on 23.9% of returns)
Here:
$3,512
State:
$5,432
(% of AGI for various income ranges: 110.0% for AGIs $25k-50k, 130.0% for AGIs $50k-75k, 93.3% for AGIs $75k-100k, 566.7% for AGIs $100k-200k)
Net capital gain/loss in AGI: +$3,731 (reported on 22.5% of returns)
Here:
+$3,731
State:
+$15,243
(% of AGI for various income ranges: 3.6% for AGIs below $25k, 87.0% for AGIs $25k-50k, 82.9% for AGIs $50k-75k, 48.3% for AGIs $75k-100k, 698.3% for AGIs $100k-200k)
Profit/loss from business: +$3,312 (reported on 11.3% of returns)
Here:
+$3,312
State:
+$11,763
(% of AGI for various income ranges: 110.0% for AGIs below $25k, 90.0% for AGIs $50k-75k, 135.0% for AGIs $100k-200k)
Taxable individual retirement arrangement distribution: $10,064 (reported on 15.5% of returns)
50635:
$10,064
Iowa:
$17,324
(% of AGI for various income ranges: 228.2% for AGIs below $25k, 501.4% for AGIs $50k-75k, 841.7% for AGIs $100k-200k)
Total itemized deductions: $26,667 (reported on 4.2% of returns)
Here:
$26,667
State:
$33,775
(% of AGI for various income ranges: 800.0% for AGIs $25k-50k)
Taxes paid: $4,350 (reported on 2.8% of returns)
50635:
$4,350
State:
$7,704
(% of AGI for various income ranges: 87.0% for AGIs $25k-50k)
Earned income credit: $2,100 (reported on 9.9% of returns)
Here:
$2,100
State:
$2,195
(% of AGI for various income ranges: 80.0% for AGIs below $25k, 59.0% for AGIs $25k-50k)
Percentage of individuals using paid preparers for their 2020 taxes: 93.0%
Here:
93%
State:
95%
(% for various income ranges: 88.9% for AGIs below $25k, 93.8% for AGIs $25k-50k, 92.3% for AGIs $50k-75k, 100.0% for AGIs $75k-100k, 92.9% for AGIs $100k-200k)
Averages for the 2012 tax year for zip code 50635, filed in 2013:
Average Adjusted Gross Income (AGI) in 2012: $60,340 (Individual Income Tax Returns)
Here:
$60,340
State:
$58,860
Salary/wage: $43,436 (reported on 80.8% of returns)
Here:
$43,436
State:
$46,659
(% of AGI for various income ranges: 72.8% for AGIs below $25k, 69.4% for AGIs $25k-50k, 65.1% for AGIs $50k-75k, 67.9% for AGIs $75k-100k, 76.0% for AGIs $100k-200k)
Taxable interest for individuals: $1,681 (reported on 42.5% of returns)
This zip code:
$1,681
Iowa:
$1,537
(% of AGI for various income ranges: 2.8% for AGIs below $25k, 2.4% for AGIs $25k-50k, 1.1% for AGIs $50k-75k, 1.1% for AGIs $75k-100k, 0.6% for AGIs $100k-200k, 0.3% for AGIs over 200k)
Ordinary dividends: $2,519 (reported on 28.8% of returns)
Here:
$2,519
State:
$4,542
(% of AGI for various income ranges: 1.0% for AGIs below $25k, 1.6% for AGIs $25k-50k, 1.5% for AGIs $50k-75k, 1.8% for AGIs $75k-100k, 1.2% for AGIs $100k-200k)
Net capital gain/loss in AGI: +$3,114 (reported on 19.2% of returns)
Here:
+$3,114
State:
+$11,802
(% of AGI for various income ranges: 0.2% for AGIs $50k-75k, 0.4% for AGIs $75k-100k, 3.8% for AGIs $100k-200k)
Profit/loss from business: +$8,640 (reported on 13.7% of returns)
Here:
+$8,640
State:
+$10,509
(% of AGI for various income ranges: 3.4% for AGIs below $25k, 4.8% for AGIs $25k-50k, 5.3% for AGIs $75k-100k)
Taxable individual retirement arrangement distribution: $7,467 (reported on 12.3% of returns)
50635:
$7,467
Iowa:
$11,773
Total itemized deductions: $20,705 (20% of AGI, reported on 27.4% of returns)
Here:
$20,705
State:
$21,278
Here:
19.7% of AGI
State:
18.9% of AGI
(% of AGI for various income ranges: 15.9% for AGIs $25k-50k, 8.3% for AGIs $50k-75k, 9.9% for AGIs $75k-100k, 8.8% for AGIs $100k-200k, 8.1% for AGIs over 200k)
Charity contributions: $3,194 (reported on 21.9% of returns)
Here:
$3,194
State:
$4,044
(% of AGI for various income ranges: 1.2% for AGIs $25k-50k, 0.8% for AGIs $50k-75k, 1.2% for AGIs $75k-100k, 2.5% for AGIs $100k-200k)
Taxes paid: $7,350 (reported on 27.4% of returns)
50635:
$7,350
State:
$8,846
(% of AGI for various income ranges: 1.8% for AGIs $25k-50k, 2.3% for AGIs $50k-75k, 2.7% for AGIs $75k-100k, 4.2% for AGIs $100k-200k, 6.4% for AGIs over 200k)
Earned income credit: $2,178 (reported on 12.3% of returns)
Here:
$2,178
State:
$2,098
(% of AGI for various income ranges: 4.4% for AGIs below $25k, 1.0% for AGIs $25k-50k)
Percentage of individuals using paid preparers for their 2012 taxes: 76.7%
Here:
77%
State:
65%
(% for various income ranges: 68.2% for AGIs below $25k, 73.7% for AGIs $25k-50k, 76.9% for AGIs $50k-75k, 88.9% for AGIs $75k-100k, 87.5% for AGIs $100k-200k, 100.0% for AGIs over 200k)
Averages for the 2004 tax year for zip code 50635, filed in 2005:
Average Adjusted Gross Income (AGI) in 2004: $37,027 (Individual Income Tax Returns)
Here:
$37,027
State:
$43,875
Salary/wage: $34,602 (reported on 81.9% of returns)
Here:
$34,602
State:
$38,265
(% of AGI for various income ranges: 140.8% for AGIs below $10k, 60.2% for AGIs $10k-25k, 78.0% for AGIs $25k-50k, 73.1% for AGIs $50k-75k, 84.7% for AGIs $75k-100k, 67.9% for AGIs over 100k)
Taxable interest for individuals: $1,886 (reported on 55.5% of returns)
This zip code:
$1,886
Iowa:
$1,768
(% of AGI for various income ranges: 14.4% for AGIs below $10k, 7.6% for AGIs $10k-25k, 2.7% for AGIs $25k-50k, 2.2% for AGIs $50k-75k, 1.1% for AGIs $75k-100k, 2.6% for AGIs over 100k)
Taxable dividends: $1,377 (reported on 33.0% of returns)
Here:
$1,377
State:
$2,510
(% of AGI for various income ranges: 8.5% for AGIs below $10k, 2.3% for AGIs $10k-25k, 1.4% for AGIs $25k-50k, 1.0% for AGIs $50k-75k, 0.8% for AGIs $75k-100k)
Net capital gain/loss: +$1,489 (reported on 24.1% of returns)
Here:
+$1,489
State:
+$6,139
(% of AGI for various income ranges: 2.3% for AGIs below $10k, 1.4% for AGIs $10k-25k, 1.0% for AGIs $25k-50k, 1.8% for AGIs $50k-75k, -0.3% for AGIs $75k-100k)
Profit/loss from business: +$3,991 (reported on 15.5% of returns)
Here:
+$3,991
State:
+$8,574
(% of AGI for various income ranges: 7.3% for AGIs below $10k, -0.0% for AGIs $10k-25k, 2.1% for AGIs $25k-50k, 3.2% for AGIs $50k-75k, -0.1% for AGIs $75k-100k)
Profit/loss from farming: +$7,887 (reported on 13.1% of returns)
Here:
+$7,887
State:
-$74
(% of AGI for various income ranges: 8.5% for AGIs $10k-25k, 1.7% for AGIs $25k-50k, 3.9% for AGIs $50k-75k, 1.1% for AGIs $75k-100k)
IRA payment deduction: $2,920 (reported on 3.4% of returns)
50635:
$2,920
Iowa:
$2,970
Total itemized deductions: $12,890 (24% of AGI, reported on 23.4% of returns)
Here:
$12,890
State:
$16,976
Here:
24.1% of AGI
State:
20.8% of AGI
(% of AGI for various income ranges: 16.1% for AGIs $10k-25k, 6.6% for AGIs $25k-50k, 6.7% for AGIs $50k-75k, 11.2% for AGIs $75k-100k)
Charity contributions deductions: $2,115 (4% of AGI, reported on 18.8% of returns)
Here:
$2,115
State:
$3,089
Here:
3.8% of AGI
State:
3.6% of AGI
(% of AGI for various income ranges: 2.1% for AGIs $10k-25k, 0.7% for AGIs $25k-50k, 1.0% for AGIs $50k-75k, 1.6% for AGIs $75k-100k)
Total tax: $3,857 (reported on 80.4% of returns)
50635:
$3,857
State:
$6,177
(% of AGI for various income ranges: 8.5% for AGIs below $10k, 4.6% for AGIs $10k-25k, 6.7% for AGIs $25k-50k, 8.8% for AGIs $50k-75k, 10.3% for AGIs $75k-100k, 14.4% for AGIs over 100k)
Earned income credit: $1,547 (reported on 10.1% of returns)
Here:
$1,547
State:
$1,540
Percentage of individuals using paid preparers for their 2004 taxes: 79.2%
Here:
79%
State:
70%
(% for various income ranges: 67.2% for AGIs below $10k, 77.1% for AGIs $10k-25k, 84.2% for AGIs $25k-50k, 81.2% for AGIs $50k-75k, 84.9% for AGIs $75k-100k, 76.9% for AGIs over 100k)
Likely homosexual households (counted as self-reported same-sex unmarried-partner households)
Lesbian couples: 0.0% of all households
Gay men: 0.7% of all households
Household received Food Stamps/SNAP in the past 12 months: 38 Household did not receive Food Stamps/SNAP in the past 12 months: 575
Women who had a birth in the past 12 months: 17 (17 now married, 0 unmarried) Women who did not have a birth in the past 12 months: 206 (130 now married, 75 unmarried)
Housing units in zip code 50635 with a mortgage: 316 (40 second mortgage, 42 both second mortgage and home equity loan) Houses without a mortgage: 29
Median monthly owner costs for units with a mortgage: $1,210 Median monthly owner costs for units without a mortgage: $611
Residents with income below the poverty level in 2022:
This zip code:
12.4%
Whole state:
11.0%
Residents with income below 50% of the poverty level in 2022:
This zip code:
6.3%
Whole state:
5.5%
Median number of rooms in houses and condos:
Here:
6.9
State:
6.8
Median number of rooms in apartments:
Here:
3.7
State:
4.2
Notable locations in this zip code not listed on our city pages
Notable locations in zip code 50635: Central Counties Co-op Elevator (A), Gladbrook Co-op Company Elevator (B), Tama County Fairgrounds (C), Gladbrook Lincoln Ambulance (D), Gladbrook City Hall (E), Gladbrook Public Library (F), Lincoln City Hall (G). Display/hide their locations on the map
Churches in zip code 50635 include: Salem Church of Lincoln (A), Peace United Church of Christ (B), Gladbrook Church of God (C), United Methodist Church (D), Christ Lutheran Church (E). Display/hide their locations on the map
Cemeteries: Badger Hill Cemetery (1), Gethman Cemetery (2), Union Grove Cemetery (3), Lincoln Township Cemetery (4), Maple Hill Cemetery (5). Display/hide their locations on the map
Parks in zip code 50635 include: Conants Park (1), Union Grove State Park (2), Site of Former Union Grove Historical Marker (3), Site of Former Badger Hill Historical Marker (4). Display/hide their locations on the map
In group quarters: 51 (-1 institutionalized population)
Size of family households: 224 2-persons, 99 3-persons, 54 4-persons, 19 5-persons, 2 6-persons
Size of nonfamily households: 190 1-person, 21 2-persons
187 married couples with children.
59 single-parent households (40 men, 19 women).
99.3% of residents of 50635 zip code speak English at home.
0.2% of residents speak other Indo-European language at home (100% very well).
0.9% of residents speak other language at home (100% very well).
Foreign born population: 7 (0.5%) (0.0% of them are naturalized citizens)
:
0.5%
Whole state:
6.0%
100%Bhutan
61%German
7%Italian
4%English
4%American
3%Norwegian
2%Irish
2%Czech
Year of entry for the foreign-born population
82010 or later
02000 to 2009
01990 to 1999
0Before 1990
Facilities with environmental interests located in this zip code:
SCHADE LIME & ROCK INC (315 SECOND ST in GLADBROOK, IA)
(Resource Conservation and Recovery Act (tracking hazardous waste))
TABOR & CO (201 FRONT ST in GLADBROOK, IA)
(Resource Conservation and Recovery Act (tracking hazardous waste)) Business NAICS classification: FERTILIZER (MIXING ONLY) MANUFACTURING.
AIR MINOR (AIRS/AFS) Business SIC classification: NONCLASSIFIABLE ESTABLISHMENTS Alternative names: PIPPERT GRAIN MILLNG
Housing units lacking complete plumbing facilities: 5.9% Housing units lacking complete kitchen facilities: 5.8%
60.3%Utility gas
24.7%Bottled, tank, or LP gas
12.0%Electricity
3.4%Other fuel
Population in 1990: 1,268. Population change in the 1990s: +453 (+35.7%).
Place of birth for U.S.-born residents:
This state: 1,160
Northeast: 19
Midwest: 111
South: 23
West: 26
66% of the 50635 zip code residents lived in the same house 5 years ago. Out of people who lived in different houses, 47% lived in this county. Out of people who lived in different counties, 50% lived in Iowa.
93% of the 50635 zip code residents lived in the same house 1 year ago. Out of people who lived in different houses, 20% moved from this county. Out of people who lived in different houses, 69% moved from different county within same state. Out of people who lived in different houses, 13% moved from different state.
Private vs. public school enrollment:
Students in private schools in grades 1 to 8 (elementary and middle school): 2
Here:
2.5%
Iowa:
10.6%
Students in private schools in grades 9 to 12 (high school): 4
Here:
7.8%
Iowa:
7.9%
Students in private undergraduate colleges: 5
Here:
37.7%
Iowa:
23.9%
Occupation by median earnings in the past 12 months ($)
65,604Installation, maintenance, and repair occupations
58,020Transportation occupations
54,655Business and financial operations occupations
54,625Farming, fishing, and forestry occupations
49,776Production occupations
49,291Material moving occupations
Top industries in this zip code by the number of employees in 2005:
Construction: Industrial Building Construction (50-99 employees: 1 establishment)
Wholesale Trade: Farm and Garden Machinery and Equipment Merchant Wholesalers (20-49: 1)
Construction: Water and Sewer Line and Related Structures Construction (10-19: 1)
Accommodation and Food Services: Full-Service Restaurants (5-9: 1, 1-4: 1)
People in group quarters in 2010:
48 people in nursing facilities/skilled-nursing facilities
People in group quarters in 2000:
57 people in nursing homes
2002 - 2018 National Fire Incident Reporting System (NFIRS) incidents
Based on the data from the years 2002 - 2018 the average number of fire incidents per year is 7. The highest number of reported fire incidents - 17 took place in 2003, and the least - 0 in 2007. The data has a decreasing trend.
When looking into fire subcategories, the most incidents belonged to: Outside Fires (47.5%), and Structure Fires (39.2%).
Fire incident types reported to NFIRS in Zip Code 50635


+$7,887
-$74
(% of AGI for various income ranges: 8.5% for AGIs $10k-25k, 1.7% for AGIs $25k-50k, 3.9% for AGIs $50k-75k, 1.1% for AGIs $75k-100k) Nearest zip codes: 50652, 50609, 50632, 50669, 50638, 50675.


 Based on the data from the years 2002 - 2018 the average number of fire incidents per year is 7. The highest number of reported fire incidents - 17 took place in 2003, and the least - 0 in 2007. The data has a decreasing trend.
 When looking into fire subcategories, the most incidents belonged to: Outside Fires (47.5%), and Structure Fires (39.2%).