Estimated zip code population in 2022: 1,774 Zip code population in 2010: 1,550 Zip code population in 2000: 1,662
Houses and condos: 821 Renter-occupied apartments: 117
% of renters here:
14%
State:
28%
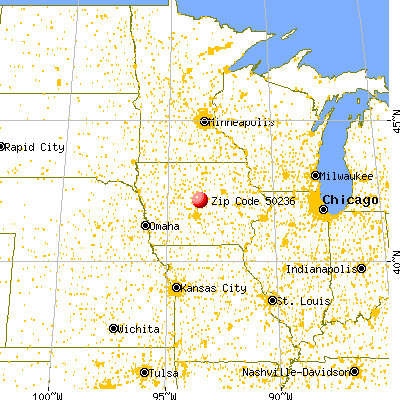
March 2022 cost of living index in zip code 50236: 83.5 (less than average, U.S. average is 100)
Land area: 34.5 sq. mi. Water area: 0.0 sq. mi.
Population density: 51 people per square mile
(very low).
OSM Map
General Map
Google Map
MSN Map
OSM Map
General Map
Google Map
MSN Map
OSM Map
General Map
Google Map
MSN Map
OSM Map
General Map
Google Map
MSN Map
Please wait while loading the map...
Real estate property taxes paid for housing units in 2022:
This zip code:
1.3% ($2,381)
Iowa:
1.4% ($2,724)
Median real estate property taxes paid for housing units with mortgages in 2022: $2,075 (1.2%) Median real estate property taxes paid for housing units with no mortgage in 2022: $2,750 (1.2%)
Business Search- 14 Million verified businesses
Males: 890
(50.2%)
Females: 884
(49.8%)
For population 25 years and over in 50236:
High school or higher: 98.5%
Bachelor's degree or higher: 33.7%
Graduate or professional degree: 8.1%
Unemployed: 0.3%
Mean travel time to work (commute): 24.3 minutes
For population 15 years and over in 50236:
Never married: 21.9%
Now married: 65.5%
Separated: 1.3%
Widowed: 3.6%
Divorced: 7.7%
Zip code 50236 compared to state average:
Unemployed percentage significantly below state average.
Black race population percentage significantly below state average.
Hispanic race population percentage significantly below state average.
Median age above state average.
Foreign-born population percentage significantly below state average.
Renting percentage below state average.
Length of stay since moving in significantly above state average.
Number of college students significantly below state average.
Estimated median house/condo value in 2022: $188,921
50236:
$188,921
Iowa:
$194,600
According to our research of Iowa and other state lists, there was 1 registered sex offender living in 50236 zip code as of July 05, 2024. The ratio of all residents to sex offenders in zip code 50236 is 1,629 to 1. The ratio of registered sex offenders to all residents in this zip code is much lower than the state average.
Median resident age:
This zip code:
45.3 years
Iowa median age:
38.9 years
Average household size:
This zip code:
2.2 people
Iowa:
2.3 people
Averages for the 2020 tax year for zip code 50236, filed in 2021:
Average Adjusted Gross Income (AGI) in 2020: $71,514 (Individual Income Tax Returns)
Here:
$71,514
State:
$71,087
Salary/wage: $63,442 (reported on 86.8% of returns)
Here:
$63,442
State:
$57,361
(% of AGI for various income ranges: 1251.8% for AGIs below $25k, 3298.3% for AGIs $25k-50k, 7528.7% for AGIs $50k-75k, 9202.2% for AGIs $75k-100k, 17877.0% for AGIs $100k-200k)
Taxable interest for individuals: $578 (reported on 35.5% of returns)
This zip code:
$578
Iowa:
$1,633
(% of AGI for various income ranges: 19.1% for AGIs below $25k, 8.3% for AGIs $25k-50k, 21.2% for AGIs $50k-75k, 32.2% for AGIs $75k-100k, 56.0% for AGIs $100k-200k)
Ordinary dividends: $1,835 (reported on 22.4% of returns)
Here:
$1,835
State:
$5,432
(% of AGI for various income ranges: 8.2% for AGIs below $25k, 30.0% for AGIs $25k-50k, 75.6% for AGIs $75k-100k, 199.0% for AGIs $100k-200k)
Net capital gain/loss in AGI: +$3,380 (reported on 19.7% of returns)
Here:
+$3,380
State:
+$15,243
(% of AGI for various income ranges: 1.8% for AGIs below $25k, 15.0% for AGIs $25k-50k, 226.7% for AGIs $75k-100k, 283.0% for AGIs $100k-200k)
Profit/loss from business: +$7,367 (reported on 15.8% of returns)
Here:
+$7,367
State:
+$11,763
(% of AGI for various income ranges: 107.3% for AGIs below $25k, 160.8% for AGIs $25k-50k, 61.1% for AGIs $75k-100k, 518.0% for AGIs $100k-200k)
Taxable individual retirement arrangement distribution: $12,725 (reported on 10.5% of returns)
50236:
$12,725
Iowa:
$17,324
(% of AGI for various income ranges: 375.0% for AGIs $25k-50k, 568.0% for AGIs $100k-200k)
Total itemized deductions: $26,675 (reported on 5.3% of returns)
Here:
$26,675
State:
$33,775
(% of AGI for various income ranges: 1067.0% for AGIs $100k-200k)
Charity contributions: $10,050 (reported on 2.6% of returns)
Here:
$10,050
State:
$13,075
(% of AGI for various income ranges: 201.0% for AGIs $100k-200k)
Taxes paid: $7,833 (reported on 3.9% of returns)
50236:
$7,833
State:
$7,704
(% of AGI for various income ranges: 235.0% for AGIs $100k-200k)
Earned income credit: $2,417 (reported on 7.9% of returns)
Here:
$2,417
State:
$2,195
(% of AGI for various income ranges: 58.2% for AGIs below $25k, 67.5% for AGIs $25k-50k)
Percentage of individuals using paid preparers for their 2020 taxes: 94.7%
Here:
95%
State:
95%
(% for various income ranges: 94.4% for AGIs below $25k, 92.9% for AGIs $25k-50k, 91.7% for AGIs $50k-75k, 100.0% for AGIs $75k-100k, 94.1% for AGIs $100k-200k, 100.0% for AGIs over 200k)
Averages for the 2012 tax year for zip code 50236, filed in 2013:
Average Adjusted Gross Income (AGI) in 2012: $61,023 (Individual Income Tax Returns)
Here:
$61,023
State:
$58,860
Salary/wage: $54,444 (reported on 86.3% of returns)
Here:
$54,444
State:
$46,659
(% of AGI for various income ranges: 76.2% for AGIs below $25k, 79.3% for AGIs $25k-50k, 82.2% for AGIs $50k-75k, 87.8% for AGIs $75k-100k, 68.2% for AGIs $100k-200k)
Taxable interest for individuals: $497 (reported on 42.5% of returns)
This zip code:
$497
Iowa:
$1,537
(% of AGI for various income ranges: 0.7% for AGIs below $25k, 0.5% for AGIs $25k-50k, 0.4% for AGIs $50k-75k, 0.3% for AGIs $75k-100k, 0.3% for AGIs $100k-200k)
Ordinary dividends: $1,388 (reported on 21.9% of returns)
Here:
$1,388
State:
$4,542
(% of AGI for various income ranges: 1.0% for AGIs $25k-50k, 0.4% for AGIs $50k-75k, 0.3% for AGIs $75k-100k, 0.5% for AGIs $100k-200k)
Net capital gain/loss in AGI: +$9,091 (reported on 15.1% of returns)
Here:
+$9,091
State:
+$11,802
(% of AGI for various income ranges: 0.2% for AGIs $25k-50k, 5.7% for AGIs $75k-100k, 5.5% for AGIs $100k-200k)
Profit/loss from business: +$5,918 (reported on 15.1% of returns)
Here:
+$5,918
State:
+$10,509
(% of AGI for various income ranges: 6.4% for AGIs $25k-50k, 2.2% for AGIs $75k-100k)
Taxable individual retirement arrangement distribution: $7,557 (reported on 9.6% of returns)
50236:
$7,557
Iowa:
$11,773
Total itemized deductions: $17,343 (19% of AGI, reported on 38.4% of returns)
Here:
$17,343
State:
$21,278
Here:
18.6% of AGI
State:
18.9% of AGI
(% of AGI for various income ranges: 12.9% for AGIs $25k-50k, 9.4% for AGIs $50k-75k, 12.1% for AGIs $75k-100k, 11.6% for AGIs $100k-200k)
Charity contributions: $2,496 (reported on 31.5% of returns)
Here:
$2,496
State:
$4,044
(% of AGI for various income ranges: 1.2% for AGIs $25k-50k, 1.0% for AGIs $50k-75k, 1.7% for AGIs $75k-100k, 1.4% for AGIs $100k-200k)
Taxes paid: $7,414 (reported on 38.4% of returns)
50236:
$7,414
State:
$8,846
(% of AGI for various income ranges: 3.7% for AGIs $25k-50k, 3.4% for AGIs $50k-75k, 4.9% for AGIs $75k-100k, 6.1% for AGIs $100k-200k)
Earned income credit: $1,962 (reported on 11.0% of returns)
Here:
$1,962
State:
$2,098
(% of AGI for various income ranges: 4.2% for AGIs below $25k, 0.9% for AGIs $25k-50k)
Percentage of individuals using paid preparers for their 2012 taxes: 60.3%
Here:
60%
State:
65%
(% for various income ranges: 47.4% for AGIs below $25k, 61.1% for AGIs $25k-50k, 61.5% for AGIs $50k-75k, 63.6% for AGIs $75k-100k, 75.0% for AGIs $100k-200k)
Averages for the 2004 tax year for zip code 50236, filed in 2005:
Average Adjusted Gross Income (AGI) in 2004: $46,771 (Individual Income Tax Returns)
Here:
$46,771
State:
$43,875
Salary/wage: $44,239 (reported on 88.5% of returns)
Here:
$44,239
State:
$38,265
(% of AGI for various income ranges: 89.7% for AGIs below $10k, 71.4% for AGIs $10k-25k, 82.5% for AGIs $25k-50k, 89.3% for AGIs $50k-75k, 88.9% for AGIs $75k-100k, 74.6% for AGIs over 100k)
Taxable interest for individuals: $811 (reported on 57.8% of returns)
This zip code:
$811
Iowa:
$1,768
(% of AGI for various income ranges: 4.9% for AGIs below $10k, 1.8% for AGIs $10k-25k, 1.6% for AGIs $25k-50k, 0.7% for AGIs $50k-75k, 0.5% for AGIs $75k-100k, 0.8% for AGIs over 100k)
Taxable dividends: $786 (reported on 26.9% of returns)
Here:
$786
State:
$2,510
(% of AGI for various income ranges: 0.2% for AGIs below $10k, 0.5% for AGIs $10k-25k, 0.7% for AGIs $25k-50k, 0.2% for AGIs $50k-75k, 0.3% for AGIs $75k-100k, 0.7% for AGIs over 100k)
Net capital gain/loss: +$4,348 (reported on 18.5% of returns)
Here:
+$4,348
State:
+$6,139
(% of AGI for various income ranges: -0.1% for AGIs $10k-25k, 0.2% for AGIs $25k-50k, 0.0% for AGIs $50k-75k, 0.1% for AGIs $75k-100k, 8.2% for AGIs over 100k)
Profit/loss from business: +$1,631 (reported on 15.5% of returns)
Here:
+$1,631
State:
+$8,574
(% of AGI for various income ranges: 9.0% for AGIs below $10k, -1.0% for AGIs $25k-50k, 0.5% for AGIs $50k-75k, 1.9% for AGIs $75k-100k)
Total itemized deductions: $14,439 (21% of AGI, reported on 43.6% of returns)
Here:
$14,439
State:
$16,976
Here:
20.9% of AGI
State:
20.8% of AGI
(% of AGI for various income ranges: 14.2% for AGIs $10k-25k, 13.0% for AGIs $25k-50k, 14.4% for AGIs $50k-75k, 14.4% for AGIs $75k-100k, 12.5% for AGIs over 100k)
Charity contributions deductions: $1,996 (3% of AGI, reported on 37.5% of returns)
Here:
$1,996
State:
$3,089
Here:
2.8% of AGI
State:
3.6% of AGI
(% of AGI for various income ranges: 2.0% for AGIs $10k-25k, 1.5% for AGIs $25k-50k, 1.6% for AGIs $50k-75k, 1.6% for AGIs $75k-100k, 1.7% for AGIs over 100k)
Total tax: $5,123 (reported on 81.5% of returns)
50236:
$5,123
State:
$6,177
(% of AGI for various income ranges: 2.9% for AGIs below $10k, 4.5% for AGIs $10k-25k, 6.5% for AGIs $25k-50k, 7.2% for AGIs $50k-75k, 10.0% for AGIs $75k-100k, 14.7% for AGIs over 100k)
Earned income credit: $1,464 (reported on 7.8% of returns)
Here:
$1,464
State:
$1,540
Percentage of individuals using paid preparers for their 2004 taxes: 64.5%
Here:
64%
State:
70%
(% for various income ranges: 50.8% for AGIs below $10k, 67.5% for AGIs $10k-25k, 64.7% for AGIs $25k-50k, 69.2% for AGIs $50k-75k, 67.0% for AGIs $75k-100k, 70.8% for AGIs over 100k)
Likely homosexual households (counted as self-reported same-sex unmarried-partner households)
Lesbian couples: 0.2% of all households
Gay men: 0.0% of all households
Household received Food Stamps/SNAP in the past 12 months: 2 Household did not receive Food Stamps/SNAP in the past 12 months: 812
Women who had a birth in the past 12 months: 10 (10 now married, 0 unmarried) Women who did not have a birth in the past 12 months: 300 (199 now married, 99 unmarried)
Housing units in zip code 50236 with a mortgage: 453 (58 second mortgage, 56 both second mortgage and home equity loan) Houses without a mortgage: 17
Median monthly owner costs for units with a mortgage: $1,297 Median monthly owner costs for units without a mortgage: $630
Residents with income below the poverty level in 2022:
This zip code:
0.6%
Whole state:
11.0%
Residents with income below 50% of the poverty level in 2022:
This zip code:
0.6%
Whole state:
5.5%
Median number of rooms in houses and condos:
Here:
7.0
State:
6.8
Median number of rooms in apartments:
Here:
4.3
State:
4.2
Notable locations in this zip code not listed on our city pages
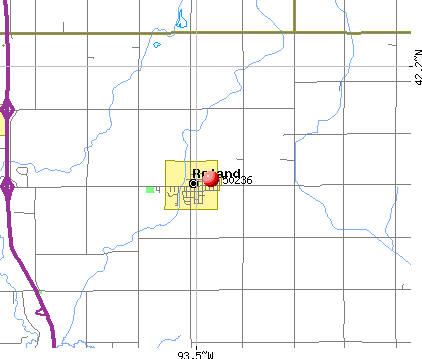
Notable locations in zip code 50236: Roland Response Team (A), Roland Fire Department (B), Roland City Hall (C), Roland Public Library (D). Display/hide their locations on the map
Churches in zip code 50236 include: Story City Evangelical Free Church (A), Bergen Lutheran Church (B), Salem Lutheran Church (C). Display/hide their locations on the map
Size of family households: 235 2-persons, 117 3-persons, 105 4-persons, 20 5-persons, 25 6-persons
Size of nonfamily households: 272 1-person, 27 2-persons
380 married couples with children.
39 single-parent households (29 men, 10 women).
99.2% of residents of 50236 zip code speak English at home.
0.4% of residents speak Spanish at home (100% very well).
Foreign born population: 7 (0.4%) (100.0% of them are naturalized citizens)
This zip code:
0.4%
Whole state:
6.0%
43%Japan
30%German
20%Norwegian
13%English
9%Swiss
3%American
3%Scandinavian
3%European
Year of entry for the foreign-born population
32010 or later
02000 to 2009
01990 to 1999
5Before 1990
Facilities with environmental interests located in this zip code:
ROLAND-STORY MIDDLE SCHOOL (206 S MAIN ST in ROLAND, IA)
(Geographic Names Information System) (National Center for Education Statistics) - STATE ID-855643 209 Organizations: ROLAND-STORY COMM SCHOOL DISTRICT (SCHOOL DISTRICT)
DESOTO INC-FORMER SITE OF (100 WALNUT ST in ROLAND, IA)
(Resource Conservation and Recovery Act (tracking hazardous waste)) Business NAICS classification: NONUPHOLSTERED WOOD HOUSEHOLD FURNITURE MANUFACTURING.
ROLAND CITY OF STP (599 S. COTTONWOOD in ROLAND, IA)
National Pollutant Discharge Elimination System NON-MAJOR (Tracking pollutant discharge elimination systems) - permit Business SIC classification: SEWERAGE SYSTEMS Organizations: CITY OF ROLAND (CONTACT/OWNER)
HEART OF IOWA COOP (229 EAST ASH STREET in ROLAND, IA)
AIR MINOR (AIRS/AFS) Business SIC classification: FARM PRODUCT WAREHOUSING AND STORAGE Alternative names: ROLAND FARMERS COOP.
ROLAND MUNIC ELEC LIGHT DEPT (202 E ASH in ROLAND, IA)
COMPLIANCE ACTIVITY (Tracking inspections of insecticide, fungicide, and rodenticide, and toxic substances) Business SIC classification: ELECTRIC SERVICES
Housing units lacking complete plumbing facilities: 0.7%
79.5%Utility gas
12.4%Bottled, tank, or LP gas
8.2%Electricity
Population in 1990: 1,452. Population change in the 1990s: +210 (+14.5%).
Place of birth for U.S.-born residents:
This state: 1,388
Northeast: 7
Midwest: 255
South: 75
West: 33
61% of the 50236 zip code residents lived in the same house 5 years ago. Out of people who lived in different houses, 48% lived in this county. Out of people who lived in different counties, 50% lived in Iowa.
94% of the 50236 zip code residents lived in the same house 1 year ago. Out of people who lived in different houses, 80% moved from this county. Out of people who lived in different houses, 12% moved from different county within same state. Out of people who lived in different houses, 6% moved from different state.
Private vs. public school enrollment:
Students in private schools in grades 1 to 8 (elementary and middle school):
Here:
0.0%
Iowa:
10.6%
Students in private schools in grades 9 to 12 (high school):
Here:
0.0%
Iowa:
7.9%
Students in private undergraduate colleges: 4
Here:
26.3%
Iowa:
23.9%
Occupation by median earnings in the past 12 months ($)
84,069Transportation occupations
75,914Management occupations
73,279Business and financial operations occupations
70,702Architecture and engineering occupations
67,896Installation, maintenance, and repair occupations
67,842Computer and mathematical occupations
Companies with federal contracts located in this zip code:
HEART OF IOWA COOPERATIVE (229 E ASH ST in ROLAND, IA) : $842 in 2 contractsfrom 2003 to 2004
$540 with Army for Fuels, Solid. Signed on 2004-03-31. Completion date: 2004-04-01.
$302, same as above.Signed on 2003-12-01. Completion date: 2003-11-20.
Top industries in this zip code by the number of employees in 2005:
Wholesale Trade: Grain and Field Bean Merchant Wholesalers (50-99 employees: 1 establishment)
Health Care and Social Assistance: Child and Youth Services (10-19: 1)
Other Services (except Public Administration): Religious Organizations (5-9: 2)
Construction: Roofing Contractors (5-9: 1)
Construction: New Single-Family Housing Construction (except Operative Builders) (5-9: 1)
Finance and Insurance: Commercial Banking (5-9: 1)
Home Mortgage Disclosure Act Aggregated Statistics For Year 2009 (Based on 2 partial tracts)
A) FHA, FSA/RHS & VA Home Purchase Loans
B) Conventional Home Purchase Loans
C) Refinancings
D) Home Improvement Loans
E) Loans on Dwellings For 5+ Families
F) Non-occupant Loans on < 5 Family Dwellings (A B C & D)
G) Loans On Manufactured Home Dwelling (A B C & D)
Number
Average Value
Number
Average Value
Number
Average Value
Number
Average Value
Number
Average Value
Number
Average Value
Number
Average Value
LOANS ORIGINATED
23
$139,555
32
$97,858
131
$133,832
18
$76,518
1
$296,350
4
$55,742
1
$1,410
APPLICATIONS APPROVED, NOT ACCEPTED
0
$0
1
$236,380
15
$146,059
0
$0
0
$0
1
$130,540
0
$0
APPLICATIONS DENIED
3
$99,723
2
$81,495
18
$150,489
1
$45,160
0
$0
1
$45,160
0
$0
APPLICATIONS WITHDRAWN
1
$183,460
4
$129,830
20
$138,792
1
$30,340
0
$0
0
$0
0
$0
FILES CLOSED FOR INCOMPLETENESS
1
$86,790
0
$0
2
$186,985
0
$0
0
$0
0
$0
0
$0
Aggregated Statistics For Year 2008 (Based on 2 partial tracts)
A) FHA, FSA/RHS & VA Home Purchase Loans
B) Conventional Home Purchase Loans
C) Refinancings
D) Home Improvement Loans
E) Loans on Dwellings For 5+ Families
F) Non-occupant Loans on < 5 Family Dwellings (A B C & D)
G) Loans On Manufactured Home Dwelling (A B C & D)
Number
Average Value
Number
Average Value
Number
Average Value
Number
Average Value
Number
Average Value
Number
Average Value
Number
Average Value
LOANS ORIGINATED
10
$117,341
33
$118,797
61
$96,424
18
$32,183
1
$479,100
11
$81,914
2
$64,560
APPLICATIONS APPROVED, NOT ACCEPTED
0
$0
4
$162,992
4
$124,362
1
$4,940
0
$0
0
$0
0
$0
APPLICATIONS DENIED
0
$0
7
$121,161
25
$121,730
4
$20,992
0
$0
1
$114,310
0
$0
APPLICATIONS WITHDRAWN
1
$139,000
3
$159,937
9
$124,342
4
$93,492
0
$0
0
$0
0
$0
FILES CLOSED FOR INCOMPLETENESS
0
$0
0
$0
3
$85,847
0
$0
0
$0
0
$0
0
$0
Aggregated Statistics For Year 2007 (Based on 2 partial tracts)
A) FHA, FSA/RHS & VA Home Purchase Loans
B) Conventional Home Purchase Loans
C) Refinancings
D) Home Improvement Loans
E) Loans on Dwellings For 5+ Families
F) Non-occupant Loans on < 5 Family Dwellings (A B C & D)
G) Loans On Manufactured Home Dwelling (A B C & D)
Number
Average Value
Number
Average Value
Number
Average Value
Number
Average Value
Number
Average Value
Number
Average Value
Number
Average Value
LOANS ORIGINATED
3
$111,957
61
$118,749
69
$101,412
24
$35,280
1
$194,040
9
$98,941
1
$57,150
APPLICATIONS APPROVED, NOT ACCEPTED
0
$0
5
$207,728
9
$115,876
1
$45,860
0
$0
0
$0
0
$0
APPLICATIONS DENIED
1
$134,770
7
$94,147
37
$148,214
8
$47,981
0
$0
1
$163,700
1
$52,210
APPLICATIONS WITHDRAWN
0
$0
6
$85,613
16
$121,848
4
$54,860
1
$115,010
1
$58,560
0
$0
FILES CLOSED FOR INCOMPLETENESS
0
$0
3
$90,553
1
$199,680
0
$0
0
$0
0
$0
0
$0
Aggregated Statistics For Year 2006 (Based on 2 partial tracts)
A) FHA, FSA/RHS & VA Home Purchase Loans
B) Conventional Home Purchase Loans
C) Refinancings
D) Home Improvement Loans
E) Loans on Dwellings For 5+ Families
F) Non-occupant Loans on < 5 Family Dwellings (A B C & D)
G) Loans On Manufactured Home Dwelling (A B C & D)
Number
Average Value
Number
Average Value
Number
Average Value
Number
Average Value
Number
Average Value
Number
Average Value
Number
Average Value
LOANS ORIGINATED
2
$130,185
71
$100,414
93
$90,522
23
$38,992
3
$217,323
8
$85,290
1
$7,760
APPLICATIONS APPROVED, NOT ACCEPTED
0
$0
2
$103,725
15
$104,711
1
$70,560
0
$0
0
$0
0
$0
APPLICATIONS DENIED
0
$0
5
$89,046
35
$117,775
7
$65,419
0
$0
1
$115,720
0
$0
APPLICATIONS WITHDRAWN
0
$0
10
$75,358
14
$109,217
1
$60,680
0
$0
0
$0
0
$0
FILES CLOSED FOR INCOMPLETENESS
0
$0
1
$175,690
9
$114,856
1
$12,000
0
$0
0
$0
0
$0
Aggregated Statistics For Year 2005 (Based on 2 partial tracts)
A) FHA, FSA/RHS & VA Home Purchase Loans
B) Conventional Home Purchase Loans
C) Refinancings
D) Home Improvement Loans
F) Non-occupant Loans on < 5 Family Dwellings (A B C & D)
G) Loans On Manufactured Home Dwelling (A B C & D)
Number
Average Value
Number
Average Value
Number
Average Value
Number
Average Value
Number
Average Value
Number
Average Value
LOANS ORIGINATED
6
$95,727
78
$99,580
92
$101,023
27
$26,917
14
$58,918
1
$11,290
APPLICATIONS APPROVED, NOT ACCEPTED
1
$89,610
6
$99,607
10
$90,528
2
$12,700
1
$45,160
0
$0
APPLICATIONS DENIED
1
$84,670
12
$110,368
30
$103,512
8
$23,196
2
$37,395
1
$37,400
APPLICATIONS WITHDRAWN
0
$0
4
$94,375
25
$103,272
0
$0
1
$40,920
0
$0
FILES CLOSED FOR INCOMPLETENESS
0
$0
4
$85,908
8
$122,951
0
$0
1
$76,200
0
$0
Aggregated Statistics For Year 2004 (Based on 2 partial tracts)
A) FHA, FSA/RHS & VA Home Purchase Loans
B) Conventional Home Purchase Loans
C) Refinancings
D) Home Improvement Loans
F) Non-occupant Loans on < 5 Family Dwellings (A B C & D)
G) Loans On Manufactured Home Dwelling (A B C & D)


 Nearest zip codes: 50154, 50102, 50248, 50231, 50230, 50201.