Estimated zip code population in 2022: 1,815 Zip code population in 2010: 1,897 Zip code population in 2000: 2,074
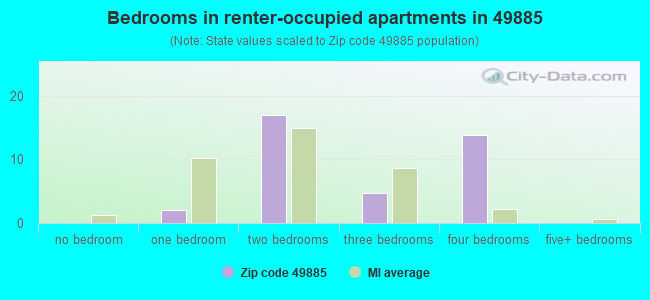
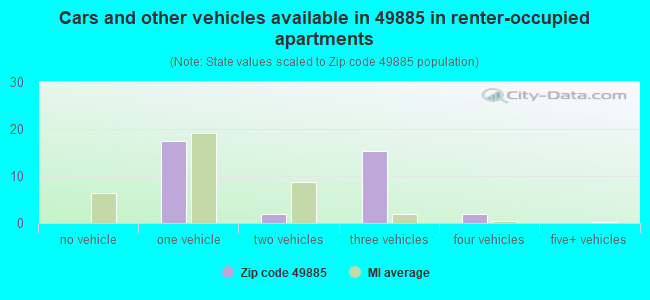
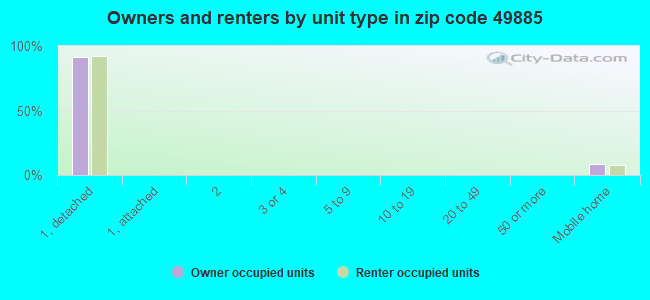
Houses and condos: 1,114 Renter-occupied apartments: 36
% of renters here:
5%
State:
27%
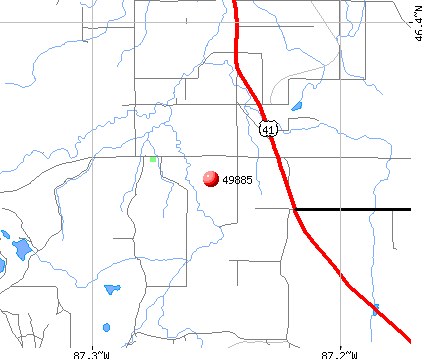
March 2022 cost of living index in zip code 49885: 83.6 (less than average, U.S. average is 100)
Land area: 147.3 sq. mi. Water area: 0.9 sq. mi.
Population density: 12 people per square mile
(very low).
OSM Map
General Map
Google Map
MSN Map
OSM Map
General Map
Google Map
MSN Map
OSM Map
General Map
Google Map
MSN Map
OSM Map
General Map
Google Map
MSN Map
Please wait while loading the map...
Real estate property taxes paid for housing units in 2022:
This zip code:
0.7% ($1,571)
Michigan:
1.2% ($2,746)
Median real estate property taxes paid for housing units with mortgages in 2022: $1,725 (0.7%) Median real estate property taxes paid for housing units with no mortgage in 2022: $1,384 (0.8%)
Business Search- 14 Million verified businesses
Males: 947
(52.2%)
Females: 868
(47.8%)
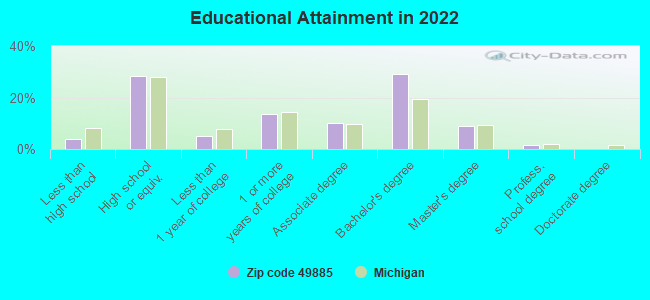
For population 25 years and over in 49885:
High school or higher: 96.1%
Bachelor's degree or higher: 39.5%
Graduate or professional degree: 10.6%
Unemployed: 4.0%
Mean travel time to work (commute): 24.9 minutes
For population 15 years and over in 49885:
Never married: 22.9%
Now married: 58.7%
Separated: 0.6%
Widowed: 6.2%
Divorced: 11.7%
Zip code 49885 compared to state average:
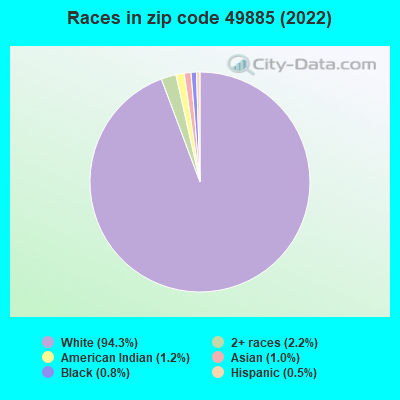
Black race population percentage significantly below state average.
Hispanic race population percentage significantly below state average.
Median age above state average.
Foreign-born population percentage significantly below state average.
Renting percentage significantly below state average.
Length of stay since moving in significantly above state average.
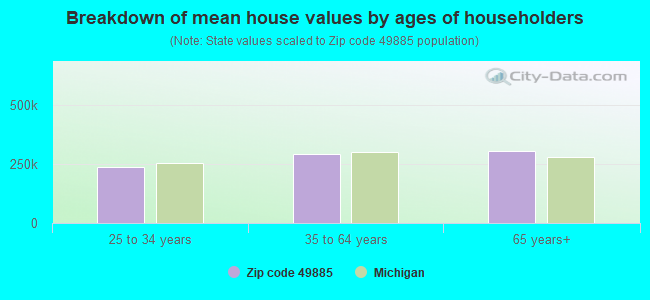
Estimated median house/condo value in 2022: $235,670
49885:
$235,670
Michigan:
$224,400
According to our research of Michigan and other state lists, there were 8 registered sex offenders living in 49885 zip code as of July 08, 2024. The ratio of all residents to sex offenders in zip code 49885 is 292 to 1. The ratio of registered sex offenders to all residents in this zip code is near the state average.
Median resident age:
This zip code:
46.6 years
Michigan median age:
40.3 years
Average household size:
This zip code:
2.4 people
Michigan:
2.4 people
Averages for the 2020 tax year for zip code 49885, filed in 2021:
Average Adjusted Gross Income (AGI) in 2020: $57,981 (Individual Income Tax Returns)
Here:
$57,981
State:
$68,945
Salary/wage: $49,293 (reported on 73.4% of returns)
Here:
$49,293
State:
$57,142
(% of AGI for various income ranges: 911.4% for AGIs below $25k, 2614.1% for AGIs $25k-50k, 5845.8% for AGIs $50k-75k, 8615.7% for AGIs $75k-100k, 14608.0% for AGIs $100k-200k)
Taxable interest for individuals: $339 (reported on 33.0% of returns)
This zip code:
$339
Michigan:
$1,630
(% of AGI for various income ranges: 7.1% for AGIs below $25k, 21.2% for AGIs $25k-50k, 14.2% for AGIs $50k-75k, 18.6% for AGIs $75k-100k, 24.0% for AGIs $100k-200k)
Ordinary dividends: $992 (reported on 12.8% of returns)
Here:
$992
State:
$6,972
(% of AGI for various income ranges: 4.3% for AGIs below $25k, 20.0% for AGIs $25k-50k, 27.1% for AGIs $75k-100k, 57.0% for AGIs $100k-200k)
Net capital gain/loss in AGI: +$7,267 (reported on 12.8% of returns)
Here:
+$7,267
State:
+$20,064
(% of AGI for various income ranges: 25.9% for AGIs $25k-50k, 143.3% for AGIs $50k-75k, 665.0% for AGIs $100k-200k)
Profit/loss from business: +$10,923 (reported on 13.8% of returns)
Here:
+$10,923
State:
+$11,172
(% of AGI for various income ranges: 59.0% for AGIs below $25k, 132.9% for AGIs $25k-50k, 352.5% for AGIs $50k-75k, 647.0% for AGIs $100k-200k)
Taxable individual retirement arrangement distribution: $17,042 (reported on 12.8% of returns)
49885:
$17,042
Michigan:
$19,803
(% of AGI for various income ranges: 78.6% for AGIs below $25k, 180.0% for AGIs $25k-50k, 486.7% for AGIs $50k-75k, 990.0% for AGIs $100k-200k)
Earned income credit: $1,682 (reported on 11.7% of returns)
Here:
$1,682
State:
$2,251
(% of AGI for various income ranges: 55.2% for AGIs below $25k, 40.6% for AGIs $25k-50k)
Percentage of individuals using paid preparers for their 2020 taxes: 94.7%
Here:
95%
State:
93%
(% for various income ranges: 93.1% for AGIs below $25k, 91.3% for AGIs $25k-50k, 100.0% for AGIs $50k-75k, 100.0% for AGIs $75k-100k, 93.8% for AGIs $100k-200k)
Averages for the 2012 tax year for zip code 49885, filed in 2013:
Average Adjusted Gross Income (AGI) in 2012: $46,464 (Individual Income Tax Returns)
Here:
$46,464
State:
$55,609
Salary/wage: $42,014 (reported on 78.9% of returns)
Here:
$42,014
State:
$46,782
(% of AGI for various income ranges: 64.4% for AGIs below $25k, 67.1% for AGIs $25k-50k, 73.4% for AGIs $50k-75k, 73.4% for AGIs $75k-100k, 73.6% for AGIs $100k-200k)
Taxable interest for individuals: $568 (reported on 37.8% of returns)
This zip code:
$568
Michigan:
$1,491
(% of AGI for various income ranges: 1.3% for AGIs below $25k, 0.6% for AGIs $25k-50k, 0.4% for AGIs $50k-75k, 0.5% for AGIs $75k-100k, 0.2% for AGIs $100k-200k)
Ordinary dividends: $900 (reported on 14.4% of returns)
Here:
$900
State:
$6,225
(% of AGI for various income ranges: 0.3% for AGIs below $25k, 0.2% for AGIs $25k-50k, 0.7% for AGIs $50k-75k, 0.1% for AGIs $100k-200k)
Net capital gain/loss in AGI: +$4,100 (reported on 14.4% of returns)
Here:
+$4,100
State:
+$9,326
(% of AGI for various income ranges: 1.1% for AGIs below $25k, 0.9% for AGIs $25k-50k, 1.7% for AGIs $50k-75k, 2.3% for AGIs $100k-200k)
Profit/loss from business: +$5,969 (reported on 14.4% of returns)
Here:
+$5,969
State:
+$11,523
(% of AGI for various income ranges: 7.0% for AGIs below $25k, 2.0% for AGIs $25k-50k, 3.4% for AGIs $50k-75k)
Taxable individual retirement arrangement distribution: $12,425 (reported on 8.9% of returns)
49885:
$12,425
Michigan:
$15,298
(% of AGI for various income ranges: 3.0% for AGIs below $25k, 5.2% for AGIs $25k-50k, 5.1% for AGIs $75k-100k)
Total itemized deductions: $14,955 (21% of AGI, reported on 24.4% of returns)
Here:
$14,955
State:
$21,628
Here:
20.8% of AGI
State:
18.4% of AGI
(% of AGI for various income ranges: 10.3% for AGIs $25k-50k, 7.4% for AGIs $50k-75k, 7.1% for AGIs $75k-100k, 9.8% for AGIs $100k-200k)
Charity contributions: $2,693 (reported on 16.7% of returns)
Here:
$2,693
State:
$4,225
(% of AGI for various income ranges: 1.0% for AGIs $25k-50k, 0.6% for AGIs $50k-75k, 1.0% for AGIs $75k-100k, 1.6% for AGIs $100k-200k)
Taxes paid: $4,886 (reported on 24.4% of returns)
49885:
$4,886
State:
$8,327
(% of AGI for various income ranges: 2.4% for AGIs $25k-50k, 2.4% for AGIs $50k-75k, 2.3% for AGIs $75k-100k, 4.0% for AGIs $100k-200k)
Earned income credit: $1,675 (reported on 13.3% of returns)
Here:
$1,675
State:
$2,306
(% of AGI for various income ranges: 3.7% for AGIs below $25k, 0.7% for AGIs $25k-50k)
Percentage of individuals using paid preparers for their 2012 taxes: 56.7%
Here:
57%
State:
57%
(% for various income ranges: 50.0% for AGIs below $25k, 56.5% for AGIs $25k-50k, 58.8% for AGIs $50k-75k, 60.0% for AGIs $75k-100k, 75.0% for AGIs $100k-200k)
Averages for the 2004 tax year for zip code 49885, filed in 2005:
Average Adjusted Gross Income (AGI) in 2004: $38,650 (Individual Income Tax Returns)
Here:
$38,650
State:
$48,204
Salary/wage: $35,046 (reported on 86.0% of returns)
Here:
$35,046
State:
$42,791
(% of AGI for various income ranges: 194.5% for AGIs below $10k, 66.7% for AGIs $10k-25k, 75.8% for AGIs $25k-50k, 78.4% for AGIs $50k-75k, 82.6% for AGIs $75k-100k, 74.7% for AGIs over 100k)
Taxable interest for individuals: $634 (reported on 49.4% of returns)
This zip code:
$634
Michigan:
$1,725
(% of AGI for various income ranges: 4.6% for AGIs below $10k, 1.3% for AGIs $10k-25k, 1.2% for AGIs $25k-50k, 0.5% for AGIs $50k-75k, 0.3% for AGIs $75k-100k, 0.6% for AGIs over 100k)
Taxable dividends: $522 (reported on 17.6% of returns)
Here:
$522
State:
$3,420
(% of AGI for various income ranges: 0.5% for AGIs $10k-25k, 0.2% for AGIs $25k-50k, 0.1% for AGIs $50k-75k, 0.2% for AGIs $75k-100k, 0.3% for AGIs over 100k)
Net capital gain/loss: +$2,715 (reported on 15.7% of returns)
Here:
+$2,715
State:
+$8,532
(% of AGI for various income ranges: -0.3% for AGIs $10k-25k, 0.9% for AGIs $25k-50k, 1.9% for AGIs $50k-75k, 1.7% for AGIs $75k-100k)
Profit/loss from business: +$3,431 (reported on 16.6% of returns)
Here:
+$3,431
State:
+$9,547
(% of AGI for various income ranges: 16.3% for AGIs below $10k, 4.7% for AGIs $10k-25k, 1.9% for AGIs $25k-50k, 1.5% for AGIs $50k-75k, -0.6% for AGIs $75k-100k)
IRA payment deduction: $2,421 (reported on 2.4% of returns)
49885:
$2,421
Michigan:
$2,875
Total itemized deductions: $14,481 (22% of AGI, reported on 23.1% of returns)
Here:
$14,481
State:
$18,509
Here:
22.2% of AGI
State:
20.7% of AGI
(% of AGI for various income ranges: 5.1% for AGIs $10k-25k, 6.9% for AGIs $25k-50k, 10.4% for AGIs $50k-75k, 9.1% for AGIs $75k-100k, 10.9% for AGIs over 100k)
Charity contributions deductions: $2,057 (3% of AGI, reported on 20.3% of returns)
Here:
$2,057
State:
$3,365
Here:
3.0% of AGI
State:
3.6% of AGI
(% of AGI for various income ranges: 0.2% for AGIs $10k-25k, 0.4% for AGIs $25k-50k, 1.4% for AGIs $50k-75k, 1.3% for AGIs $75k-100k, 2.3% for AGIs over 100k)
Total tax: $4,315 (reported on 78.3% of returns)
49885:
$4,315
State:
$7,691
(% of AGI for various income ranges: 4.9% for AGIs below $10k, 4.3% for AGIs $10k-25k, 6.2% for AGIs $25k-50k, 8.1% for AGIs $50k-75k, 10.1% for AGIs $75k-100k, 16.9% for AGIs over 100k)
Earned income credit: $1,535 (reported on 12.6% of returns)
Here:
$1,535
State:
$1,737
Percentage of individuals using paid preparers for their 2004 taxes: 58.1%
Here:
58%
State:
60%
(% for various income ranges: 38.6% for AGIs below $10k, 61.5% for AGIs $10k-25k, 60.5% for AGIs $25k-50k, 65.0% for AGIs $50k-75k, 59.1% for AGIs $75k-100k, 79.3% for AGIs over 100k)
Likely homosexual households (counted as self-reported same-sex unmarried-partner households)
Lesbian couples: 0.0% of all households
Gay men: 2.1% of all households
Household received Food Stamps/SNAP in the past 12 months: 96 Household did not receive Food Stamps/SNAP in the past 12 months: 674
Women who had a birth in the past 12 months: 4 (4 now married, 0 unmarried) Women who did not have a birth in the past 12 months: 339 (157 now married, 181 unmarried)
Housing units in zip code 49885 with a mortgage: 421 (44 second mortgage, 43 both second mortgage and home equity loan) Houses without a mortgage: 40
Median monthly owner costs for units with a mortgage: $1,254 Median monthly owner costs for units without a mortgage: $459
Residents with income below the poverty level in 2022:
This zip code:
14.0%
Whole state:
13.4%
Residents with income below 50% of the poverty level in 2022:
This zip code:
10.0%
Whole state:
6.9%
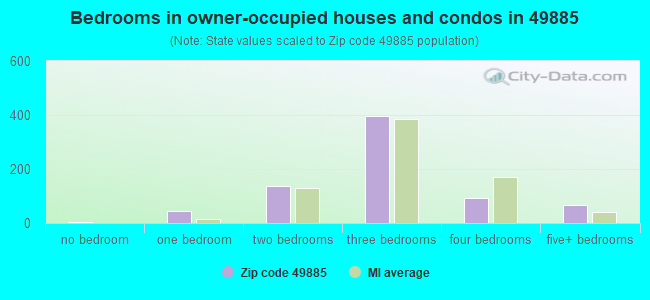
Median number of rooms in houses and condos:
Here:
6.1
State:
6.5
Median number of rooms in apartments:
Here:
6.6
State:
4.3
Notable locations in this zip code not listed on our city pages
Notable locations in zip code 49885: Swanzy Station (A), Yalmar Station (B), Laughing Whitefish Falls Scenic Site (C), Upper Peninsula Experimental Forest Headquarters (D), Skandia - West Branch Volunteer Fire Department (E). Display/hide their locations on the map
Churches in zip code 49885 include: Emmanuel Church (A), Evangelical Covenant Church (B), Country Chapel (C), Heritage Baptist Church (D), Skandia United Methodist Church (E). Display/hide their locations on the map
Cemeteries: Emmanuel Lutheran Church Cemetery (1), Haglund Cemetery (2), West Branch Cemetery (3), United Methodist Church Cemetery (4). Display/hide their locations on the map
Lakes: Martin Lake (A), MacGregor Lake (B), Provost Lake (C), Wilson Lake (D), Big Trout Lake (E), Abraham Lake (F), Northwestern Lake (G), Morbit Lake (H). Display/hide their locations on the map
Rivers and creeks: Nelson Creek (A), West Branch Chocolay River (B), Dorsey Creek (C), McMaster Creek (D), Wise Man Creek (E), Silver Lead Creek (F), Sheen Creek (G), Foster Creek (H), East Branch Chocolay River (I). Display/hide their locations on the map
Size of family households: 306 2-persons, 106 3-persons, 37 4-persons, 32 5-persons, 16 6-persons, 7 7-or-more-persons
Size of nonfamily households: 185 1-person, 80 2-persons, 1 5-persons
236 married couples with children.
71 single-parent households (30 men, 41 women).
97.3% of residents of 49885 zip code speak English at home.
0.7% of residents speak Spanish at home (100% very well).
1.3% of residents speak other Indo-European language at home (100% very well).
0.5% of residents speak Asian or Pacific Island language at home (56% very well, 22% well, 22% not well).
0.1% of residents speak other language at home (100% very well).
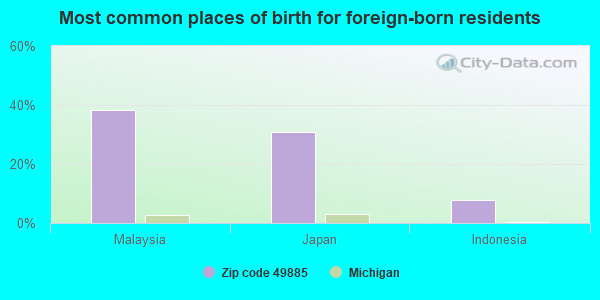
Foreign born population: 12 (0.7%) (16.1% of them are naturalized citizens)
This zip code:
0.7%
Whole state:
6.9%
38%Malaysia
31%Japan
8%Indonesia
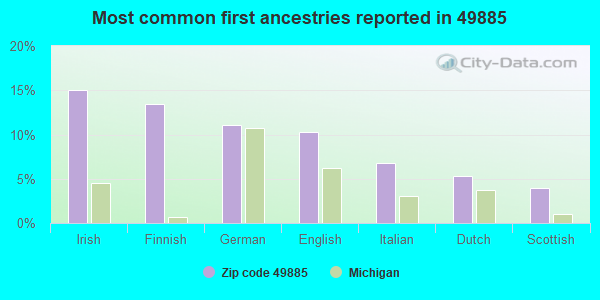
15%Irish
13%Finnish
11%German
10%English
7%Italian
5%Dutch
4%Scottish
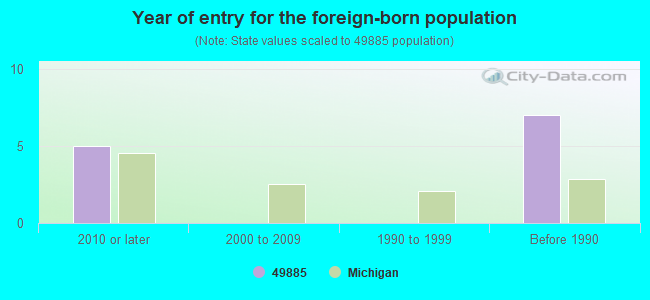
Year of entry for the foreign-born population
52010 or later
02000 to 2009
01990 to 1999
7Before 1990
Facilities with environmental interests located in this zip code:
MI DEPT/ENVIRONMENTAL QUALITY (9535 US HWY 41 SOUTH in SKANDIA, MI)
(Resource Conservation and Recovery Act (tracking hazardous waste)) Organizations: MDEQ - RRD (CONTACT/OPERATOR)
, MARK AND HOLLY PATON (CONTACT/OPERATOR)
Alternative names: MDEQ PATONS COUNTRY STORE
BAHRMANS FARMS (9370 US 41 in SKANDIA, MI)
(Resource Conservation and Recovery Act (tracking hazardous waste)) Organizations: BAHRMAN HAROLD (CONTACT/OWNER)
Housing units lacking complete plumbing facilities: 6.9% Housing units lacking complete kitchen facilities: 5.3%
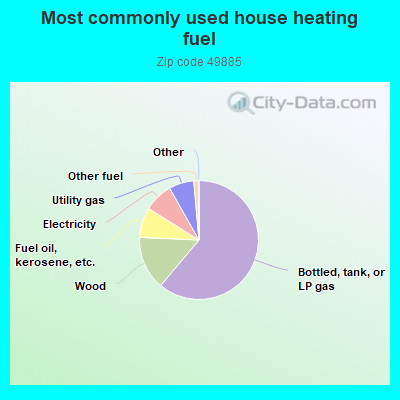
61.2%Bottled, tank, or LP gas
14.6%Wood
8.2%Fuel oil, kerosene, etc.
7.9%Electricity
6.8%Utility gas
1.3%Other fuel
Population in 1990: 1,975. Population change in the 1990s: +99 (+5.0%).
Place of birth for U.S.-born residents:
This state: 1,321
Northeast: 77
Midwest: 231
South: 33
West: 150
67% of the 49885 zip code residents lived in the same house 5 years ago. Out of people who lived in different houses, 60% lived in this county. Out of people who lived in different counties, 50% lived in Michigan.
91% of the 49885 zip code residents lived in the same house 1 year ago. Out of people who lived in different houses, 56% moved from this county. Out of people who lived in different houses, 29% moved from different county within same state. Out of people who lived in different houses, 13% moved from different state. Out of people who lived in different houses, 2% moved from abroad.
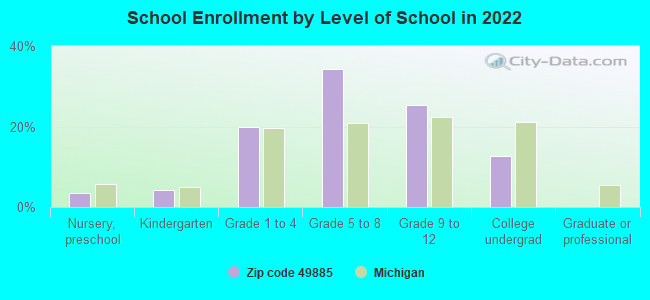
Private vs. public school enrollment:
Students in private schools in grades 1 to 8 (elementary and middle school): 3
Here:
1.8%
Michigan:
12.4%
Students in private schools in grades 9 to 12 (high school):
Here:
0.0%
Michigan:
9.8%
Students in private undergraduate colleges: 2
Here:
6.8%
Michigan:
14.9%
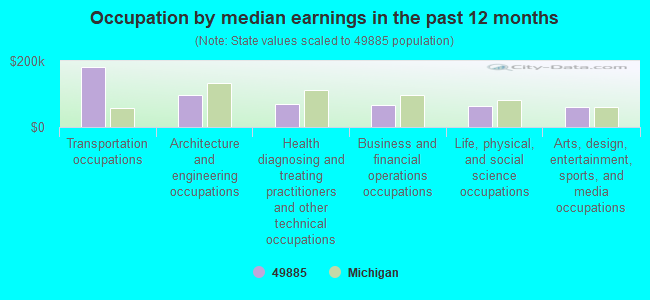
Occupation by median earnings in the past 12 months ($)
182,738Transportation occupations
98,429Architecture and engineering occupations
69,087Health diagnosing and treating practitioners and other technical occupations
67,146Business and financial operations occupations
62,933Life, physical, and social science occupations
60,535Arts, design, entertainment, sports, and media occupations
Top industries in this zip code by the number of employees in 2005:
Construction: New Single-Family Housing Construction (except Operative Builders) (5-9 employees: 1 establishment, 1-4 employees: 2 establishments)
Construction: Residential Remodelers (1-4: 4)
Professional, Scientific, and Technical Services: Marketing Consulting Services (5-9: 1)
Other Services (except Public Administration): Religious Organizations (1-4: 2)
Construction: Plumbing, Heating, and Air-Conditioning Contractors (1-4: 2)
Other Services (except Public Administration): General Automotive Repair (1-4: 1)
Utilities: Water Supply and Irrigation Systems (1-4: 1)
Educational Services: Educational Support Services (1-4: 1)
People in group quarters in 2000:
3 people in other group homes
Fatal accident statistics in 2013:
Fatal accident count: 1
Vehicles involved in fatal accidents: 1
Fatal accidents caused by drunken drivers: 1
Fatalities: 1
Persons involved in fatal accidents: 1
Pedestrians involved in fatal accidents: 0
Fatal accident statistics in 2011:
Fatal accident count: 1
Vehicles involved in fatal accidents: 1
Fatal accidents caused by drunken drivers: 0
Fatalities: 1
Persons involved in fatal accidents: 1
Pedestrians involved in fatal accidents: 0
Most common first names in zip code 49885 among deceased individuals
Name
Count
Lived (average)
James
8
59.9 years
Charles
7
70.1 years
John
7
74.9 years
Anna
6
82.5 years
Mary
6
76.9 years
William
6
77.5 years
Dorothy
5
76.2 years
Joseph
5
77.0 years
Richard
5
59.4 years
Florence
4
78.7 years
Most common last names in zip code 49885 among deceased individuals
Last name
Count
Lived (average)
Johnson
19
78.5 years
Heath
7
78.3 years
Larson
7
82.3 years
Winters
6
82.7 years
Anderson
6
69.3 years
Bahrman
6
80.5 years
Mcmaster
5
74.2 years
Haglund
5
73.8 years
Nelson
4
84.2 years
Heidtman
4
78.2 years
Discuss , Michigan (MI) on our hugely popular Michigan forum.


 Nearest zip codes: 49833, 49826, 49822, 49891, 49825, 49880.