Estimated zip code population in 2022: 3,795 Zip code population in 2010: 3,857 Zip code population in 2000: 4,002
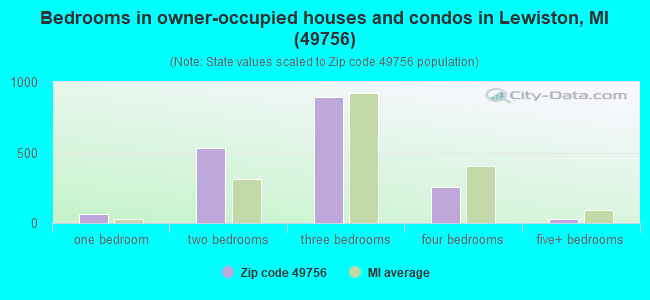
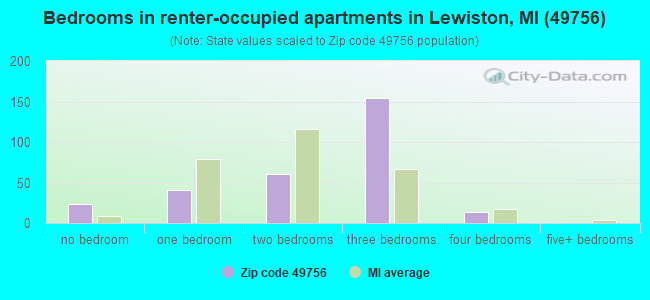
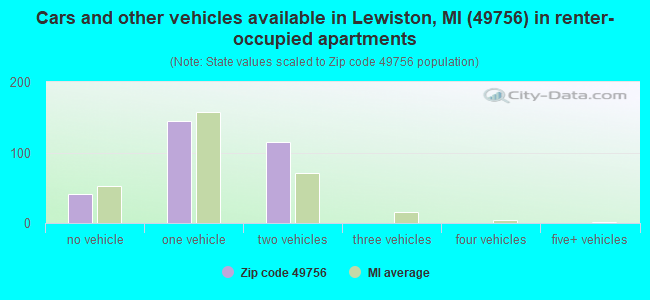
Houses and condos: 4,568 Renter-occupied apartments: 301
% of renters here:
15%
State:
27%
March 2022 cost of living index in zip code 49756: 82.3 (low, U.S. average is 100)
Land area: 163.5 sq. mi. Water area: 5.2 sq. mi.
Population density: 23 people per square mile
(very low).
OSM Map
General Map
Google Map
MSN Map
OSM Map
General Map
Google Map
MSN Map
OSM Map
General Map
Google Map
MSN Map
OSM Map
General Map
Google Map
MSN Map
Please wait while loading the map...
Real estate property taxes paid for housing units in 2022:
This zip code:
0.9% ($1,506)
Michigan:
1.2% ($2,746)
Median real estate property taxes paid for housing units with mortgages in 2022: $1,461 (0.8%) Median real estate property taxes paid for housing units with no mortgage in 2022: $1,616 (1.1%)
Business Search- 14 Million verified businesses
Males: 2,044
(53.8%)
Females: 1,751
(46.2%)
For population 25 years and over in 49756:
High school or higher: 88.1%
Bachelor's degree or higher: 17.8%
Graduate or professional degree: 7.0%
Unemployed: 6.0%
Mean travel time to work (commute): 21.8 minutes
For population 15 years and over in 49756:
Never married: 20.4%
Now married: 57.8%
Separated: 1.3%
Widowed: 8.4%
Divorced: 12.2%
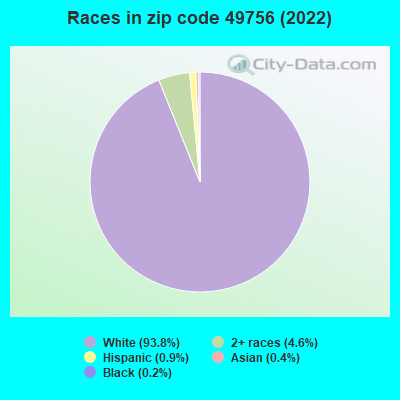
Zip code 49756 compared to state average:
Black race population percentage significantly below state average.
Hispanic race population percentage significantly below state average.
Median age significantly above state average.
Foreign-born population percentage significantly below state average.
Renting percentage below state average.
Length of stay since moving in below state average.
Number of rooms per house below state average.
Number of college students significantly below state average.
Averages for the 2020 tax year for zip code 49756, filed in 2021:
Average Adjusted Gross Income (AGI) in 2020: $49,931 (Individual Income Tax Returns)
Here:
$49,931
State:
$68,945
Salary/wage: $39,564 (reported on 64.6% of returns)
Here:
$39,564
State:
$57,142
(% of AGI for various income ranges: 729.2% for AGIs below $25k, 2594.4% for AGIs $25k-50k, 4280.0% for AGIs $50k-75k, 6580.0% for AGIs $75k-100k, 11050.8% for AGIs $100k-200k)
Taxable interest for individuals: $1,169 (reported on 35.4% of returns)
This zip code:
$1,169
Michigan:
$1,630
(% of AGI for various income ranges: 19.2% for AGIs below $25k, 49.8% for AGIs $25k-50k, 72.4% for AGIs $50k-75k, 52.2% for AGIs $75k-100k, 157.5% for AGIs $100k-200k)
Ordinary dividends: $4,972 (reported on 18.2% of returns)
Here:
$4,972
State:
$6,972
(% of AGI for various income ranges: 35.5% for AGIs below $25k, 41.6% for AGIs $25k-50k, 101.0% for AGIs $50k-75k, 441.1% for AGIs $75k-100k, 361.7% for AGIs $100k-200k)
Net capital gain/loss in AGI: +$7,771 (reported on 17.2% of returns)
Here:
+$7,771
State:
+$20,064
(% of AGI for various income ranges: 5.3% for AGIs below $25k, 40.7% for AGIs $25k-50k, 105.7% for AGIs $50k-75k, 393.3% for AGIs $75k-100k, 645.8% for AGIs $100k-200k)
Profit/loss from business: +$12,310 (reported on 10.6% of returns)
Here:
+$12,310
State:
+$11,172
(% of AGI for various income ranges: 75.5% for AGIs below $25k, 125.3% for AGIs $25k-50k, 332.4% for AGIs $50k-75k, 790.0% for AGIs $100k-200k)
Taxable individual retirement arrangement distribution: $16,744 (reported on 16.2% of returns)
49756:
$16,744
Michigan:
$19,803
(% of AGI for various income ranges: 93.4% for AGIs below $25k, 162.6% for AGIs $25k-50k, 391.0% for AGIs $50k-75k, 935.6% for AGIs $75k-100k, 2084.2% for AGIs $100k-200k)
Total itemized deductions: $25,520 (reported on 2.5% of returns)
Here:
$25,520
State:
$34,117
(% of AGI for various income ranges: 1063.3% for AGIs $100k-200k)
Charity contributions: $9,200 (reported on 1.5% of returns)
Here:
$9,200
State:
$13,548
(% of AGI for various income ranges: 230.0% for AGIs $100k-200k)
Taxes paid: $8,325 (reported on 2.0% of returns)
49756:
$8,325
State:
$7,972
(% of AGI for various income ranges: 277.5% for AGIs $100k-200k)
Earned income credit: $2,059 (reported on 13.6% of returns)
Here:
$2,059
State:
$2,251
(% of AGI for various income ranges: 54.3% for AGIs below $25k, 62.3% for AGIs $25k-50k)
Percentage of individuals using paid preparers for their 2020 taxes: 93.9%
Here:
94%
State:
93%
(% for various income ranges: 92.2% for AGIs below $25k, 96.3% for AGIs $25k-50k, 93.1% for AGIs $50k-75k, 92.9% for AGIs $75k-100k, 95.0% for AGIs $100k-200k, 100.0% for AGIs over 200k)
Averages for the 2012 tax year for zip code 49756, filed in 2013:
Average Adjusted Gross Income (AGI) in 2012: $37,759 (Individual Income Tax Returns)
Here:
$37,759
State:
$55,609
Salary/wage: $26,314 (reported on 66.3% of returns)
Here:
$26,314
State:
$46,782
(% of AGI for various income ranges: 48.2% for AGIs below $25k, 50.1% for AGIs $25k-50k, 46.4% for AGIs $50k-75k, 49.6% for AGIs $75k-100k, 39.8% for AGIs $100k-200k)
Taxable interest for individuals: $1,521 (reported on 37.7% of returns)
This zip code:
$1,521
Michigan:
$1,491
(% of AGI for various income ranges: 1.9% for AGIs below $25k, 1.2% for AGIs $25k-50k, 2.1% for AGIs $50k-75k, 1.8% for AGIs $75k-100k, 0.9% for AGIs $100k-200k)
Ordinary dividends: $3,211 (reported on 20.6% of returns)
Here:
$3,211
State:
$6,225
(% of AGI for various income ranges: 2.2% for AGIs below $25k, 1.7% for AGIs $25k-50k, 2.0% for AGIs $50k-75k, 2.4% for AGIs $75k-100k, 1.0% for AGIs $100k-200k)
Net capital gain/loss in AGI: +$5,212 (reported on 14.3% of returns)
Here:
+$5,212
State:
+$9,326
(% of AGI for various income ranges: 1.2% for AGIs $75k-100k, 7.6% for AGIs $100k-200k)
Profit/loss from business: +$10,467 (reported on 12.0% of returns)
Here:
+$10,467
State:
+$11,523
(% of AGI for various income ranges: 7.5% for AGIs below $25k, 4.2% for AGIs $25k-50k, 1.8% for AGIs $50k-75k, 5.7% for AGIs $75k-100k)
Taxable individual retirement arrangement distribution: $12,297 (reported on 17.7% of returns)
49756:
$12,297
Michigan:
$15,298
(% of AGI for various income ranges: 5.7% for AGIs below $25k, 3.8% for AGIs $25k-50k, 5.7% for AGIs $50k-75k, 9.2% for AGIs $75k-100k, 5.8% for AGIs $100k-200k)
Total itemized deductions: $17,223 (22% of AGI, reported on 20.0% of returns)
Here:
$17,223
State:
$21,628
Here:
22.5% of AGI
State:
18.4% of AGI
(% of AGI for various income ranges: 8.2% for AGIs below $25k, 7.6% for AGIs $25k-50k, 9.7% for AGIs $50k-75k, 7.7% for AGIs $75k-100k, 11.2% for AGIs $100k-200k)
Charity contributions: $2,841 (reported on 15.4% of returns)
Here:
$2,841
State:
$4,225
(% of AGI for various income ranges: 0.5% for AGIs below $25k, 1.0% for AGIs $25k-50k, 1.5% for AGIs $50k-75k, 0.8% for AGIs $75k-100k, 1.6% for AGIs $100k-200k)
Taxes paid: $5,617 (reported on 20.0% of returns)
49756:
$5,617
State:
$8,327
(% of AGI for various income ranges: 2.0% for AGIs below $25k, 1.7% for AGIs $25k-50k, 2.8% for AGIs $50k-75k, 2.4% for AGIs $75k-100k, 5.1% for AGIs $100k-200k)
Earned income credit: $1,847 (reported on 18.3% of returns)
Here:
$1,847
State:
$2,306
(% of AGI for various income ranges: 4.4% for AGIs below $25k, 0.8% for AGIs $25k-50k)
Percentage of individuals using paid preparers for their 2012 taxes: 57.7%
Here:
58%
State:
57%
(% for various income ranges: 52.7% for AGIs below $25k, 58.5% for AGIs $25k-50k, 65.2% for AGIs $50k-75k, 70.0% for AGIs $75k-100k, 70.0% for AGIs $100k-200k)
Averages for the 2004 tax year for zip code 49756, filed in 2005:
Average Adjusted Gross Income (AGI) in 2004: $31,906 (Individual Income Tax Returns)
Here:
$31,906
State:
$48,204
Salary/wage: $22,222 (reported on 73.1% of returns)
Here:
$22,222
State:
$42,791
(% of AGI for various income ranges: 70.8% for AGIs below $10k, 45.5% for AGIs $10k-25k, 55.3% for AGIs $25k-50k, 51.2% for AGIs $50k-75k, 50.5% for AGIs $75k-100k, 45.6% for AGIs over 100k)
Taxable interest for individuals: $2,064 (reported on 53.2% of returns)
This zip code:
$2,064
Michigan:
$1,725
(% of AGI for various income ranges: 5.7% for AGIs below $10k, 4.8% for AGIs $10k-25k, 2.9% for AGIs $25k-50k, 2.3% for AGIs $50k-75k, 3.3% for AGIs $75k-100k, 4.3% for AGIs over 100k)
Taxable dividends: $2,143 (reported on 26.2% of returns)
Here:
$2,143
State:
$3,420
(% of AGI for various income ranges: 3.2% for AGIs below $10k, 1.6% for AGIs $10k-25k, 1.1% for AGIs $25k-50k, 1.6% for AGIs $50k-75k, 4.4% for AGIs $75k-100k, 1.2% for AGIs over 100k)
Net capital gain/loss: +$5,949 (reported on 20.3% of returns)
Here:
+$5,949
State:
+$8,532
(% of AGI for various income ranges: -2.4% for AGIs below $10k, -0.1% for AGIs $10k-25k, 0.7% for AGIs $25k-50k, 2.1% for AGIs $50k-75k, 5.8% for AGIs $75k-100k, 14.8% for AGIs over 100k)
Profit/loss from business: +$5,793 (reported on 14.5% of returns)
Here:
+$5,793
State:
+$9,547
(% of AGI for various income ranges: 4.4% for AGIs below $10k, 4.5% for AGIs $10k-25k, 2.5% for AGIs $25k-50k, 0.2% for AGIs $50k-75k, 1.0% for AGIs $75k-100k, 4.9% for AGIs over 100k)
IRA payment deduction: $2,250 (reported on 2.6% of returns)
49756:
$2,250
Michigan:
$2,875
Total itemized deductions: $14,489 (25% of AGI, reported on 21.9% of returns)
Here:
$14,489
State:
$18,509
Here:
24.9% of AGI
State:
20.7% of AGI
(% of AGI for various income ranges: 11.9% for AGIs below $10k, 9.5% for AGIs $10k-25k, 8.4% for AGIs $25k-50k, 9.2% for AGIs $50k-75k, 13.3% for AGIs $75k-100k, 11.4% for AGIs over 100k)
Charity contributions deductions: $1,919 (3% of AGI, reported on 18.7% of returns)
Here:
$1,919
State:
$3,365
Here:
3.1% of AGI
State:
3.6% of AGI
(% of AGI for various income ranges: 0.6% for AGIs below $10k, 0.8% for AGIs $10k-25k, 0.8% for AGIs $25k-50k, 1.1% for AGIs $50k-75k, 1.7% for AGIs $75k-100k, 1.8% for AGIs over 100k)
Total tax: $3,734 (reported on 70.5% of returns)
49756:
$3,734
State:
$7,691
(% of AGI for various income ranges: 2.0% for AGIs below $10k, 3.2% for AGIs $10k-25k, 6.3% for AGIs $25k-50k, 8.7% for AGIs $50k-75k, 10.4% for AGIs $75k-100k, 15.5% for AGIs over 100k)
Earned income credit: $1,654 (reported on 16.4% of returns)
Here:
$1,654
State:
$1,737
Percentage of individuals using paid preparers for their 2004 taxes: 65.2%
Here:
65%
State:
60%
(% for various income ranges: 59.6% for AGIs below $10k, 63.2% for AGIs $10k-25k, 68.1% for AGIs $25k-50k, 68.6% for AGIs $50k-75k, 70.9% for AGIs $75k-100k, 77.3% for AGIs over 100k)
Household received Food Stamps/SNAP in the past 12 months: 186 Household did not receive Food Stamps/SNAP in the past 12 months: 1,870
Women who had a birth in the past 12 months: 8 (3 now married, 4 unmarried) Women who did not have a birth in the past 12 months: 521 (232 now married, 288 unmarried)
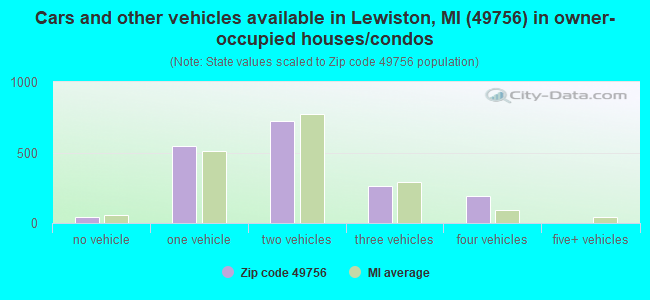
Housing units in zip code 49756 with a mortgage: 946 (78 second mortgage, 10 home equity loan, 51 both second mortgage and home equity loan) Houses without a mortgage: 64
Median monthly owner costs for units with a mortgage: $1,111 Median monthly owner costs for units without a mortgage: $466
Residents with income below the poverty level in 2022:
This zip code:
16.2%
Whole state:
13.4%
Residents with income below 50% of the poverty level in 2022:
This zip code:
5.8%
Whole state:
6.9%
Median number of rooms in houses and condos:
Here:
5.9
State:
6.5
Median number of rooms in apartments:
Here:
4.3
State:
4.3
Notable locations in this zip code not listed on our city pages
Notable locations in zip code 49756: Garland Monarch Golf Course (A), Garland Swampfire Golf Course (B), Garland Reflections Golf Course (C), Garland Fountains Golf Course (D), Muskrat Lake State Forest Campground (E), Indian Village Boys Camp (F), Hunt Creek Fisheries Research Area (G), Gassel Lodge (H), Camp Nakomis (I), Homestead Hunting Club (J), Trowbridges Resort (K), Comstock Tobogan Slide (L), Organs Log Cabins (M), Sheridan Valley Ski Area (N), Lewiston Shady Acres Campground (O), Cowhand Ranch (P), Murrays Cabins (Q), Parmalee Bridge Recreation Site (R), Birdhaven Resort (S), Little Wolf Lake State Forest Campground (T). Display/hide their locations on the map
Churches in zip code 49756 include: First Congregational Community Church (A), Saint Francis Church (B), Bethlehem Church (C), First Baptist Church (D). Display/hide their locations on the map
Lakes: Marshall Pond (A), Pickerel Lake (B), Little Wolf Lake (C), Perry Lake (D), Perch Lake (E), Little Crystal Lake (F), Little Bear Lake (G), Lilypad Lake (H). Display/hide their locations on the map
Parks in zip code 49756 include: Hunt Creek Fisheries Research Area (1), Congregational United Church of Christ Historical Marker (2), Camp Lunden Historical Marker (3), Angusdale Stock Farm Historical Marker (4), Bingham Park (5). Display/hide their locations on the map
In group quarters: 7 (-1 institutionalized population)
Size of family households: 918 2-persons, 207 3-persons, 114 4-persons, 20 5-persons, 7 6-persons, 13 7-or-more-persons
Size of nonfamily households: 708 1-person, 89 2-persons
180 married couples with children.
150 single-parent households (58 men, 92 women).
100.2% of residents of 49756 zip code speak English at home.
0.3% of residents speak Spanish at home (58% very well, 42% well).
0.1% of residents speak other Indo-European language at home (40% very well, 60% well).
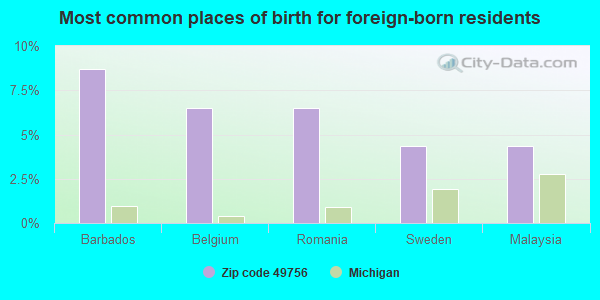
Foreign born population: 46 (1.2%) (62.1% of them are naturalized citizens)
This zip code:
1.2%
Whole state:
6.9%
9%Barbados
7%Belgium
7%Romania
4%Sweden
4%Malaysia
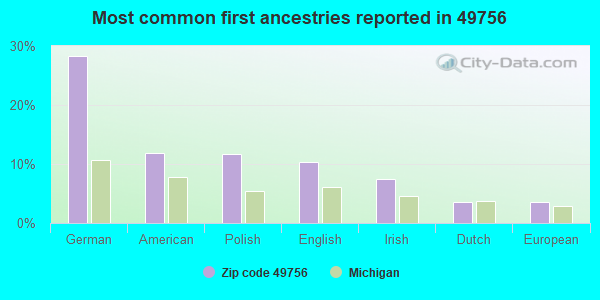
28%German
12%American
12%Polish
10%English
8%Irish
4%Dutch
4%European
Year of entry for the foreign-born population
22010 or later
222000 to 2009
51990 to 1999
21Before 1990
Facilities with environmental interests located in this zip code:
GARLAND INC (4700 N RED OAK in LEWISTON, MI)
National Pollutant Discharge Elimination System NON-MAJOR (Tracking pollutant discharge elimination systems) - permit Conditionally Exempt Small Quantity Generators, less than 100 kg/month of hazardous waste (Resource Conservation and Recovery Act (tracking hazardous waste)) Business SIC classification: HOTELS AND MOTELS Alternative names: GARLAND RESORT
MI DEPT/ENVIRONMENTAL QUALITY (2980 KNEELAND ST in LEWISTON, MI)
(Resource Conservation and Recovery Act (tracking hazardous waste)) Alternative names: SUN OIL CO
GARLAND COUNTRY CLUB (RTE 1 CO RD 489 in LEWISTON, MI)
(Resource Conservation and Recovery Act (tracking hazardous waste)) Organizations: OTTO RONALD (CONTACT/OWNER)
GREAT LAKES COMPRESSION INC (3690 COUNTY RD 491 in LEWISTON, MI)
(Resource Conservation and Recovery Act (tracking hazardous waste)) Business NAICS classification: OIL AND GAS FIELD MACHINERY AND EQUIPMENT MANUFACTURING. Organizations: NATURAL GAS SERVICES GROUP INC (CONTACT/OWNER)
GARLAND RESORT (4700 N OAK RD in LEWISTON, MI)
National Pollutant Discharge Elimination System NON-MAJOR (Tracking pollutant discharge elimination systems) - permit Business SIC classification: HOTELS AND MOTELS
BIG WOLF FACILITY (SE4 NW4 T29N R1E SEC 36 in LEWISTON, MI)
CRITERIA AND HAZARDOUS AIR POLLUTANT INVENTORY (Inventory of air pollution sources) Business SIC classification: CRUDE PETROLEUM AND NATURAL GAS
MCN OIL AND GAS - ALBERT 1 (NE SE SEC 5 T29N R2E in LEWISTON, MI)
CRITERIA AND HAZARDOUS AIR POLLUTANT INVENTORY (Inventory of air pollution sources) Business SIC classification: CRUDE PETROLEUM AND NATURAL GAS
FORCE ENERGY CO (SW SE SW T28N R02E SEC 17 in LEWISTON, MI)
CRITERIA AND HAZARDOUS AIR POLLUTANT INVENTORY (Inventory of air pollution sources) Business SIC classification: CRUDE PETROLEUM AND NATURAL GAS
FORCE ENERGY CO (NE SW SW T28N R02E SEC 26 in ELMER TWP, MI)
CRITERIA AND HAZARDOUS AIR POLLUTANT INVENTORY (Inventory of air pollution sources) Business SIC classification: CRUDE PETROLEUM AND NATURAL GAS
FORCE ENERGY CORP-ELMER 26 (NE/SW/SW T28N R0ZE SEC 26 in LEWISTON, MI)
AIR SYNTHETIC MINOR (AIRS/AFS) Business SIC classification: CRUDE PETROLEUM AND NATURAL GAS
FORCE ENERGY INC (T24N R2E SW SE SE in ELMER TWP, MI)
CRITERIA AND HAZARDOUS AIR POLLUTANT INVENTORY (Inventory of air pollution sources)
FORCE ENERGY INC. ELMER 17 (SW SE SE SEC 17T28N R02E in LEWISTON, MI)
AIR SYNTHETIC MINOR (AIRS/AFS) Business SIC classification: CRUDE PETROLEUM AND NATURAL GAS
DOMINION EXPLORATION & PROD SAGE CREEK (SE1/4, NW1/4, SEC13, T29N, R2E in LEWISTON, MI)
AIR SYNTHETIC MINOR (AIRS/AFS) Business SIC classification: CRUDE PETROLEUM AND NATURAL GAS Alternative names: WOLVERINE ENVIRONMENTAL
Housing units lacking complete plumbing facilities: 6.7% Housing units lacking complete kitchen facilities: 5.6%
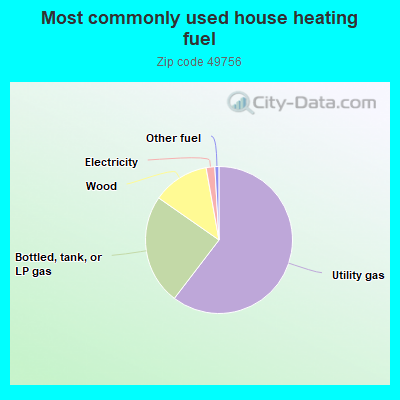
60.4%Utility gas
24.3%Bottled, tank, or LP gas
12.5%Wood
1.9%Electricity
0.9%Other fuel
Population in 1990: 3,327. Population change in the 1990s: +675 (+20.3%).
Place of birth for U.S.-born residents:
This state: 3,113
Northeast: 91
Midwest: 275
South: 146
West: 118
58% of the 49756 zip code residents lived in the same house 5 years ago. Out of people who lived in different houses, 28% lived in this county. Out of people who lived in different counties, 50% lived in Michigan.
90% of the 49756 zip code residents lived in the same house 1 year ago. Out of people who lived in different houses, 27% moved from this county. Out of people who lived in different houses, 54% moved from different county within same state. Out of people who lived in different houses, 21% moved from different state.
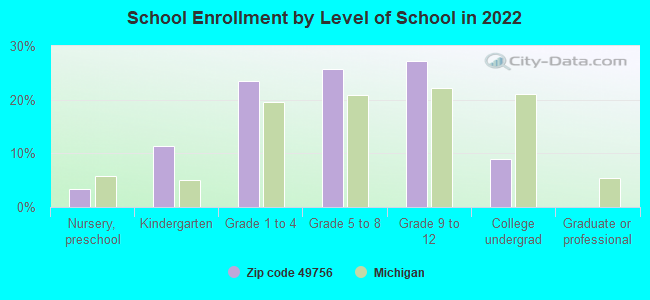
Private vs. public school enrollment:
Students in private schools in grades 1 to 8 (elementary and middle school): 37
Here:
21.0%
Michigan:
12.4%
Students in private schools in grades 9 to 12 (high school): 8
Here:
8.4%
Michigan:
9.8%
Students in private undergraduate colleges: 3
Here:
11.3%
Michigan:
14.9%
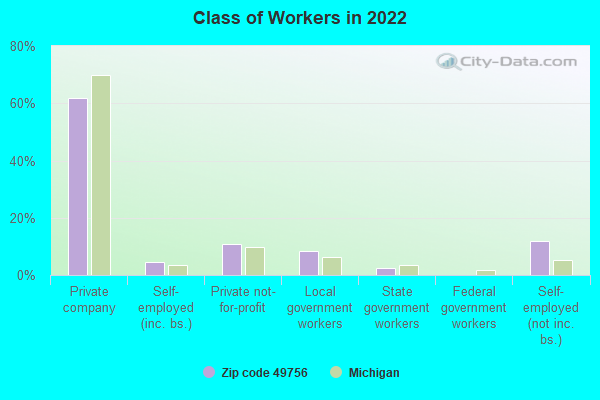
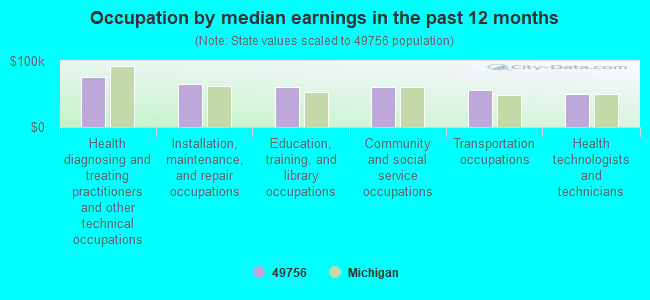
Occupation by median earnings in the past 12 months ($)
75,200Health diagnosing and treating practitioners and other technical occupations
65,194Installation, maintenance, and repair occupations
60,342Education, training, and library occupations
60,317Community and social service occupations
55,867Transportation occupations
49,301Health technologists and technicians
Top industries in this zip code by the number of employees in 2005:
Accommodation and Food Services: Limited-Service Restaurants (20-49: 1, 1-4: 4)
Construction: New Single-Family Housing Construction (except Operative Builders) (5-9: 3, 1-4: 5)
Construction: Plumbing, Heating, and Air-Conditioning Contractors (5-9: 2, 1-4: 1)
Accommodation and Food Services: Snack and Nonalcoholic Beverage Bars (10-19: 1)
People in group quarters in 2010:
11 people in workers' group living quarters and job corps centers
Fatal accident statistics in 2013:
Fatal accident count: 2
Vehicles involved in fatal accidents: 2
Fatal accidents caused by drunken drivers: 0
Fatalities: 2
Persons involved in fatal accidents: 2
Pedestrians involved in fatal accidents: 0
Fatal accident statistics in 2012:
Fatal accident count: 1
Vehicles involved in fatal accidents: 1
Fatal accidents caused by drunken drivers: 1
Fatalities: 1
Persons involved in fatal accidents: 2
Pedestrians involved in fatal accidents: 0
2002 - 2018 National Fire Incident Reporting System (NFIRS) incidents
According to the data from the years 2002 - 2018 the average number of fires per year is 19. The highest number of reported fires - 36 took place in 2003, and the least - 8 in 2005. The data has a decreasing trend.
When looking into fire subcategories, the most incidents belonged to: Structure Fires (52.8%), and Outside Fires (31.8%).
Fire incident types reported to NFIRS in Zip Code 49756


 Nearest zip codes: 49751, 48636, 48647, 49709, 48619, 48621.


 According to the data from the years 2002 - 2018 the average number of fires per year is 19. The highest number of reported fires - 36 took place in 2003, and the least - 8 in 2005. The data has a decreasing trend.
 When looking into fire subcategories, the most incidents belonged to: Structure Fires (52.8%), and Outside Fires (31.8%).